. 2023 Feb 3:21:1473-1486.
doi: 10.1016/j.csbj.2023.02.002. eCollection 2023.

Structural modelling of human complement FHR1 and two of its synthetic derivatives provides insight into their in-vivo functions

Affiliations

Structural modelling of human complement FHR1 and two of its synthetic derivatives provides insight into their in-vivo functions

Natalia Ruiz-Molina et al. Comput Struct Biotechnol J. .

Abstract

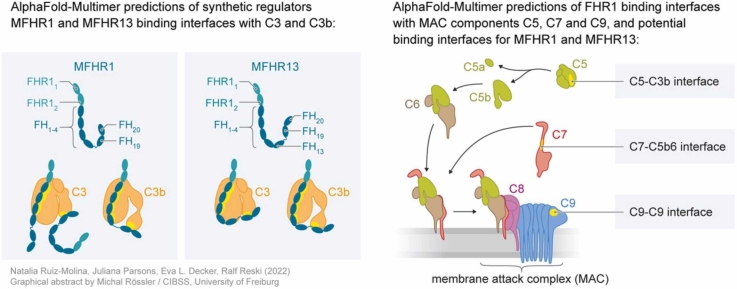
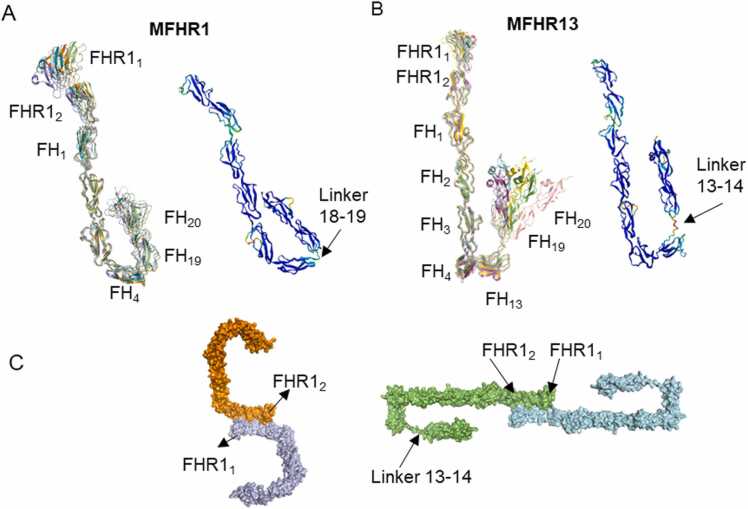
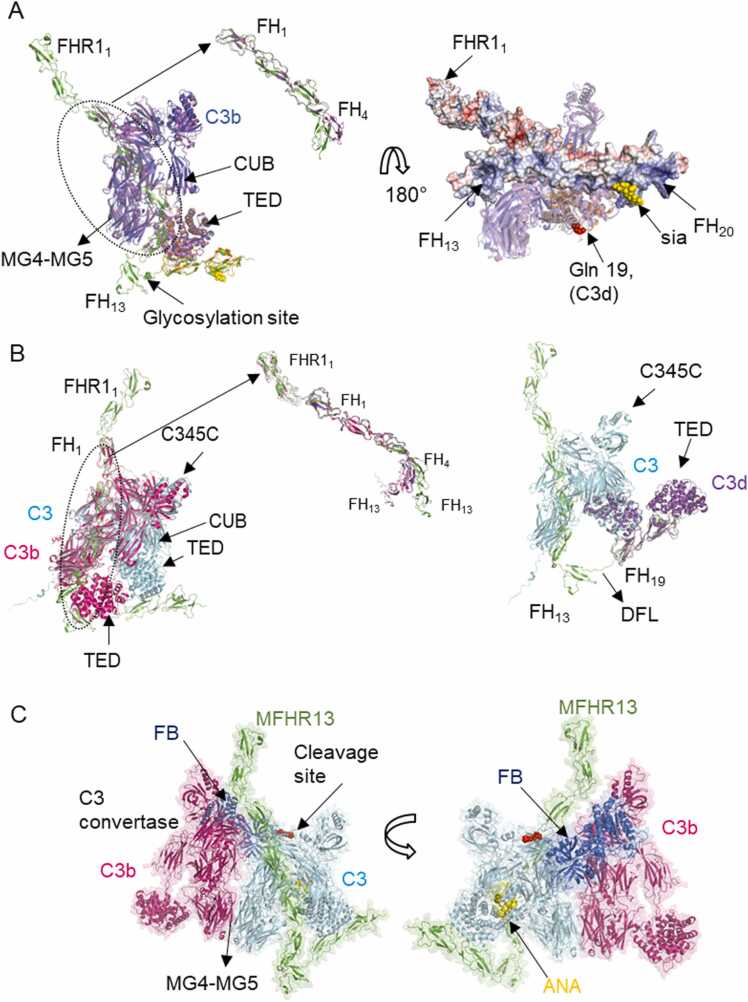
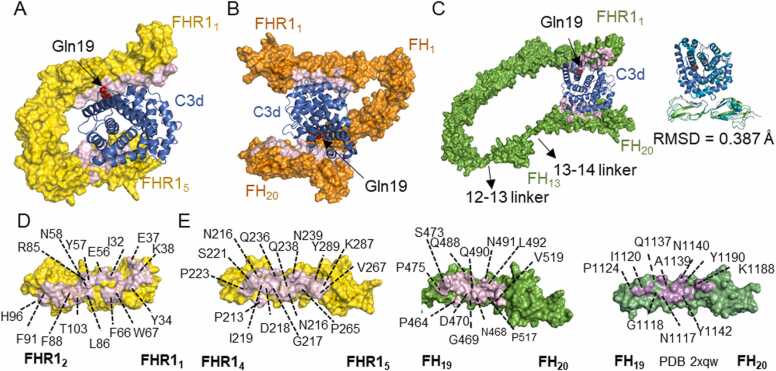
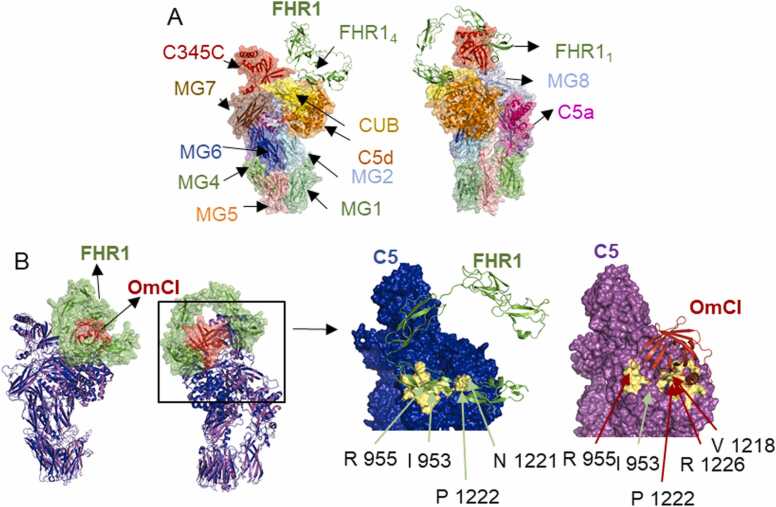
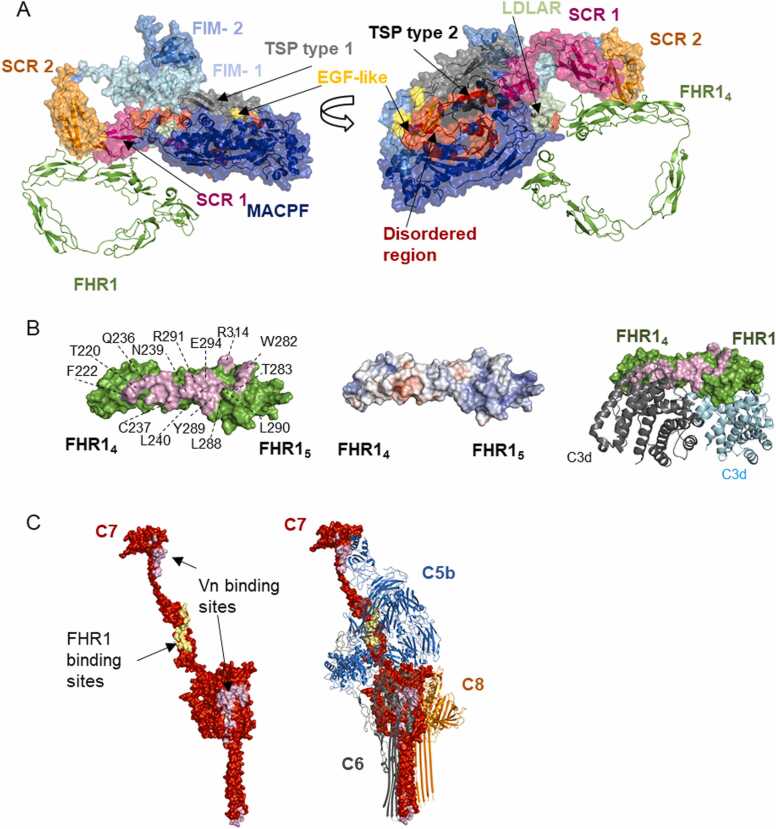
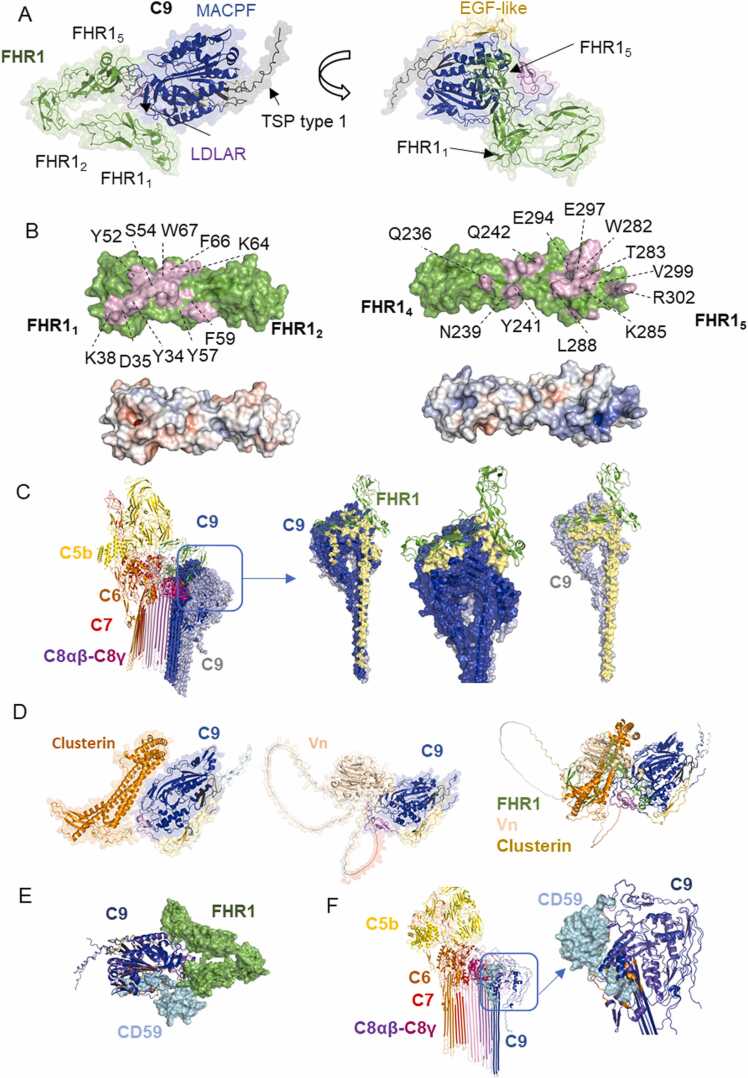
Human complement is the first line of defence against invading pathogens and is involved in tissue homeostasis. Complement-targeted therapies to treat several diseases caused by a dysregulated complement are highly desirable. Despite huge efforts invested in their development, only very few are currently available, and a deeper understanding of the numerous interactions and complement regulation mechanisms is indispensable. Two important complement regulators are human Factor H (FH) and Factor H-related protein 1 (FHR1). MFHR1 and MFHR13, two promising therapeutic candidates based on these regulators, combine the dimerization and C5-regulatory domains of FHR1 with the central C3-regulatory and cell surface-recognition domains of FH. Here, we used AlphaFold2 to model the structure of these two synthetic regulators. Moreover, we used AlphaFold-Multimer (AFM) to study possible interactions of C3 fragments and membrane attack complex (MAC) components C5, C7 and C9 in complex with FHR1, MFHR1, MFHR13 as well as the best-known MAC regulators vitronectin (Vn), clusterin and CD59, whose experimental structures remain undetermined. AFM successfully predicted the binding interfaces of FHR1 and the synthetic regulators with C3 fragments and suggested binding to C3. The models revealed structural differences in binding to these ligands through different interfaces. Additionally, AFM predictions of Vn, clusterin or CD59 with C7 or C9 agreed with previously published experimental results. Because the role of FHR1 as MAC regulator has been controversial, we analysed possible interactions with C5, C7 and C9. AFM predicted interactions of FHR1 with proteins of the terminal complement complex (TCC) as indicated by experimental observations, and located the interfaces in FHR11-2 and FHR14-5. According to AFM prediction, FHR1 might partially block the C3b binding site in C5, inhibiting C5 activation, and block C5b-7 complex formation and C9 polymerization, with similar mechanisms of action as clusterin and vitronectin. Here, we generate hypotheses and give the basis for the design of rational approaches to understand the molecular mechanism of MAC inhibition, which will facilitate the development of further complement therapeutics.

Keywords: AlphaFold; Complement factor H-related 1; Complement regulation; Complement therapeutics; Factor H; Membrane attack complex.


Conflict of interest statement

All authors declare to have no competing interests.

Figures

ga1
Graphical abstract
Fig. 1
Fig. 1
Structure models of the synthetic complement regulators MFHR1 and MFHR13 predicted by AlphaFold2 (AF2). Structure of MFHR1 top-ranked models (A) and MFHR13 (B). Superimposition of the 5 top-ranked models are shown in the left panel, while the best model is displayed in the right panel with the pLDDT score (0−100) by colours (>90 in blue, high confidence, and<50 in red, low confidence). C. Prediction of MFHR1 (left panel) and MFHR13 (right panel) dimerization interface by AlphaFold-Multimer (AFM). The linker between FHR1 and FH domains is also predicted with different possible conformations. (For interpretation of the references to colour in this figure legend, the reader is referred to the web version of this article.)
Fig. 2
Fig. 2
Interaction of MFHR13 with C3 and C3b predicted by AlphaFold-Multimer. A. The model of the complex MFHR13/C3b predicted by AFM agrees with experimental structures of FH fragments in complex with C3b. Superimposition of the model MFHR13 (green) interacting with C3b (blue) with experimental structure of FH1–4/C3b (magenta) (PDB 2wii, RMSD = 1.253 Å), FH19–20/C3d (orange) (PDB 2xqw, RMSD = 0.928 Å) and sialic acid (yellow) (PDB 4ont), (RMSD = 1.253 Å). The thioester-containing domain (TED) and complement C1r/C1s, Uegf, Bmp1 domain (CUB) are indicated by arrows. Zoom in of the superimposition of FH1–4 of the model and the experimental structure is shown. The right panel shows the linkage of C3b (or C3d) to biological surfaces around Gln19 (red spheres) and MFHR13 as a surface with the electrostatic surface potential (electropositive residues in blue and electronegative in red). B. MFHR13 interacts with C3 through FH1–3 and FH19 domains. On the left, MFHR13 and C3 are shown in green and cyan, respectively, and the model is superimposed with C3b in complex with FH1–4 (PDB 2wii, in magenta), where differences in C3 and C3b conformations are observed. RMSD is 2.583 Å for the whole complex superimposed with PDB 2wii, and 1.376 Å for FH1–4, respectively. The right panel shows superimposition of MFHR13/C3 model (green/cyan) with experimental structure FH19–20/C3d (PDB 2qxw, in purple). RMSD is 0.601 Å for C3 TED domain and C3d. The disordered flexible linker (DFL) is shown. C. C3 convertase (C3bBb) in complex with C3/MFHR13 (enzyme-substrate complex). Superimposition of C3 in MFHR13/C3 model with MG4-MG5 domains of C3b molecule in C3 convertase (PDB 2win, C3b in magenta, Bb fragment in dark blue). MFHR13 is shown in green and C3 in light blue with the anaphylatoxin domain (ANA) in yellow and the cleavage site as red spheres. (For interpretation of the references to colour in this figure legend, the reader is referred to the web version of this article.)
Fig. 3
Fig. 3
Interactions of FHR1, MFHR1 and MFHR13 with C3d predicted by AlphaFold-Multimer. A. FHR1 interacts with C3d through FHR14–5 with high confidence score while a second interface in FHR11–2 was predicted overlapping the C3d region linked to biological surfaces around Gln19 (shown as red spheres in all structures). MFHR1 (B) and MFHR13 (C) interact with C3d through FH19–20 with a high confidence score. The same interface in FHR11–2 was identified for these proteins D. Binding interface (in pink) between FHR11–2 and C3d with some residues labelled in FHR1. E. Binding interfaces between FHR4–5 (left side) and FH19–20 with C3d predicted by AFM without templates (center) compared with the experimental structure PDB 2xqw (right side). Some residues in the interface are labelled in FHR1 and FH. (For interpretation of the references to colour in this figure legend, the reader is referred to the web version of this article.)
Fig. 4
Fig. 4
Interaction of C5 and FHR1 predicted by AlphaFold-Multimer. A. Model of FHR1/C5 complex predicted a binding interface in CUB and C5d domains. The colours of C5 domains; shown as surface, match the colour of their legends and FHR1 is shown as cartoon (green). B. Model of FHR1/C5 complex indicates a binding interface in the CUB and C5d domains, similar to complement inhibitor OmCI. Superimposition of the model FHR1/C5 predicted by AFM (C5 cartoon in blue, FHR1 surface in green) and C5 in complex with OmCI (PDB 6rqj) (C5 cartoon in purple, OmCI surface in orange), (RMSD = 0.742 Å). The right panel show the binding interfaces of FHR1/C5 and OmcI/C5 in pale yellow with key residues indicated by green or red arrows, respectively. (For interpretation of the references to colour in this figure legend, the reader is referred to the web version of this article.)
Fig. 5
Fig. 5
Interactions between FHR1 and C7 predicted by AlphaFold-Multimer. A. FHR14–5 interacts with SCRs 1–2 domains of C7 according to top-ranked AFM model. The colours of nine C7 domains, shown as surface, match the colour of their legends and FHR1 is shown as cartoon in green. B. Binding interfaces in FHR1 of the model presented in A (left panel) with electrostatic potential surface (middle panel, electropositive residues in blue and electronegative in red). Some of the residues forming the binding region of FHR1 are labelled (interface shown in light pink). The binding region in FHR14–5 partly overlaps with C3d binding region (right panel). (Experimental structures of C3d/FHR14–5, PDB 3rj3). C. FHR1 and vitronectin binding to C7 would interfere with C5b-7 complex formation. The C7 interacting interfaces with FHR1 and Vn are marked in pale yellow and purple, respectively, on the experimental C7 structure in the soluble MAC (PDB 7nyc). The complex C5b-8 is shown with C7 as a surface and C5b, C6, C8 as cartoon. (For interpretation of the references to colour in this figure legend, the reader is referred to the web version of this article.)
Fig. 6
Fig. 6
Interactions between FHR1 and C9 predicted by AlphaFold Multimer A. FHR11–2 and FHR15 interact with C9 MACPF domain according to AFM model. FHR1 is shown in green and the colours of C9 domains match the colour of their legends. B. Binding interfaces of the model presented in A with electrostatic potential surface (electropositive and electronegative residues in blue and red, respectively). Some of the residues forming the binding region are labelled in FHR1. C. Interactions of vitronectin and clusterin with C9 predicted by AFM and superimposition of all models including FHR1 complex, suggest similar binding sites (only one of the top-ranked models is presented) D. FHR1 binding to C9 avoids C9 polymerization. Superimposition of C9 and FHR1 model with experimental structure of MAC (PDB 7nyc) is shown with a zoom in of interfaces between C8α -C9 and C9-C9, contrasted with binding sites of FHR1 (green) to C9 (blue and grey) in pale yellow. E. Interactions between membrane-anchored MAC regulator CD59 (shown in cyan) and C9 (dark blue) predicted by AFM are located in a buried region of soluble C9. The binding site is different from the predicted binding site for FHR1 (shown in green) F. Superimposition of AF2 model and experimental structure of MAC (PDB 7nyc) shows binding sites of CD59 in a hydrophobic pocket where unfurling of transmembrane β-hairpins occurs (binding sites in orange, soluble C9 and MAC C9 in purple and blue respectively). (For interpretation of the references to colour in this figure legend, the reader is referred to the web version of this article.)

Similar articles

Cited by

References

    1. Zipfel P.F., Skerka C. Complement regulators and inhibitory proteins. Nat Rev Immunol. 2009;9:729–740. - PubMed
    1. Chen Z.A., Pellarin R., Fischer L., Sali A., Nilges M., Barlow P.N., et al. Structure of complement C3(H2O) revealed by quantitative cross-linking/mass spectrometry and modeling. Mol Cell Proteom. 2016;15:2730–2743. - PMC - PubMed
    1. Ricklin D., Reis E.S., Mastellos D.C., Gros P., Lambris J.D. Complement component C3 – The “Swiss Army Knife” of innate immunity and host defense. Immunol Rev. 2016;274:33–58. - PMC - PubMed
    1. Mannes M., Dopler A., Zolk O., Lang S.J., Halbgebauer R., Höchsmann B., et al. Complement inhibition at the level of C3 or C5: Mechanistic reasons for ongoing terminal pathway activity. Blood. 2021;137:443–455. - PubMed
    1. Bayly-Jones C., Bubeck D., Dunstone M.A. The mystery behind membrane insertion: a review of the complement membrane attack complex. Philos Trans R Soc B Biol Sci. 2017:372. - PMC - PubMed