

Emergent dynamics of underlying regulatory network links EMT and androgen receptor-dependent resistance in prostate cancer
- PMID: 36851919
- PMCID: PMC9957767
- DOI: 10.1016/j.csbj.2023.01.031
Emergent dynamics of underlying regulatory network links EMT and androgen receptor-dependent resistance in prostate cancer
Abstract
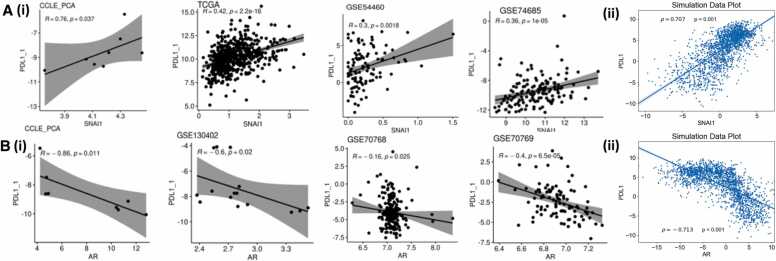
Advanced prostate cancer patients initially respond to hormone therapy, be it in the form of androgen deprivation therapy or second-generation hormone therapies, such as abiraterone acetate or enzalutamide. However, most men with prostate cancer eventually develop hormone therapy resistance. This resistance can arise through multiple mechanisms, such as through genetic mutations, epigenetic mechanisms, or through non-genetic pathways, such as lineage plasticity along epithelial-mesenchymal or neuroendocrine-like axes. These mechanisms of hormone therapy resistance often co-exist within a single patient's tumor and can overlap within a single cell. There exists a growing need to better understand how phenotypic heterogeneity and plasticity results from emergent dynamics of the regulatory networks governing androgen independence. Here, we investigated the dynamics of a regulatory network connecting the drivers of androgen receptor (AR) splice variant-mediated androgen independence and those of epithelial-mesenchymal transition. Model simulations for this network revealed four possible phenotypes: epithelial-sensitive (ES), epithelial-resistant (ER), mesenchymal-resistant (MR) and mesenchymal-sensitive (MS), with the latter phenotype occurring rarely. We observed that well-coordinated "teams" of regulators working antagonistically within the network enable these phenotypes. These model predictions are supported by multiple transcriptomic datasets both at single-cell and bulk levels, including in vitro EMT induction models and clinical samples. Further, our simulations reveal spontaneous stochastic switching between the ES and MR states. Addition of the immune checkpoint molecule, PD-L1, to the network was able to capture the interactions between AR, PD-L1, and the mesenchymal marker SNAIL, which was also confirmed through quantitative experiments. This systems-level understanding of the driver of androgen independence and EMT could aid in understanding non-genetic transitions and progression of such cancers and help in identifying novel therapeutic strategies or targets.
Keywords: Androgen independence; Epithelial-Mesenchymal Transition; Multistability; Non-genetic heterogeneity; PD-L1; Phenotypic plasticity; Snail.
© 2023 The Authors.
Conflict of interest statement
The authors declare no conflict of interest.
Figures


Similar articles
-
Short-Term Memory Impairment.2024 Jun 8. In: StatPearls [Internet]. Treasure Island (FL): StatPearls Publishing; 2025 Jan–. 2024 Jun 8. In: StatPearls [Internet]. Treasure Island (FL): StatPearls Publishing; 2025 Jan–. PMID: 31424720 Free Books & Documents.
-
Systemic treatments for metastatic cutaneous melanoma.Cochrane Database Syst Rev. 2018 Feb 6;2(2):CD011123. doi: 10.1002/14651858.CD011123.pub2. Cochrane Database Syst Rev. 2018. PMID: 29405038 Free PMC article.
-
Cost-effectiveness of using prognostic information to select women with breast cancer for adjuvant systemic therapy.Health Technol Assess. 2006 Sep;10(34):iii-iv, ix-xi, 1-204. doi: 10.3310/hta10340. Health Technol Assess. 2006. PMID: 16959170
-
The Black Book of Psychotropic Dosing and Monitoring.Psychopharmacol Bull. 2024 Jul 8;54(3):8-59. Psychopharmacol Bull. 2024. PMID: 38993656 Free PMC article. Review.
-
Signs and symptoms to determine if a patient presenting in primary care or hospital outpatient settings has COVID-19.Cochrane Database Syst Rev. 2022 May 20;5(5):CD013665. doi: 10.1002/14651858.CD013665.pub3. Cochrane Database Syst Rev. 2022. PMID: 35593186 Free PMC article.
Cited by
-
A synthetic lethal screen for Snail-induced enzalutamide resistance identifies JAK/STAT signaling as a therapeutic vulnerability in prostate cancer.Front Mol Biosci. 2023 May 9;10:1104505. doi: 10.3389/fmolb.2023.1104505. eCollection 2023. Front Mol Biosci. 2023. PMID: 37228586 Free PMC article.
-
Increased prevalence of hybrid epithelial/mesenchymal state and enhanced phenotypic heterogeneity in basal breast cancer.iScience. 2024 May 27;27(7):110116. doi: 10.1016/j.isci.2024.110116. eCollection 2024 Jul 19. iScience. 2024. PMID: 38974967 Free PMC article.
-
Establishment and characterization of the gemcitabine-resistant human gallbladder cancer cell line NOZ GemR.Ann Med Surg (Lond). 2024 Jan 4;86(3):1396-1400. doi: 10.1097/MS9.0000000000001665. eCollection 2024 Mar. Ann Med Surg (Lond). 2024. PMID: 38463071 Free PMC article.
-
Multi-modal transcriptomic analysis unravels enrichment of hybrid epithelial/mesenchymal state and enhanced phenotypic heterogeneity in basal breast cancer.bioRxiv [Preprint]. 2023 Oct 2:2023.09.30.558960. doi: 10.1101/2023.09.30.558960. bioRxiv. 2023. PMID: 37873432 Free PMC article. Preprint.
-
Advance in prostate cancer biomarker discovery: bridging detection, prognosis and therapeutics.Discov Oncol. 2025 May 30;16(1):954. doi: 10.1007/s12672-025-02763-1. Discov Oncol. 2025. PMID: 40445561 Free PMC article. Review.
References
-
- Li Y., Yang R., Henzler C.M., Ho Y., Passow C., Auch B., Carreira S., Rodrigues D.N., Bertan C., Hwang T.H., et al. Diverse AR gene rearrangements mediate resistance to androgen receptor inhibitors in metastatic prostate cancer. Clin Cancer Res. 2020;26:1965–1976. doi: 10.1158/1078-0432.CCR-19-3023. - DOI - PMC - PubMed
LinkOut - more resources
Full Text Sources
Research Materials