

Effect of chlorantraniliprole on soil bacterial and fungal diversity and community structure
- PMID: 36852024
- PMCID: PMC9957708
- DOI: 10.1016/j.heliyon.2023.e13668
Effect of chlorantraniliprole on soil bacterial and fungal diversity and community structure
Abstract
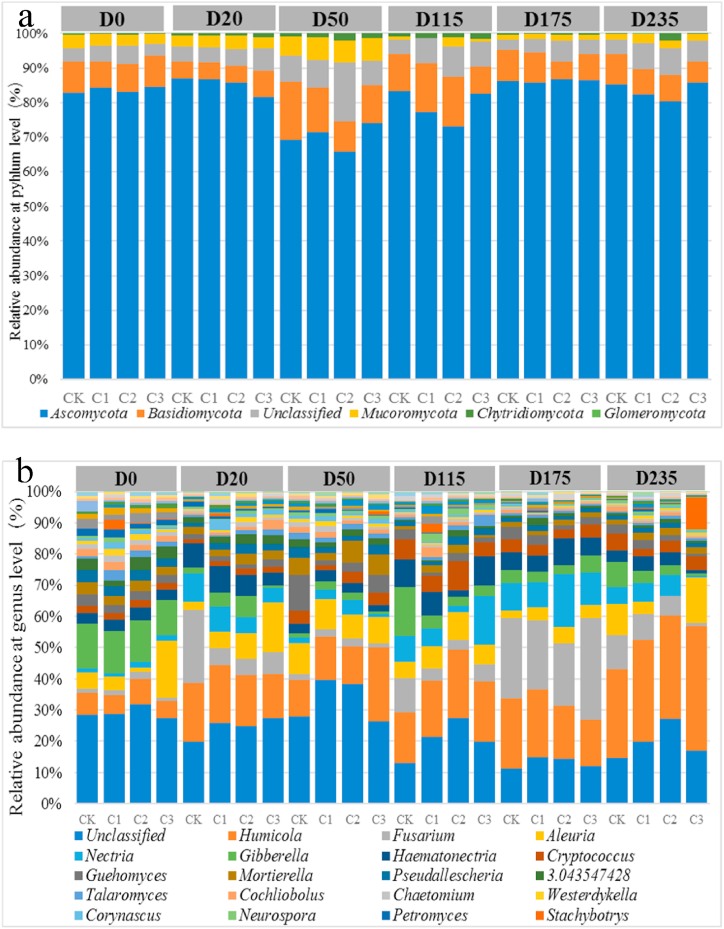
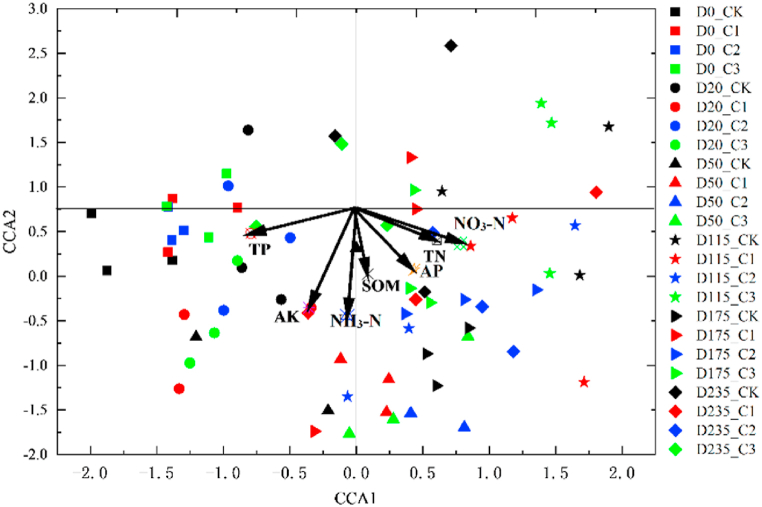
Chlorantraniliprole (CAP) is an insecticide with low toxicity and high efficiency, which is widely used in agriculture in China. However, its potential ecological risks remain unknown. In this study, we investigated the impact of different CAP concentrations on bacterial and fungal communities in soil based on high-throughput sequencing. The results showed that CAP application had no significant effect on soil bacterial and fungal diversity, but altered the bacterial and fungal community structure. In particular, the soil bacterial and fungal community structure in the low CAP concentration treatment group exhibited large variability. Compared with 0 day, the phylum level of bacteria changed at 115 days, and fungi changed at 175 days, indicating that soil microbial community might have significant correlation with CAP degradation in soil. Correlation analysis between soil properties and microbial communities showed that TN, TP, and NO3-N were three key factors that significantly influenced microbial community structure. These results provide basic data for studying the effects of pesticides on ecosystem and potential remediation strategies of polluted soil.
Keywords: Chlorantraniliprole (CAP); High-throughput sequencing; Microbial communities; Soil.
© 2023 Published by Elsevier Ltd.
Conflict of interest statement
The authors declare no conflict of interest.
Figures


Similar articles
-
Rational dose of insecticide chlorantraniliprole displays a transient impact on the microbial metabolic functions and bacterial community in a silty-loam paddy soil.Sci Total Environ. 2018 Mar;616-617:236-244. doi: 10.1016/j.scitotenv.2017.11.012. Epub 2017 Nov 5. Sci Total Environ. 2018. PMID: 29117582
-
Plant diversity and soil properties regulate the microbial community of monsoon evergreen broad-leaved forest under different intensities of woodland use.Sci Total Environ. 2022 May 15;821:153565. doi: 10.1016/j.scitotenv.2022.153565. Epub 2022 Jan 29. Sci Total Environ. 2022. PMID: 35101489
-
Miscanthus cultivation shapes rhizosphere microbial community structure and function as assessed by Illumina MiSeq sequencing combined with PICRUSt and FUNGUIld analyses.Arch Microbiol. 2020 Jul;202(5):1157-1171. doi: 10.1007/s00203-020-01830-1. Epub 2020 Feb 17. Arch Microbiol. 2020. PMID: 32067064
-
[Potential of Arbuscular Mycorrhizal Fungi, Biochar, and Combined Amendment on Sandy Soil Improvement Driven by Microbial Community].Huan Jing Ke Xue. 2021 Apr 8;42(4):2066-2079. doi: 10.13227/j.hjkx.202008154. Huan Jing Ke Xue. 2021. PMID: 33742842 Chinese.
-
Variations of root-associated bacterial cooccurrence relationships in paddy soils under chlorantraniliprole (CAP) stress.Sci Total Environ. 2021 Jul 20;779:146247. doi: 10.1016/j.scitotenv.2021.146247. Epub 2021 Mar 5. Sci Total Environ. 2021. PMID: 33743468 Review.
Cited by
-
Comparative study of antioxidant and antimicrobial activity of berberine-derived Schiff bases, nitro-berberine and amino-berberine.Heliyon. 2023 Nov 25;9(12):e22783. doi: 10.1016/j.heliyon.2023.e22783. eCollection 2023 Dec. Heliyon. 2023. PMID: 38058428 Free PMC article.
-
The Marine-Origin Exopolysaccharide-Producing Bacteria Micrococcus Antarcticus HZ Inhibits Pb Uptake in Pakchoi (Brassica chinensis L.) and Affects Rhizosphere Microbial Communities.Microorganisms. 2024 Oct 1;12(10):2002. doi: 10.3390/microorganisms12102002. Microorganisms. 2024. PMID: 39458311 Free PMC article.
-
The adsorption mechanism and optimal dosage of walnut shell biochar for chloramphenicol.Heliyon. 2024 Oct 10;10(20):e39123. doi: 10.1016/j.heliyon.2024.e39123. eCollection 2024 Oct 30. Heliyon. 2024. PMID: 39640795 Free PMC article.
References
-
- Fenner K., Canonica S., Wackett L.P., et al. Evaluating pesticide degradation in the environment: blind spots and emerging opportunities. Science. 2013;341(6147):752–758. - PubMed
-
- Kuhad R.C., Johri A.K., Singh A., et al. vol. 1. U.S.A.; 2004. Applied Bioremediation and Phytoremediation. Springer Berlin Heidelberg; pp. 35–54.
-
- Fierer N. Embracing the unknown: disentangling the complexities of the soil microbiome. Nat. Rev. Microbiol. 2017;15(10):579–590. - PubMed
-
- Cederlund H., et al. Soil carbon quality and nitrogen fertilization structure bacterial communities with predictable responses of major bacterial phyla. Appl. Soil Ecol. 2014;84:62–68.
-
- Sul W.J., Asuming-Brempong S., Wang Q., et al. Tropical agricultural land management influences on soil microbial communities through its effect on soil organic carbon. Soil Biol. Biochem. 2013;65:33–38.
LinkOut - more resources
Full Text Sources
Miscellaneous
