. 2022 Sep;2(3):295-316.
doi: 10.3390/oxygen2030021. Epub 2022 Aug 4.

Molecular oxygen as a probe molecule in EPR spin-labeling studies of membrane structure and dynamics

Affiliations

Molecular oxygen as a probe molecule in EPR spin-labeling studies of membrane structure and dynamics

Witold K Subczynski et al. Oxygen (Basel). 2022 Sep.

Abstract

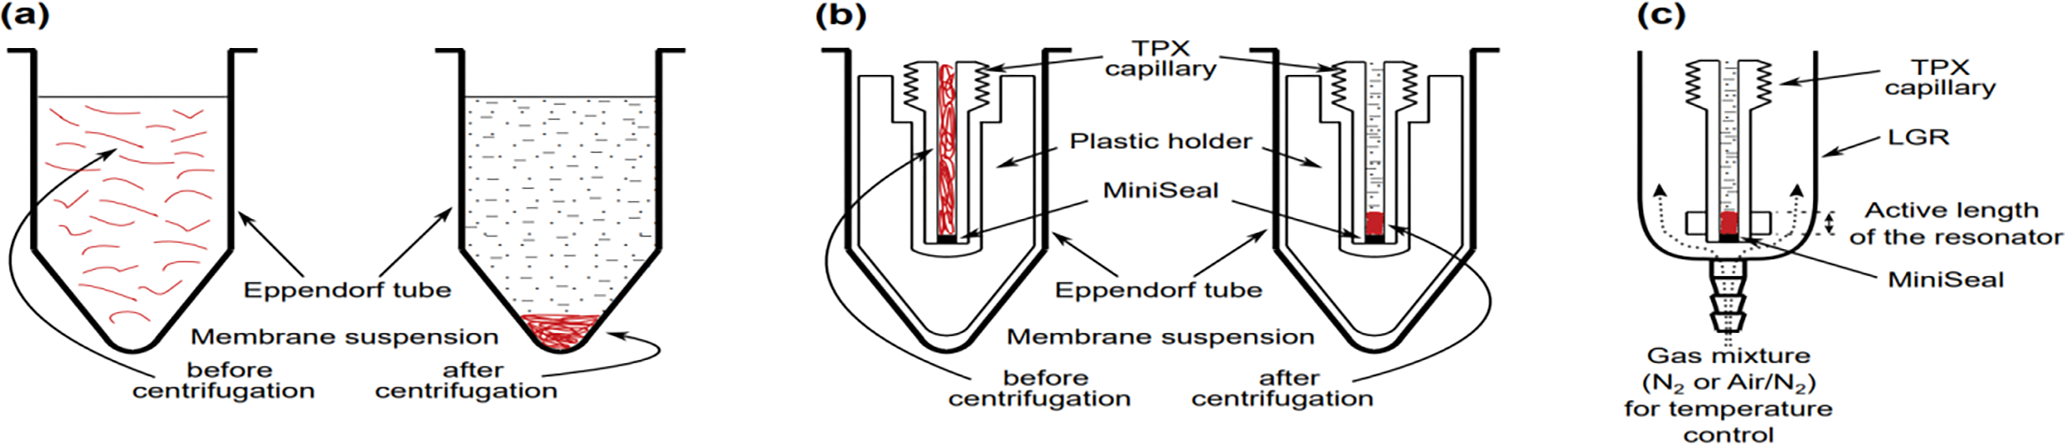
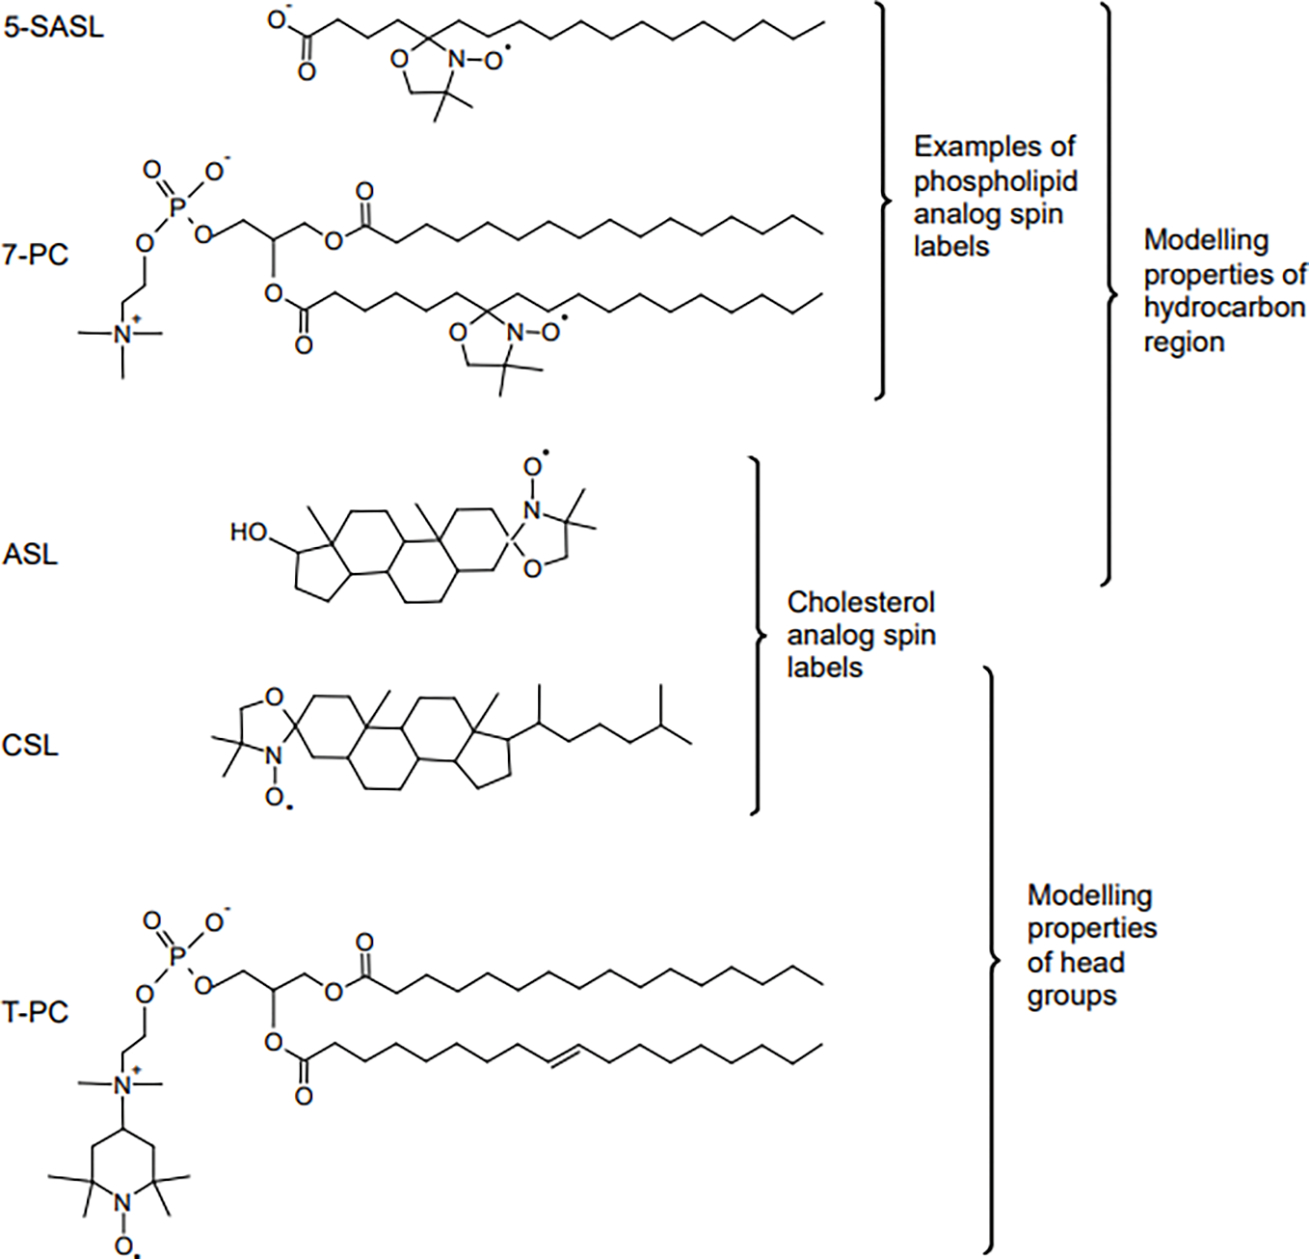
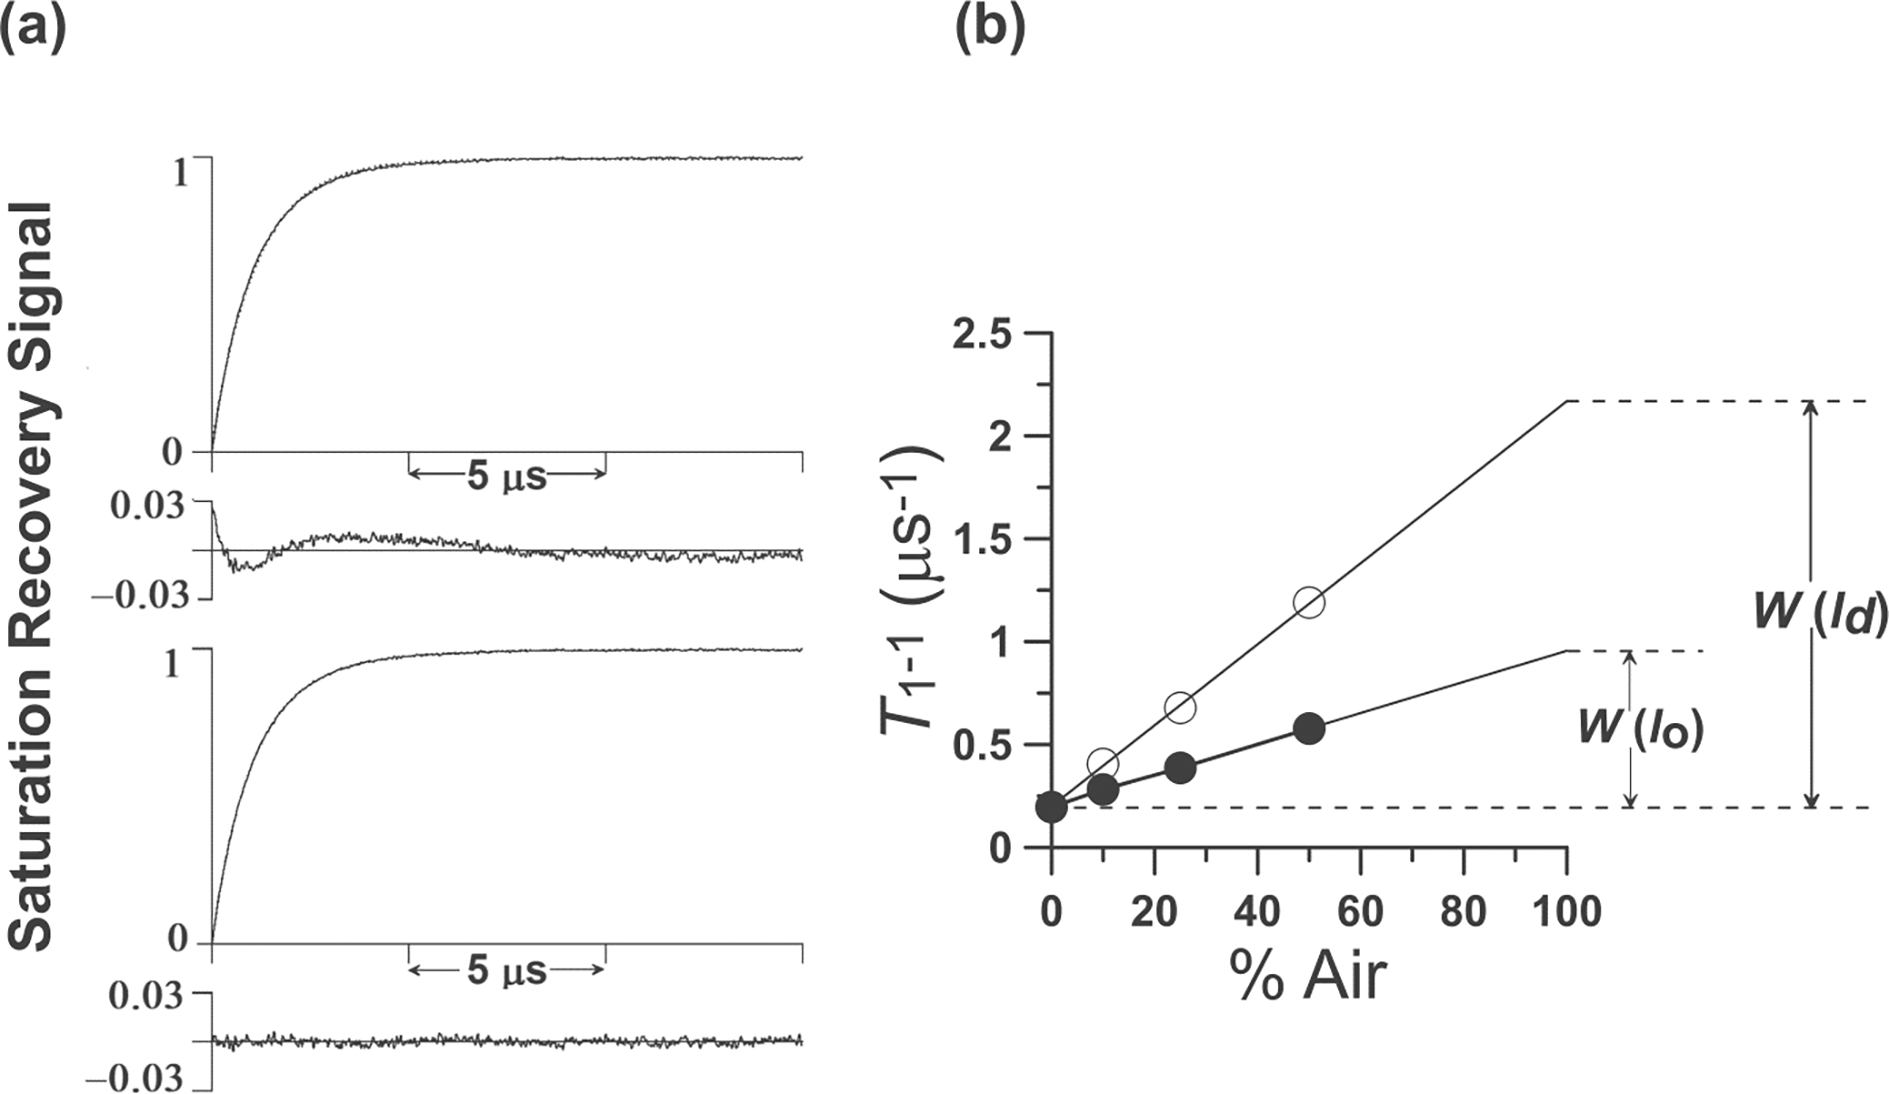
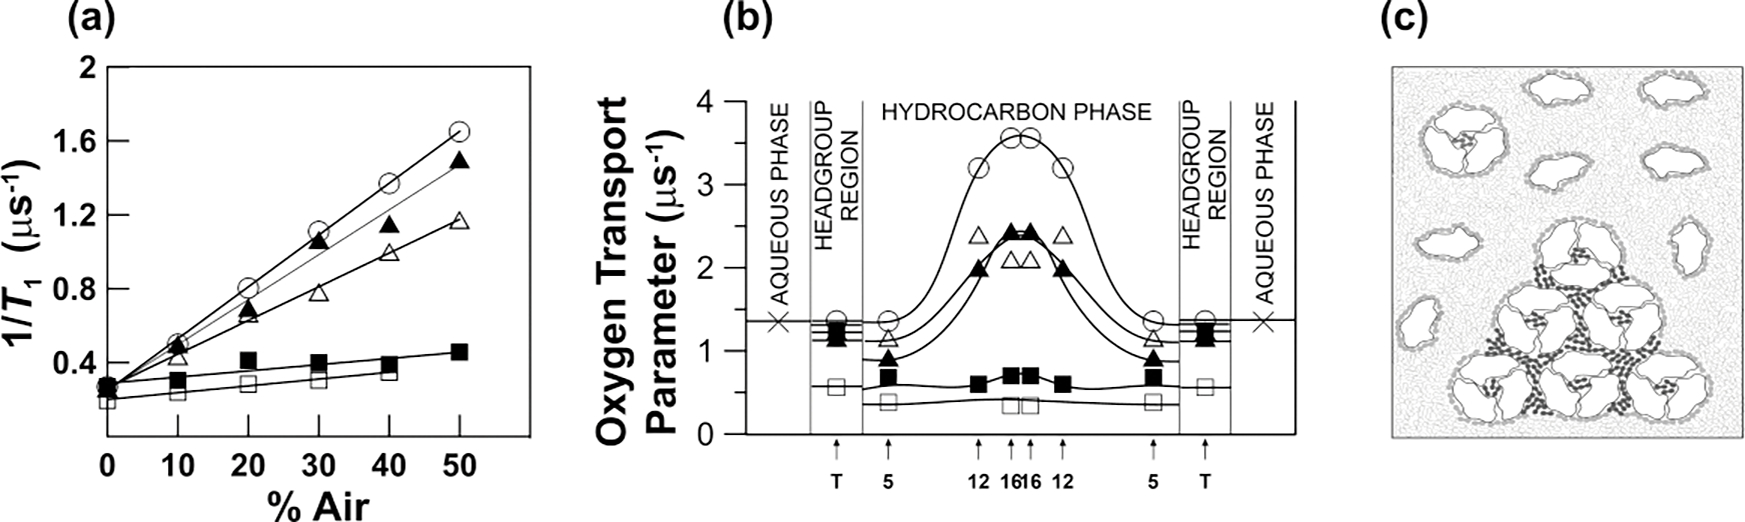
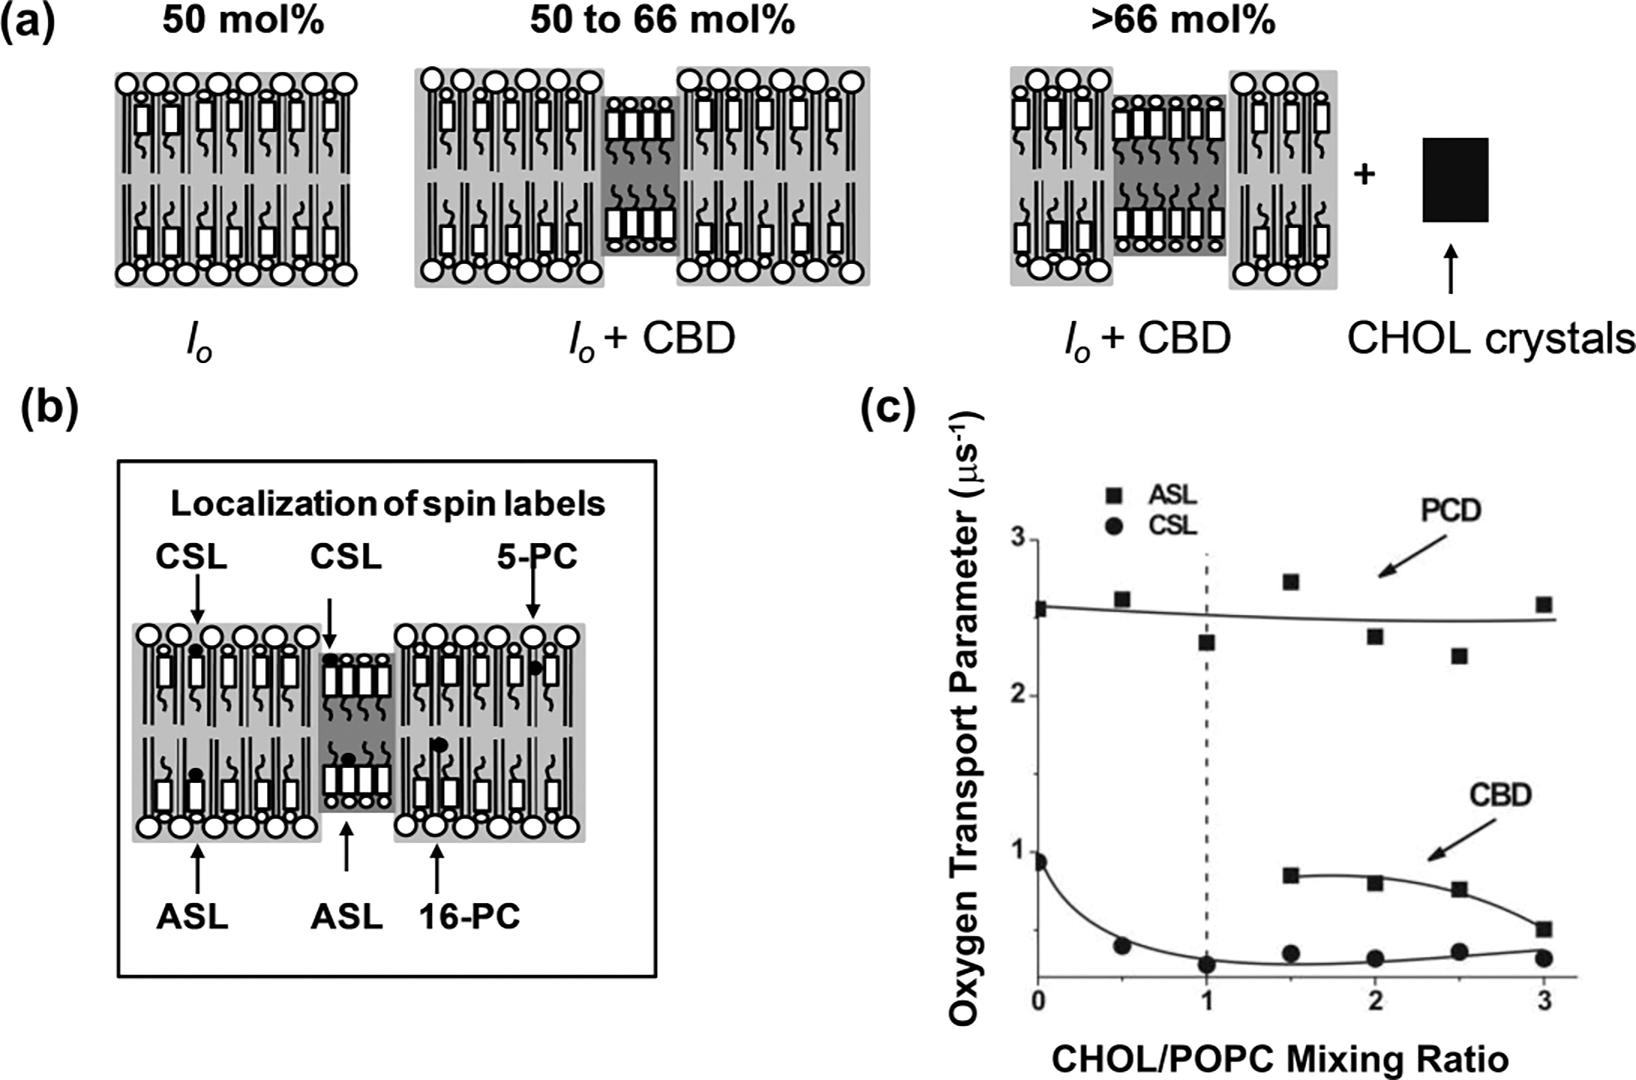
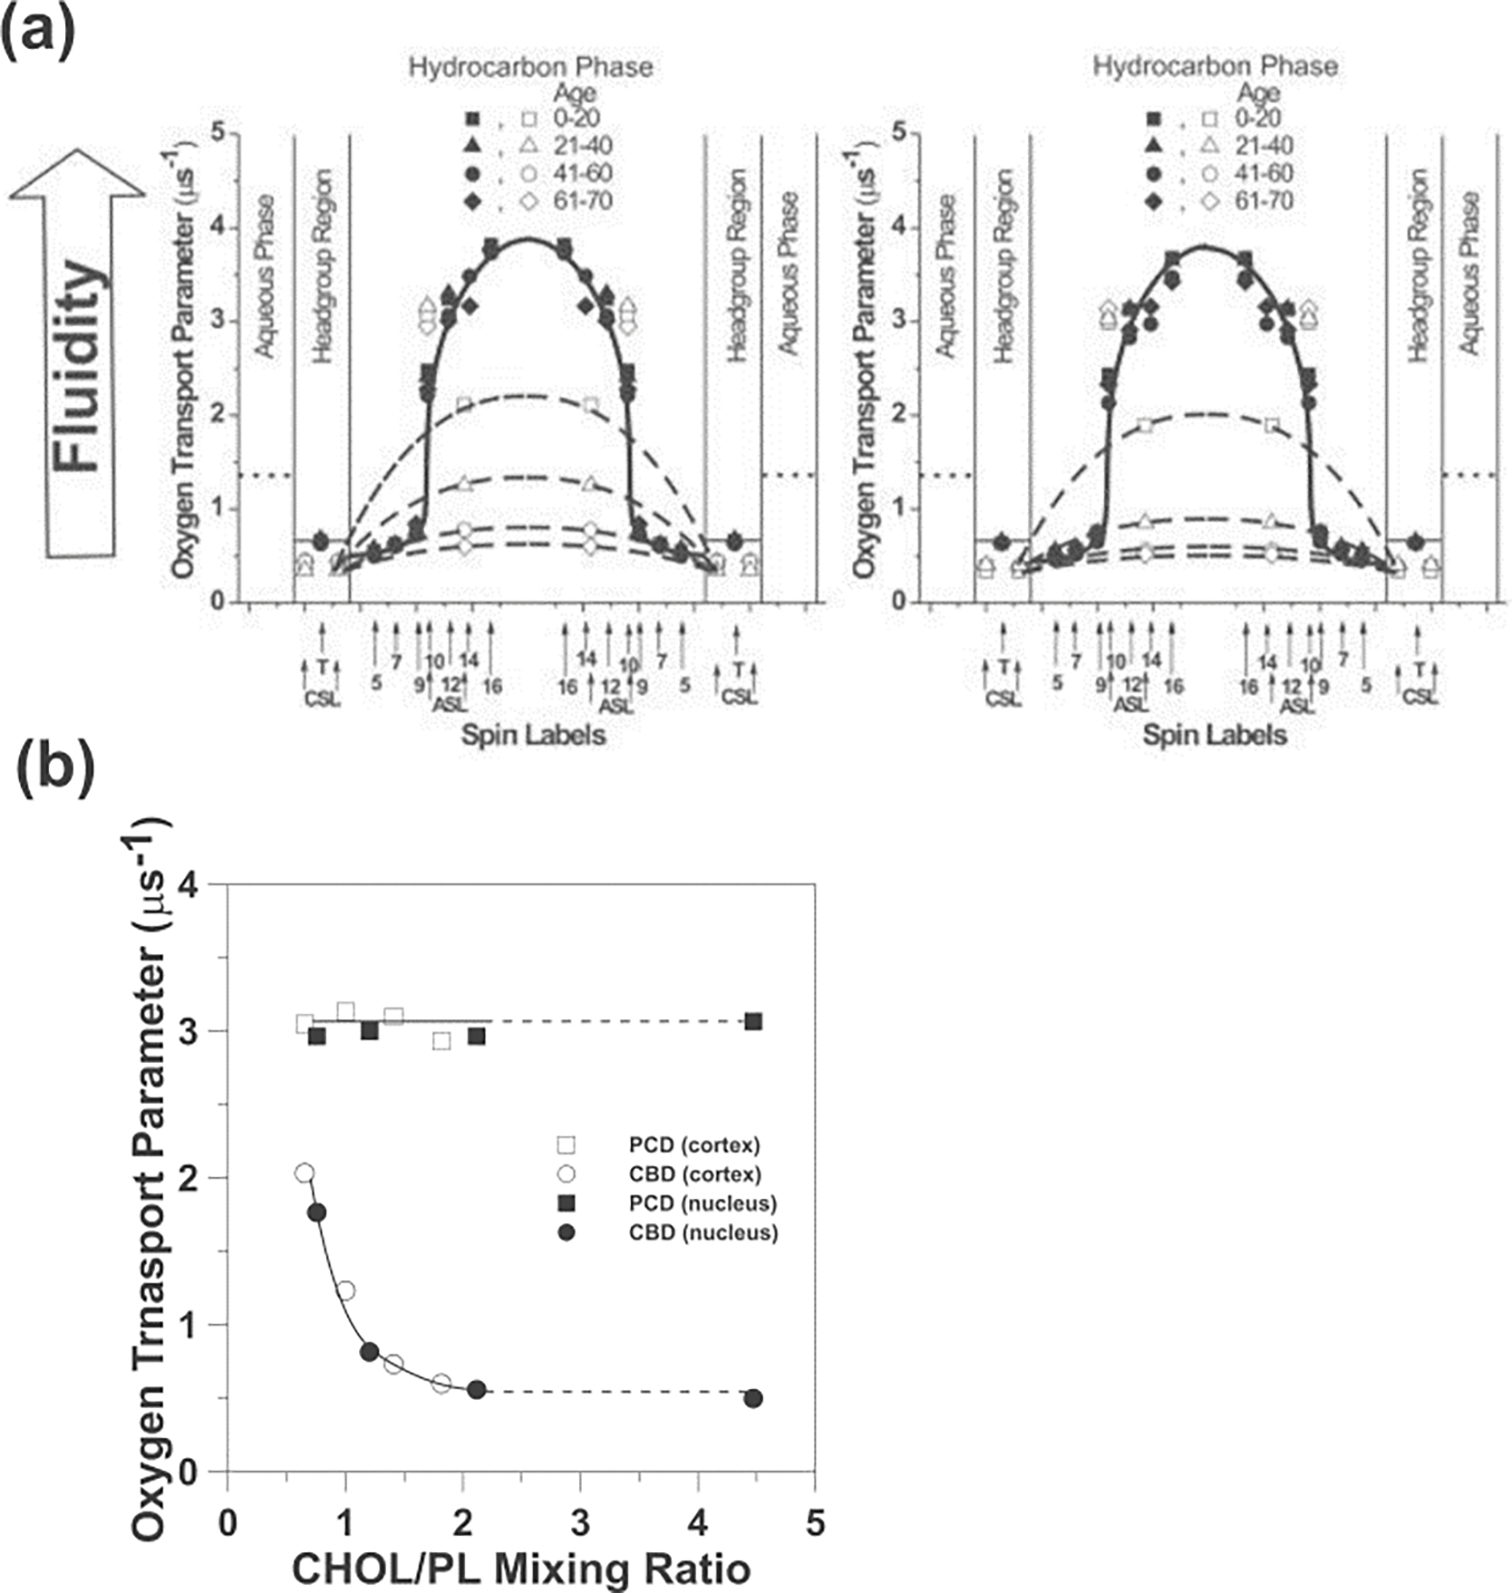
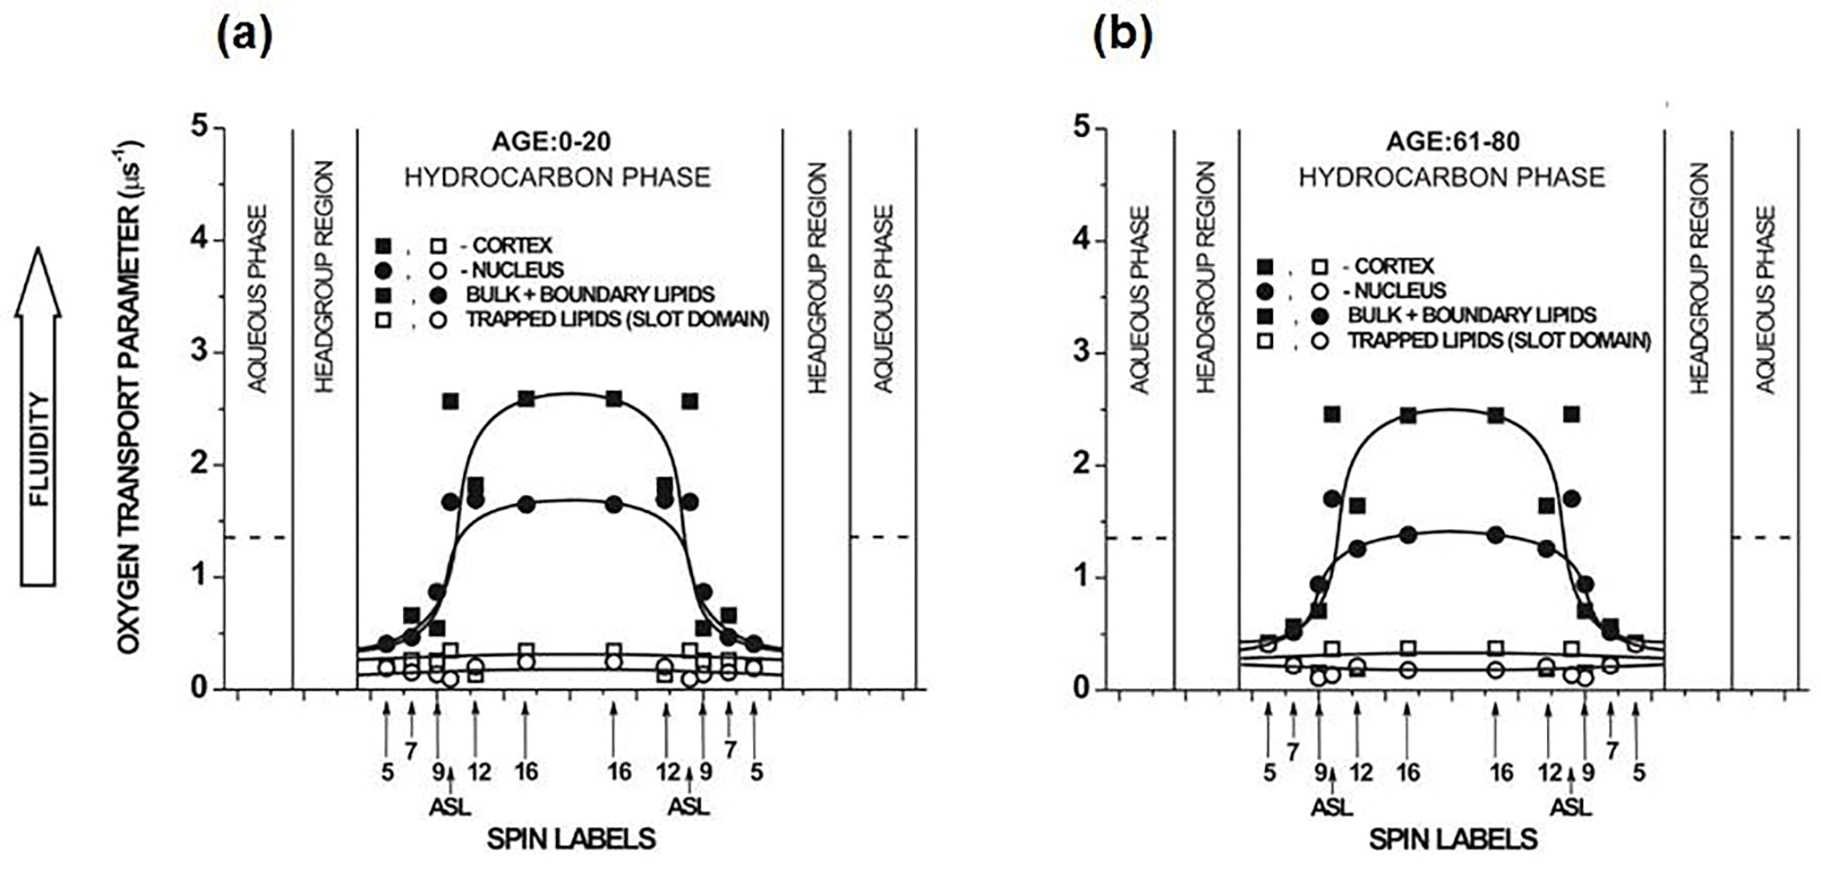
Molecular oxygen (O2) is the perfect probe molecule for membrane studies carried out using the saturation recovery EPR technique. O2 is a small, paramagnetic, hydrophobic enough molecule that easily partitions into a membrane's different phases and domains. In membrane studies, the saturation recovery EPR method requires two paramagnetic probes: a lipid-analog nitroxide spin label and an oxygen molecule. The experimentally derived parameters of this method are the spin-lattice relaxation times (T 1s) of spin labels and rates of bimolecular collisions between O2 and the nitroxide fragment. Thanks to the long T 1 of lipid spin labels (from 1 to 10 μs), the approach is very sensitive to changes of the local (around the nitroxide fragment) O2 diffusion-concentration product. Small variations in the lipid packing affect O2 solubility and O2 diffusion, which can be detected by the shortening of T 1 of spin labels. Using O2 as a probe molecule and a different lipid spin label inserted into specific phases of the membrane and membrane domains allows data about the lateral arrangement of lipid membranes to be obtained. Moreover, using a lipid spin label with the nitroxide fragment attached to its head group or a hydrocarbon chain at different positions also enables data about molecular dynamics and structure at different membrane depths to be obtained. Thus, the method can be used to investigate not only the lateral organization of the membrane (i.e., the presence of membrane domains and phases), but also the depth-dependent membrane structure and dynamics, and, hence, the membrane properties in three dimensions.

Keywords: EPR; Molecular oxygen; cholesterol; lipid bilayer membranes; lipid spin labels; membrane domains; membrane fluidity.


Conflict of interest statement

Conflicts of Interest: The authors declare no conflict of interest.

Figures

Figure 1.
Figure 1.
Schematic drawing showing the handling of samples with a small amount of a biological material for EPR measurements. (a) The first step: concentrating of the diluted sample by centrifugation in Eppendorf tubes to the volume of a TPX capillary. (b) The second step: further of concentrating the sample to match the sample length in the TPX capillary with the active length of the resonator. (c) The third step: positioning the TPX capillary inside the LGR with the sample located exactly in the active volume of the resonator. In the resonator, the sample can be equilibrated with the appropriate air/nitrogen mixture.
Figure 2.
Figure 2.
Chemical structures of selected lipid spin labels used for membrane studies. The phospholipid analogs 7-doxylstearic acid spin label (5-SASL) and 1-palmitoyl-2-(7-doxylstearoyl)phosphatidylcholine (7-PC) models properties of the membrane hydrocarbon region, cholesterol analogues cholestane spin label (CSL) and androstane spin label (ASL) model the behavior of Chol molecules in the lipid bilayer, and the phospholipid analog tempocholine-1-palmitoyl-2-oleoylphosphatidic acid ester (T-PC) models properties of the head groups region.
Figure 3.
Figure 3.
(a) Representative SR signal from 5-PC in the DMPC bilayer containing 20 mol% Chol obtained at 30°C for the sample equilibrated with 50% air. In the deoxygenated sample, a single exponential signal is observed with a time constant of 5.10 μs (data not shown). In the presence of oxygen, fitting the search to a single exponential mode is unsatisfactory as shown by the residual (upper panel). The fit, using the double-exponential mode (time constants of 1.73 and 0.84 μs), is excellent (lower panel). The double-exponential fit is consistent with two immiscible domains (phases) with different OTPs that are present at these conditions. (We assigned them to the ld phase and lo phases.) (b) Plot of T11 for 5-PC in the lo and ld phases in a DMPC membrane containing 20 mol% Chol as a function of air fraction in the equilibrating gas mixture. Experimental points show a linear dependence up to 50% air, and extrapolation to 100% air is performed as a way of calculating OTPs in the lo and ld phases.
Figure 4.
Figure 4.
Steps used in the discrimination of membrane domains using the DOT method. (a) Spin lattice relaxation rates of 1-palmitoyl-2-(12-doxylstearoyl)phosphatidylcholine (12-PC) plotted as a percentile of air in the gas mixture equilibrating the membrane suspension at 30°C. Symbols are for the DMPC bilayer without BR (○), with BR/DMPC = 1/80 (Δ), with BR/DMPC = 1/40 (▲,■), and for purple membranes isolated from Halobacterium halobium (□). T11 values were extrapolated to 100% air and OTP was calculated for each domain. As indicated in Eq. 1, the SR signals obtained for the DMPC bilayer without BR, with BR/DMPC = 1/80, and for purple membranes were successfully fitted to single exponentials, giving single values of the OTP for all spin labels (using Eq. 1). SR signals obtained for the DMPC bilayer with BR/DMPC = 1/40 were successfully fitted only to double exponential functions, giving two values of the OTP for each spin label (using Eqs. 4 and 5). (b) Profiles of the OTP values obtained at 30°C from different PL spin labels across the DMPC bilayer without BR (○), with BR/DMPC = 1/80 (Δ), with BR/DMPC = 1/40 (▲,■), and across purple membranes (□). When BR is in the monomeric form, only one bulk-plus-boundary lipid domain is present (Δ). When BR is aggregated, two lipid domains coexist: bulk-plus-boundary domain (▲) and trapped lipid domain (■). Arrows indicate approximate locations of nitroxide moieties of n-PCs and n-SASLs used in these investigations. T indicates T-PC. The symbol × indicates OTP in the aqueous phase. (c) Schematic drawing of the lateral organization of bacteriorhodopsin and lipid molecules in the reconstituted membrane of BR and DMPC at a BR/lipid ratio of 1/40. Phospholipid molecules are indicated as an open and closed figure-eight-shaped phospholipid cross section. Phospholipids in the bulk domain are open, in the boundary are grey, and in the SLOT domain (trapped-lipid domain) are dark. Lipids in the SLOT domain are trapped between trimers and oligomers of trimers of the BR. The schematic shapes of molecules are drawn on the base of the electron microscopy studies [54]. Data for Fig. 4a and Fig. 4b are reproduced with permission from Ref. [55]. Copyright 2022, American Chemical Society.
Figure 5.
Figure 5.
Steps used in the discrimination of membrane phases using O2 as a probe molecule. (a) Schematic drawings of membrane phases formed above (~25°C) and below (~20°C) the main phase transition temperature of the pure DMPC bilayer at different Chol contents in the Chol/DMPC mixture. Three basic bilayer phases are recognized: the solid-ordered (so) phase, the liquid-disordered (ld) phase, and the liquid-ordered (lo) phase (indicated by in grey). At 20°C, the so and the lo phases coexist with a Chol/DMPC mixing ratio between ~5 and ~30 mol% Chol. At 25°C, the ld and the lo phases coexist with a Chol/DMPC mixing ratio between ~5 and ~30 mol% Chol. (b) Plots of the OTPs obtained with 5-PC and 14-PC as a function of the Chol mixing ratio in Chol/DMPC membranes allowed indicate Chol contents at which a single so (between 0 and ~5 mol%), a single ld (between 0 and ~5 mol%), and a single lo phase exists (between ~30 and ~50 mol%) and Chol contents at which so and lo phases as well as ld and lo phases coexist (between ~5 and ~30 mol%). Data are for 20°C and 25°C. Symbols are explained in the figures. (c) Profiles of OTP obtained at 20°C and 25°C across DMPC membranes without Chol, containing 15 mol% Chol, and containing 50 mol% Chol. Symbols used are (Δ) for the so phase, (○) for the ld phase, and (●,▲) for the lo phase. Arrows indicate approximate locations of nitroxide moieties of spin labels. T indicates T-PC. The symbol × indicates OTP in the aqueous phase. It does not change significantly because the temperature dependences of O2 diffusion and concentration in water are opposite. As shown, these profiles were obtained in single and coexisting domains and characterize their physical properties without physical separation of domains. Fig. 5b and Fig. 5c are reproduced from Ref. [29]. Copyright 2022, with permission from Elsevier.
Figure 6.
Figure 6.
Schematic drawings and experimental data are for Chol/POPC membranes formed using the film deposition method [73]. (a) Schematic drawings of different membrane structures that can form at Chol contents exceeding the Chol saturation limit in the POPC bilayer (50 mol%). At the Chol saturation limit, the POPC bilayer forms the lo phase. When the Chol content exceeds the 50 mol% limit, pure CBDs are formed (indicated in grey) and between 50 and 66 mol% Chol (Chol solubility threshold), CBDs are supported by the POPC bilayer saturated with Chol forming one structured lo phase of the POPC bilayer. The phase boundary at 66 mol% Chol separates the structured lo phase region from the two-phase region (structured lo phase of POPC and Chol crystals). (b) Localization of representative phospholipid spin labels (5-PC and 16-PC) as well as Chol-analog spin labels (ASL and CSL) in different membrane domains are indicated. (c) The values of the OTP accessibility parameter obtained with ASL and CSL in POPC-Chol bilayers are displayed as a function of the Chol/POPC mixing ratio. Note that above the Chol saturation limit (at a Chol/POPC mixing ratio of 1), ASL discriminates two domains with two different OTPs assigned to the POPC bilayer saturated with Chol and to CBD. However, CSL shows only a single value of the OTP at all investigated Chol contents. Fig. 6.c is reproduced from Ref. [73]. Copyright 2022, with permission from Elsevier.
Figure 7.
Figure 7.
(a) Transmembrane profiles of the OTP for LLMs obtained from human donors of different age groups. Profiles were obtained at 37°C for LLMs prepared using the rapid solvent exchange method [85]. Profiles obtained with the PL-analog spin labels (filled symbols) are not contaminated by the presence of CBDs. Data obtained with Chol-analog spin labels (open symbols) are also included, showing that the CBDs are present in LLMs from all age groups. Thus, the PL bilayers in LLMs are always saturated with Chol. Approximate locations of the nitroxide moieties of spin labels are indicated by arrows. The OTP value in water is shown by dotted lines. (b) The OTP obtained with ASL in cortical and nuclear LLM plotted as a function of Chol content in these membranes (expressed as the Chol/PL mixing ratio). At a Chol/PL mixing ratio of ~2, the Chol crystals are formed. Thus, the Chol/PL molar ratio in phospholipid bilayers and the amount of Chol forming CBDs should not increase further. Chol crystals were detected in nuclear LLMs from the age group comprising 61–70 years (with a Chol/PL ratio of 4.4). Fig. 7.a is reproduced from Ref. [85]. Copyright 2022, with permission from Taylor and Francis. Data for Fig. 7.b are adapted from Ref. [85] [93, 94].
Figure 8.
Figure 8.
Profiles of the OTP across domains in intact cortical (■, □) and nuclear (●, ○) fiber cell plasma membranes of eye lenses from 0–20- and 61–80-year-old human donor groups. All profiles were obtained at 37°C. Profiles obtained with n-SASLs are not contaminated by the presence of CBDs. Profiles are reported for bulk plus boundary lipids (■, ●) and for trapped lipids (□, ○). Values obtained with ASL in domains of cortical and nuclear membranes are also included. Approximate localizations of the nitroxide moieties of spin labels are indicated by arrows. The OTP value in water is shown by dotted lines. Fig. 8 is reproduced from Ref. [70]. Copyright 2022, with permission from Elsevier.

Similar articles

Cited by

References

    1. Gorter E and Grendel F, On biomolecular layers of lippods on the chromocytes of the blood. J Exp Med, 1925, 41, p. 439–443. - PMC - PubMed
    1. Danielli JF and Davson H, A contribution to the theory of permeability of thin films. J Cell Physiol, 1935, 5, p. 495–508.
    1. Singer SJ and Nicolson GL, The fluid mosaic model of the structure of cell membranes. Science, 1972, 175, p. 720–31. - PubMed
    1. Robertson RN, The lively membranes, Cambridge University Press, 1983.
    1. Kusumi A, et al., Hierarchical mesoscale domain organization of the plasma membrane. Trends Biochem Sci, 2011, 36, p. 604–15. - PubMed

LinkOut - more resources