

Effects of High Temperature on COVID-19 Deaths in U.S. Counties
- PMID: 36852181
- PMCID: PMC9958002
- DOI: 10.1029/2022GH000705
Effects of High Temperature on COVID-19 Deaths in U.S. Counties
Abstract
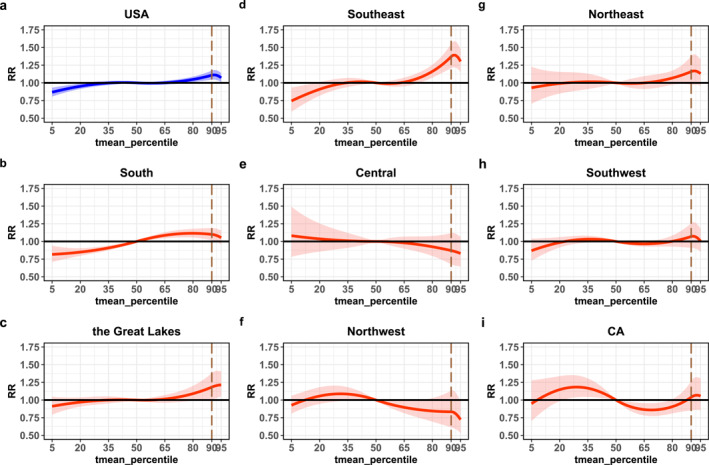
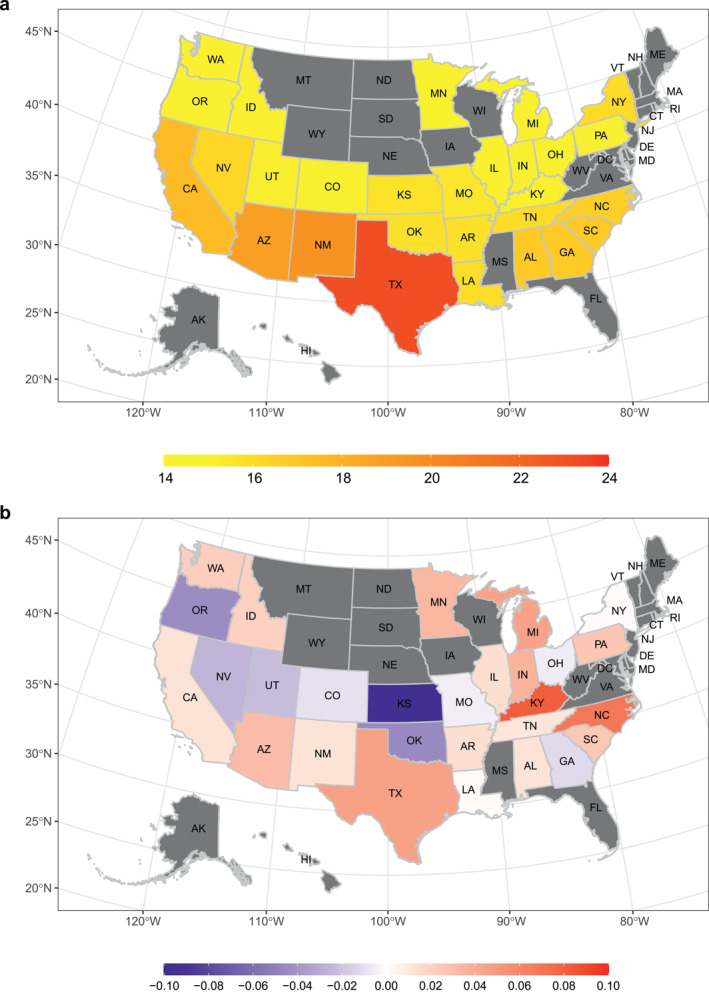
The United States of America (USA) was afflicted by extreme heat in the summer of 2021 and some states experienced a record-hot or top-10 hottest summer. Meanwhile, the United States was also one of the countries impacted most by the coronavirus disease 2019 (COVID-19) pandemic. Growing numbers of studies have revealed that meteorological factors such as temperature may influence the number of confirmed COVID-19 cases and deaths. However, the associations between temperature and COVID-19 severity differ in various study areas and periods, especially in periods of high temperatures. Here we choose 119 US counties with large counts of COVID-19 deaths during the summer of 2021 to examine the relationship between COVID-19 deaths and temperature by applying a two-stage epidemiological analytical approach. We also calculate the years of life lost (YLL) owing to COVID-19 and the corresponding values attributable to high temperature exposure. The daily mean temperature is approximately positively correlated with COVID-19 deaths nationwide, with a relative risk of 1.108 (95% confidence interval: 1.046, 1.173) in the 90th percentile of the mean temperature distribution compared with the median temperature. In addition, 0.02 YLL per COVID-19 death attributable to high temperature are estimated at the national level, and distinct spatial variability from -0.10 to 0.08 years is observed in different states. Our results provide new evidence on the relationship between high temperature and COVID-19 deaths, which might help us to understand the underlying modulation of the COVID-19 pandemic by meteorological variables and to develop epidemic policy response strategies.
Keywords: COVID‐19; SARS‐CoV‐2; The United States; high temperature; mortality.
© 2023 The Authors. GeoHealth published by Wiley Periodicals LLC on behalf of American Geophysical Union.
Conflict of interest statement
The authors declare no conflicts of interest relevant to this study.
Figures
Similar articles
-
Climate and COVID-19 pandemic: effect of heat and humidity on the incidence and mortality in world's top ten hottest and top ten coldest countries.Eur Rev Med Pharmacol Sci. 2020 Aug;24(15):8232-8238. doi: 10.26355/eurrev_202008_22513. Eur Rev Med Pharmacol Sci. 2020. PMID: 32767355
-
Relationship between meteorological factors and mortality in patients with coronavirus disease 2019: A cross-sectional study.Heliyon. 2023 Jul 22;9(8):e18565. doi: 10.1016/j.heliyon.2023.e18565. eCollection 2023 Aug. Heliyon. 2023. PMID: 37576230 Free PMC article.
-
Impact of summer heat on mortality and years of life lost: Application of a novel indicator of daily excess hourly heat.Environ Res. 2019 May;172:596-603. doi: 10.1016/j.envres.2019.01.056. Epub 2019 Feb 1. Environ Res. 2019. PMID: 30875513
-
COVID-19 and excess mortality in the United States: A county-level analysis.PLoS Med. 2021 May 20;18(5):e1003571. doi: 10.1371/journal.pmed.1003571. eCollection 2021 May. PLoS Med. 2021. PMID: 34014945 Free PMC article.
-
Mortality burden attributable to temperature variability in China.J Expo Sci Environ Epidemiol. 2023 Jan;33(1):118-124. doi: 10.1038/s41370-022-00424-x. Epub 2022 Mar 24. J Expo Sci Environ Epidemiol. 2023. PMID: 35332279 Free PMC article.
Cited by
-
COVID-19 Case and Mortality Surveillance using Daily SARS-CoV-2 in Wastewater Samples adjusting for Meteorological Conditions and Sample pH.medRxiv [Preprint]. 2023 Jul 12:2023.07.12.23292570. doi: 10.1101/2023.07.12.23292570. medRxiv. 2023. PMID: 37502918 Free PMC article. Preprint.
-
Water-blocking Asphyxia of N95 Medical Respirator During Hot Environment Work Tasks With Whole-body Enclosed Anti-bioaerosol Suit.Saf Health Work. 2023 Dec;14(4):457-466. doi: 10.1016/j.shaw.2023.10.009. Epub 2023 Oct 21. Saf Health Work. 2023. PMID: 38187212 Free PMC article.
References
-
- Banerjee, A. , Pasea, L. , Harris, S. , Gonzalez‐Izquierdo, A. , Torralbo, A. , Shallcross, L. , et al. (2020). Estimating excess 1‐year mortality associated with the COVID‐19 pandemic according to underlying conditions and age: A population‐based cohort study. Lancet, 395(10238), 1715–1725. 10.1016/S0140-6736(20)30854-0 - DOI - PMC - PubMed
LinkOut - more resources
Full Text Sources
Miscellaneous