. 2023 Feb 2;26(3):106108.
doi: 10.1016/j.isci.2023.106108. eCollection 2023 Mar 17.

Using biological constraints to improve prediction in precision oncology

Affiliations

Using biological constraints to improve prediction in precision oncology

Mohamed Omar et al. iScience. .

Abstract

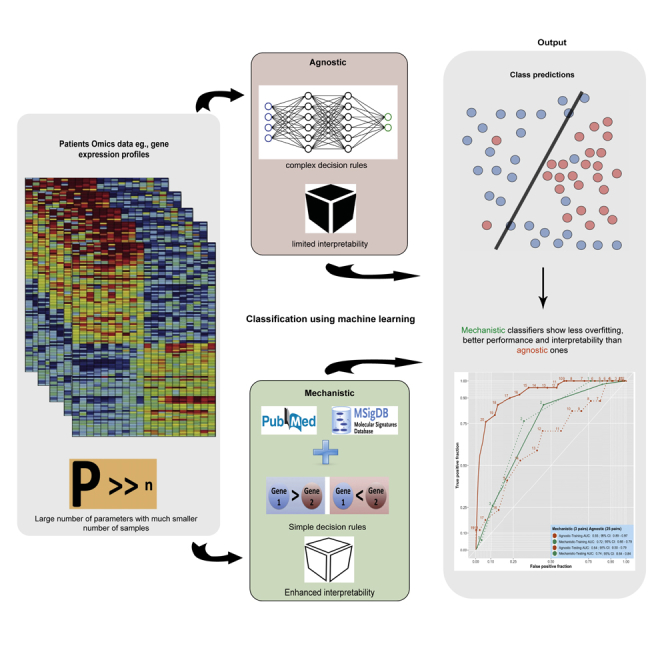
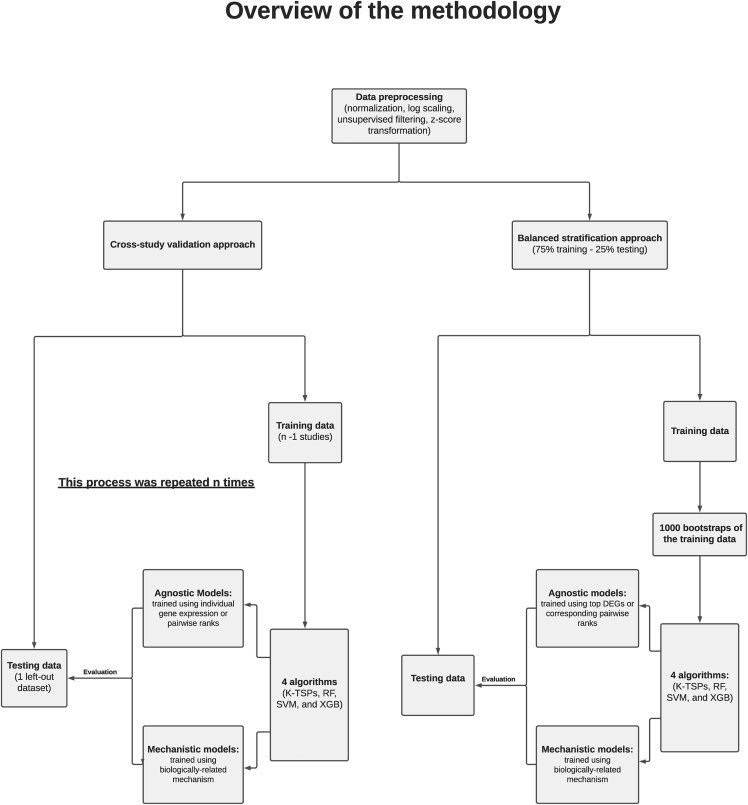
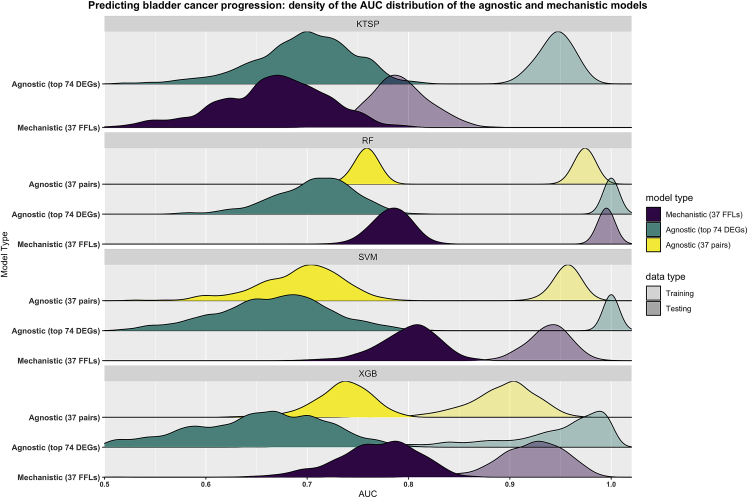
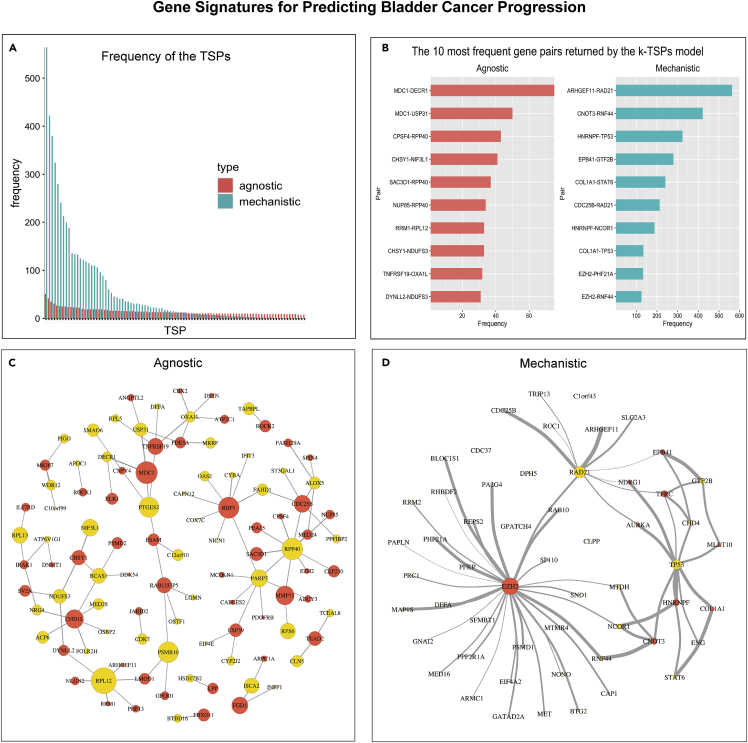
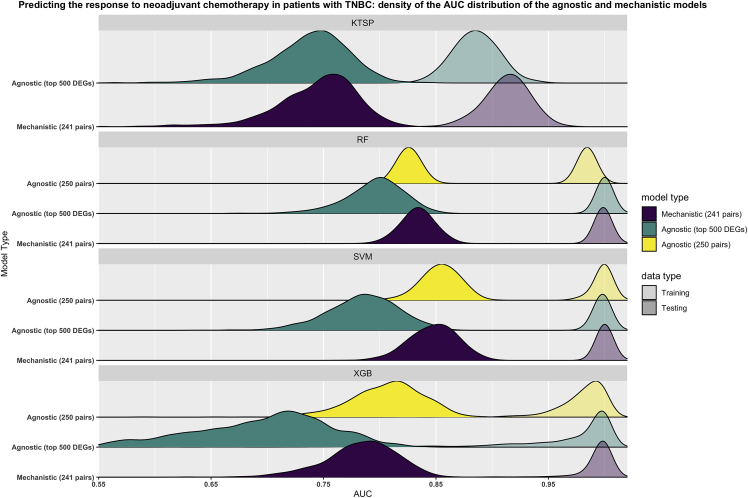
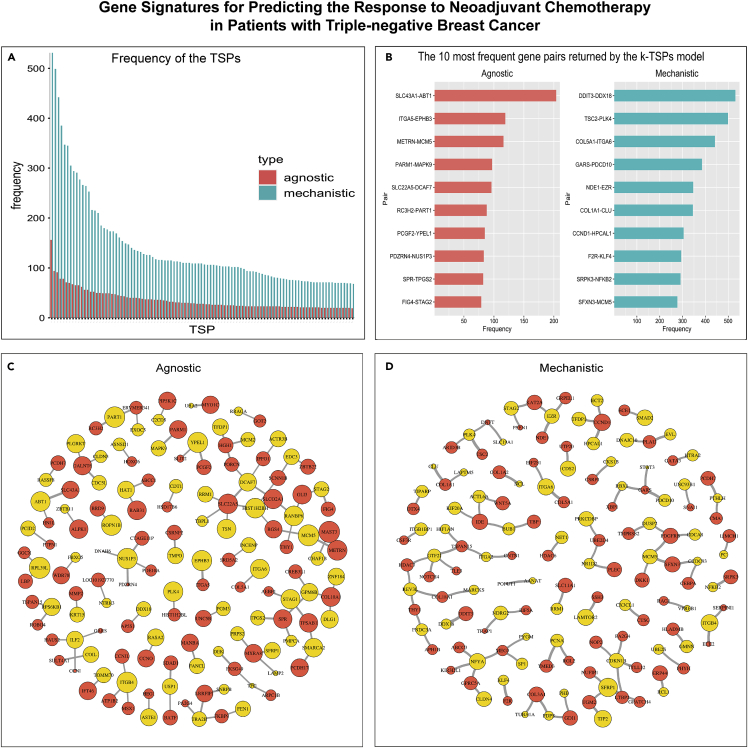
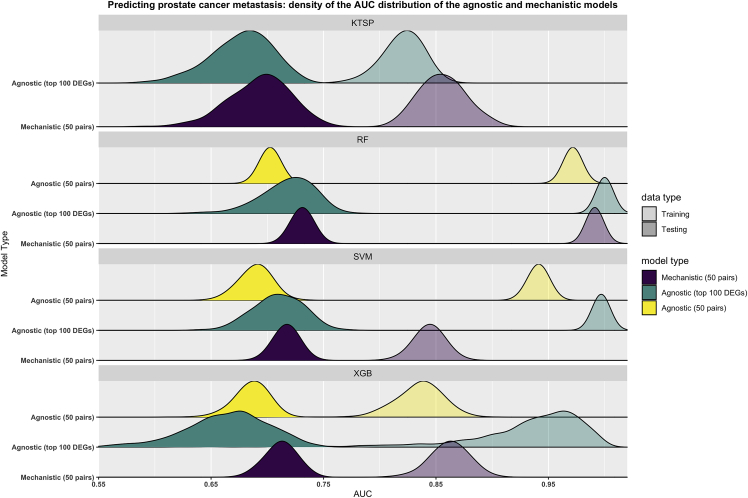
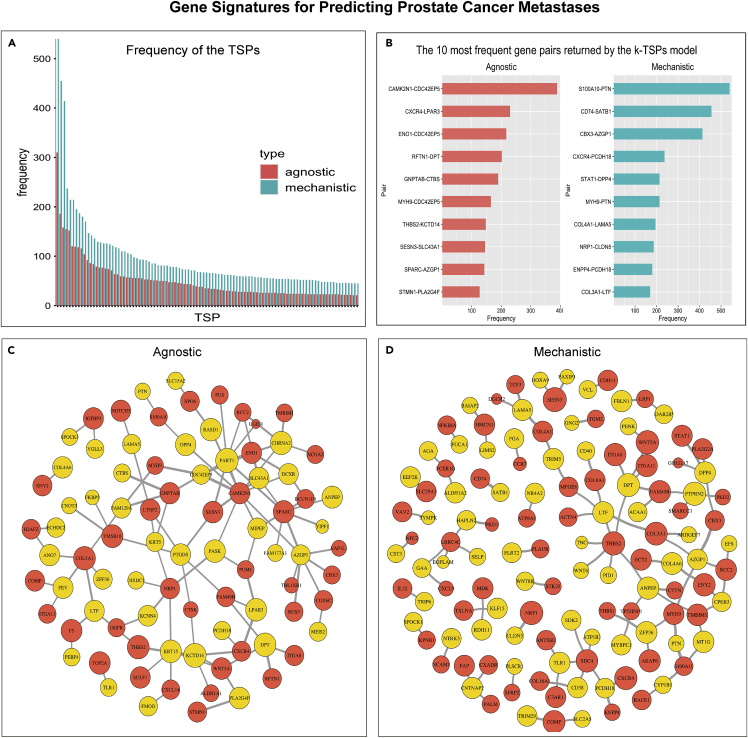
Many gene signatures have been developed by applying machine learning (ML) on omics profiles, however, their clinical utility is often hindered by limited interpretability and unstable performance. Here, we show the importance of embedding prior biological knowledge in the decision rules yielded by ML approaches to build robust classifiers. We tested this by applying different ML algorithms on gene expression data to predict three difficult cancer phenotypes: bladder cancer progression to muscle-invasive disease, response to neoadjuvant chemotherapy in triple-negative breast cancer, and prostate cancer metastatic progression. We developed two sets of classifiers: mechanistic, by restricting the training to features capturing specific biological mechanisms; and agnostic, in which the training did not use any a priori biological information. Mechanistic models had a similar or better testing performance than their agnostic counterparts, with enhanced interpretability. Our findings support the use of biological constraints to develop robust gene signatures with high translational potential.

Keywords: Cancer; Machine learning; Omics; Precision medicine.


Conflict of interest statement

The authors declare no competing interests.

Figures

None
Graphical abstract
Figure 1
Figure 1
Building mechanistic classifiers by embedding prior knowledge in the predictive decision rules Three different cancer cases were considered: predicting bladder cancer progression, predicting the response to neoadjuvant chemotherapy in patients with triple-negative breast cancer, and predicting prostate cancer metastatic progression. We adopted two different experimental designs: the balanced stratification (training bootstrap) and cross-study validation. In the balanced stratification design, all datasets were pooled together after normalization and preprocessing then split into training and testing sets. The training set was bootstrapped 1000 times and on each resample, we trained agnostic and mechanistic models and then evaluated their performance on the testing set. In the cross-study validation, the analysis included n iterations where n corresponds to the number of studies. In each iteration, we used all, but one study for training agnostic and mechanistic models and then evaluated their performance on the left-out study. k-TSPs: K-top scoring pairs, RF: random forest, SVM: support vector machine, XGB: extreme gradient boosting, DEGs: differentially expressed genes.
Figure 2
Figure 2
Mechanistic models based on FFLs outperform agnostic ones in predicting bladder cancer progression The figure depicts the performance of the agnostic and mechanistic models as obtained using the described bootstrap design. Briefly, all models were trained on 1000 bootstraps of the training data (transparent colors), then evaluated on untouched testing data (solid colors) using the Area Under the ROC Curve (AUC) as performance metric. Mechanistic models were based on the feedforward loops (37 pairs) (purple) and agnostic models were trained either using the top differentially expressed genes (74 genes) (green) or the corresponding pairwise comparisons (37 pairs) (yellow). Curves represent the smoothed density distributions of the AUC values, and each panel corresponds to one of the four algorithms used. KTSP: K-top scoring pairs; RF: random forest; SVM: support vector machine; XGB: extreme gradient boosting; FFLs: feedforward loops; DEGs: differentially expressed genes.
Figure 3
Figure 3
Mechanistic and agnostic k-TSPs signatures for predicting bladder cancer progression from non-muscle- to muscle-invasive stages (A) Bar plot showing the frequency of the agnostic (red) and mechanistic (blue) scoring pairs across the different bootstraps. The bar plot includes all the mechanistic pairs (n = 93) and the most frequent agnostic pairs (n = 93), both sorted by their frequency across the different bootstraps. (B) The top 10 most frequent agnostic (red) and mechanistic (blue) pairs sort by their frequency. (C and D) Networks of the top 93 agnostic (C) and mechanistic (D) top-scoring pairs. Each pair consists of a gene voting for BLCA progression (red) and no progression (yellow). The vertex size corresponds to 2∗log2 of the individual gene frequency across unique pairs while the edge thickness corresponds to the log2 of the top scoring pair frequency.
Figure 4
Figure 4
NOTCH-MYC-based models outperform their agnostic counterparts in predicting response to neoadjuvant chemotherapy in patients with triple-negative breast cancer Models were trained on 1000 bootstraps of the training data (transparent colors) and evaluated on the untouched testing data (solid colors) using the Area Under the ROC curve (AUC) as metric. Mechanistic models were based on the NOTCH-MYC mechanism (241 pairs) (purple) while agnostic models were trained either using the top differentially expressed genes (500 genes) (green) or the corresponding pairwise comparisons (250 pairs) (yellow). Shown are the smoothed density distributions of the AUC values with each panel corresponding to one of the four algorithms used. KTSP: K-top scoring pairs; RF: random forest; SVM: support vector machine; XGB: extreme gradient boosting; DEGs: differentially expressed genes; TNBC: triple-negative breast cancer.
Figure 5
Figure 5
Mechanistic and agnostic k-TSPs signatures for predicting the response to neoadjuvant chemotherapy in patients with triple-negative breast cancer (A) Bar plot showing the frequency of the top 100 agnostic (red) and mechanistic (blue) scoring pairs across the different bootstraps. (B) The top 10 most frequent agnostic (red) and mechanistic (blue) pairs sort by their frequency. (C and D) Networks of the top 100 agnostic (C) and mechanistic (D) top-scoring pairs. Each pair consists of a gene voting for RD (red) and pCR (yellow). The vertex size corresponds to 2∗log2 of the individual gene frequency across unique pairs while the edge thickness corresponds to the log2 of the top scoring pair frequency.
Figure 6
Figure 6
Mechanistic models based on cellular adhesion and oxygen response have similar performance to their agnostic counterparts in predicting prostate cancer metastatic progression The figure depicts the results from the bootstrap design in which the training set (transparent colors) was resampled 1000 times. On each resample, models were trained to predict metastatic progression in prostate cancer and their performance was evaluated on the untouched testing set (dark colors) using the Area Under the ROC Curve (AUC) as evaluation metric. Mechanistic models were based on the cellular adhesion and O2 response mechanism (50 pairs) (purple) while agnostic models were trained using either the top differentially expressed genes (100 genes) (green) or the corresponding pairwise comparisons (50 pairs) (yellow). Shown are the smoothed density distributions of the AUC values and each panel corresponds to one of the four algorithms used. KTSP: K-top scoring pairs; RF: random forest; SVM: support vector machine; XGB: extreme gradient boosting; DEGs: differentially expressed genes.
Figure 7
Figure 7
Mechanistic and agnostic k-TSPs signatures for predicting prostate cancer metastases (A) Bar plot showing the frequency of the top 100 agnostic (red) and mechanistic (blue) scoring pairs across the different bootstraps. (B) The top 10 most frequent agnostic (red) and mechanistic (blue) pairs sort by their frequency. (C and D) Networks of the top 100 agnostic (C) and mechanistic (D) top-scoring pairs. Each pair consists of a gene voting for metastasis (red) and no-metastasis (yellow). The vertex size corresponds to the 2∗log2 of the individual gene frequency across unique pairs while the edge thickness corresponds to the log2 of the top scoring pair frequency.

References

    1. Cardoso F., van’t Veer L.J., Bogaerts J., Slaets L., Viale G., Delaloge S., Pierga J.-Y., Brain E., Causeret S., DeLorenzi M., et al. 70-Gene signature as an aid to treatment decisions in early-stage breast cancer. N. Engl. J. Med. 2016;375:717–729. doi: 10.1056/NEJMoa1602253. - DOI - PubMed
    1. Knezevic D., Goddard A.D., Natraj N., Cherbavaz D.B., Clark-Langone K.M., Snable J., Watson D., Falzarano S.M., Magi-Galluzzi C., Klein E.A., Quale C. Analytical validation of the Oncotype DX prostate cancer assay - a clinical RT-PCR assay optimized for prostate needle biopsies. BMC Genom. 2013;14:690. doi: 10.1186/1471-2164-14-690. - DOI - PMC - PubMed
    1. Mirza B., Wang W., Wang J., Choi H., Chung N.C., Ping P. Machine learning and integrative analysis of biomedical big data. Genes. 2019;10:87. doi: 10.3390/genes10020087. - DOI - PMC - PubMed
    1. Keogh E., Mueen A. Encyclopedia of machine learning; 2010. Curse of Dimensionality; pp. 257–258.
    1. Hand D.J. Classifier technology and the illusion of progress. Stat. Sci. 2006;21:1–14. - PubMed

LinkOut - more resources