. 2023 Aug 1;146(8):3404-3415.
doi: 10.1093/brain/awad060.

Multimodal mapping of regional brain vulnerability to focal cortical dysplasia

Affiliations

Multimodal mapping of regional brain vulnerability to focal cortical dysplasia

Hyo M Lee et al. Brain. .

Erratum in

Abstract

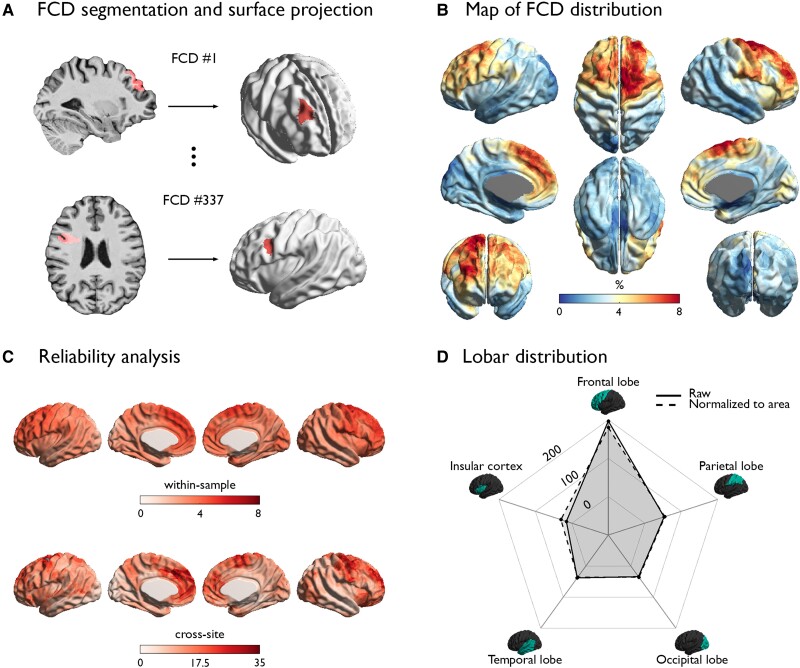
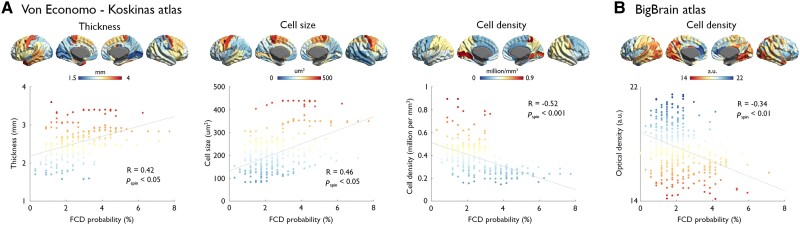
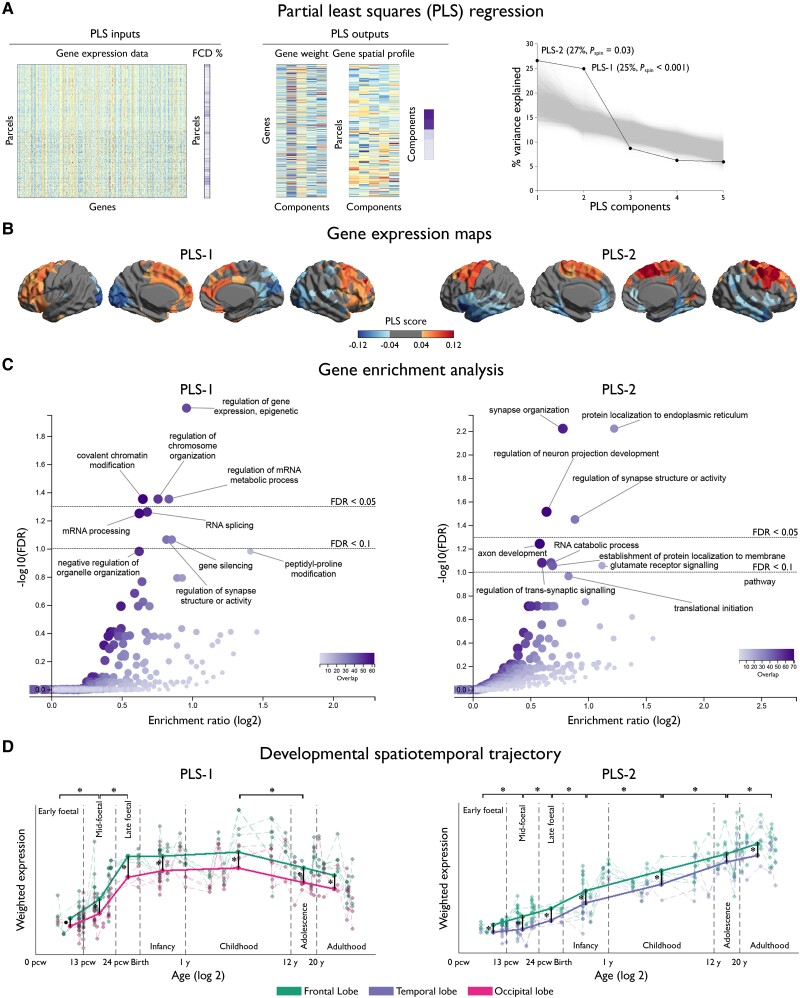
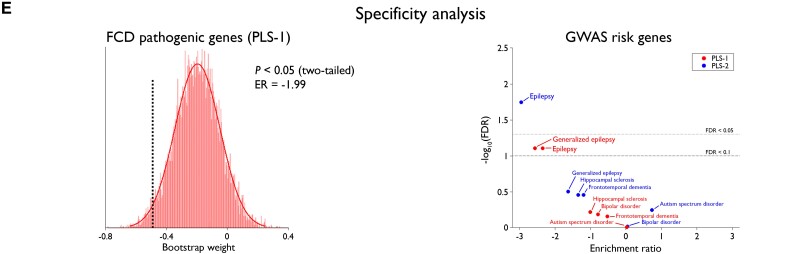
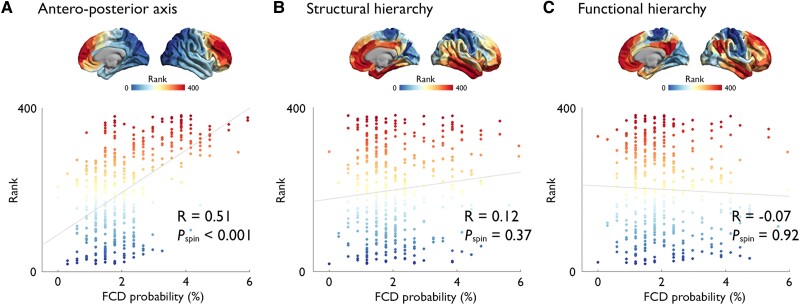
Focal cortical dysplasia (FCD) type II is a highly epileptogenic developmental malformation and a common cause of surgically treated drug-resistant epilepsy. While clinical observations suggest frequent occurrence in the frontal lobe, mechanisms for such propensity remain unexplored. Here, we hypothesized that cortex-wide spatial associations of FCD distribution with cortical cytoarchitecture, gene expression and organizational axes may offer complementary insights into processes that predispose given cortical regions to harbour FCD. We mapped the cortex-wide MRI distribution of FCDs in 337 patients collected from 13 sites worldwide. We then determined its associations with (i) cytoarchitectural features using histological atlases by Von Economo and Koskinas and BigBrain; (ii) whole-brain gene expression and spatiotemporal dynamics from prenatal to adulthood stages using the Allen Human Brain Atlas and PsychENCODE BrainSpan; and (iii) macroscale developmental axes of cortical organization. FCD lesions were preferentially located in the prefrontal and fronto-limbic cortices typified by low neuron density, large soma and thick grey matter. Transcriptomic associations with FCD distribution uncovered a prenatal component related to neuroglial proliferation and differentiation, likely accounting for the dysplastic makeup, and a postnatal component related to synaptogenesis and circuit organization, possibly contributing to circuit-level hyperexcitability. FCD distribution showed a strong association with the anterior region of the antero-posterior axis derived from heritability analysis of interregional structural covariance of cortical thickness, but not with structural and functional hierarchical axes. Reliability of all results was confirmed through resampling techniques. Multimodal associations with cytoarchitecture, gene expression and axes of cortical organization indicate that prenatal neurogenesis and postnatal synaptogenesis may be key points of developmental vulnerability of the frontal lobe to FCD. Concordant with a causal role of atypical neuroglial proliferation and growth, our results indicate that FCD-vulnerable cortices display properties indicative of earlier termination of neurogenesis and initiation of cell growth. They also suggest a potential contribution of aberrant postnatal synaptogenesis and circuit development to FCD epileptogenicity.

Keywords: MRI; epilepsy; focal cortical dysplasia; imaging-genetics; neurodevelopment.


Conflict of interest statement

The authors declare that they have no known competing financial interests or personal relationships that could have appeared to influence the work reported in this paper.

Figures

Figure 1
Figure 1
Cortex-wide FCD distribution. (A) For each patient, the FCD lesion was manually segmented on MRI and mapped onto its cortical surface. (B) Map of FCD distribution. (C) Reliability analysis. Within-sample and cross-site robustness of regional FCD probability is high where the FCD probability is high. (D) Lobar distribution. The spider plot of the FCD distribution across lobes demonstrates remarkable preference towards the frontal lobe, which holds after normalizing for the surface area of each lobe (dotted line).
Figure 2
Figure 2
Associations between FCD distribution and histological measures. Plots show correlations between FCD probability and cortical thickness, cell size and cell density derived from the von Economo–Koskinas atlas (A), as well as cell density (in arbitrary units, a.u.) indexed by optical density of silver-stained cells in the BigBrain atlas (B). In the scatterplots, x- and y-axes represent FCD probability (in %) and histological quantities, respectively; dots indicate 308 parcels of the DKA. Colour-coding is identical for brain maps and dots; Pspin indicates P-value after adjusting for spatial autocorrelation.
Figure 3
Figure 3
Cortex-wide association between FCD topography and gene expression. (A) PLS regression identified weighted combinations of genes, or PLS components, and their spatial expression profiles that best explained the regional variance in FCD distribution, or per cent variance explained; Pspin indicates P-value after adjusting for spatial autocorrelation). Inputs to PLS include the whole-brain gene expression data matrix (parcels by genes) and FCD distribution across parcels (in %). Outputs include gene weights (genes by components), gene spatial profiles (parcels by components) and per cent variance explained by PLS components. (B) Maps of gene expression. The colour scale indicates the score for PLS-1 and -2, namely the weighted average expression level of 20 737. (C) Gene enrichment analysis. Genes associated with PLS-1 were enriched for epigenetic, RNA and post-translational levels as well as covalent chromatin modification and chromosome organization; and PLS-2 for general synapse organization and activity. In the volcano plots, the x-axis indicates log2 of enrichment ratio and the y-axis indicates -log10 of FDR. Colour codes indicate the number of genes related to the biological processes that overlap with the input list of top 10 percentile genes; upper/lower dotted lines indicate FDR = 0.05/0.1. (D) Developmental spatiotemporal trajectory. The expression of genes associated with PLS-1 sharply increased from early to late foetal stages, plateaued during infancy and childhood, and decreased thereafter. Conversely, PLS-2 showed monotonic increase from early foetal stage to adulthood. In both instances, expressions were more marked in the frontal lobe. Dots represent cortical samples at a given time point colour-coded by lobes; dotted lines connecting dots correspond to the same region of interest. Thick coloured lines connect the average of samples within each time window, thereby showing the overall trajectory. Asterisks indicate FDR < 0.05. (E) Specificity analysis. PLS-1 was significantly enriched for FCD pathogenic genes; the histogram shows bootstrap weights of 10 000 permutations; the dotted line indicates the bootstrap weight of the candidate genes. In relation to GWAS-risk genes, PLS-2 (blue) was enriched for genes associated with all epilepsies, while PLS-1 (red) was marginally enriched for those associated with all and generalized epilepsies. Top dotted line indicates FDR = 0.05; bottom dotted line indicates FDR = 0.1.
Figure 3
Figure 3
Cortex-wide association between FCD topography and gene expression. (A) PLS regression identified weighted combinations of genes, or PLS components, and their spatial expression profiles that best explained the regional variance in FCD distribution, or per cent variance explained; Pspin indicates P-value after adjusting for spatial autocorrelation). Inputs to PLS include the whole-brain gene expression data matrix (parcels by genes) and FCD distribution across parcels (in %). Outputs include gene weights (genes by components), gene spatial profiles (parcels by components) and per cent variance explained by PLS components. (B) Maps of gene expression. The colour scale indicates the score for PLS-1 and -2, namely the weighted average expression level of 20 737. (C) Gene enrichment analysis. Genes associated with PLS-1 were enriched for epigenetic, RNA and post-translational levels as well as covalent chromatin modification and chromosome organization; and PLS-2 for general synapse organization and activity. In the volcano plots, the x-axis indicates log2 of enrichment ratio and the y-axis indicates -log10 of FDR. Colour codes indicate the number of genes related to the biological processes that overlap with the input list of top 10 percentile genes; upper/lower dotted lines indicate FDR = 0.05/0.1. (D) Developmental spatiotemporal trajectory. The expression of genes associated with PLS-1 sharply increased from early to late foetal stages, plateaued during infancy and childhood, and decreased thereafter. Conversely, PLS-2 showed monotonic increase from early foetal stage to adulthood. In both instances, expressions were more marked in the frontal lobe. Dots represent cortical samples at a given time point colour-coded by lobes; dotted lines connecting dots correspond to the same region of interest. Thick coloured lines connect the average of samples within each time window, thereby showing the overall trajectory. Asterisks indicate FDR < 0.05. (E) Specificity analysis. PLS-1 was significantly enriched for FCD pathogenic genes; the histogram shows bootstrap weights of 10 000 permutations; the dotted line indicates the bootstrap weight of the candidate genes. In relation to GWAS-risk genes, PLS-2 (blue) was enriched for genes associated with all epilepsies, while PLS-1 (red) was marginally enriched for those associated with all and generalized epilepsies. Top dotted line indicates FDR = 0.05; bottom dotted line indicates FDR = 0.1.
Figure 4
Figure 4
Relation to developmental axes of cortical organization. FCD distribution showed a strong association with the anterior region of the antero-posterior axis derived from heritability analysis of interregional structural covariance of cortical thickness (A), but not with structural (B) and functional (C) hierarchical axes; x- and y-axes represent the FCD probability (in %) and the rank along the gradient axes, also represented as maps. The colour scale represents the percentage of patients in whom the FCD is located at a given vertex.

References

    1. Blumcke I, Spreafico R, Haaker G, et al. Histopathological findings in brain tissue obtained during epilepsy surgery. N Engl J Med. 2017;377:1648–1656. - PubMed
    1. Blumcke I, Thom M, Aronica E, et al. The clinicopathologic spectrum of focal cortical dysplasias: A consensus classification proposed by an ad hoc task force of the ILAE diagnostic methods commission. Epilepsia. 2011;52:158–174. - PMC - PubMed
    1. Iffland PH, Crino PB. Focal cortical dysplasia: Gene mutations, cell signaling, and therapeutic implications. Annu Rev Pathol. 2017;12:547–571. - PubMed
    1. Jamuar SS, Lam A-TN, Kircher M, et al. Somatic mutations in cerebral cortical malformations. N Engl J Med. 2014;371:733–743. - PMC - PubMed
    1. Lim JS, Kim WI, Kang HCet al. Brain somatic mutations in MTOR cause focal cortical dysplasia type II leading to intractable epilepsy. Nat Med. 2015;21:395–400. - PubMed

Publication types

MeSH terms

Supplementary concepts