. 2023 Mar 15;150(6):dev201147.
doi: 10.1242/dev.201147. Epub 2023 Mar 27.

Endothelial deletion of Wt1 disrupts coronary angiogenesis and myocardium development

Affiliations

Endothelial deletion of Wt1 disrupts coronary angiogenesis and myocardium development

Marina Ramiro-Pareta et al. Development. .

Abstract

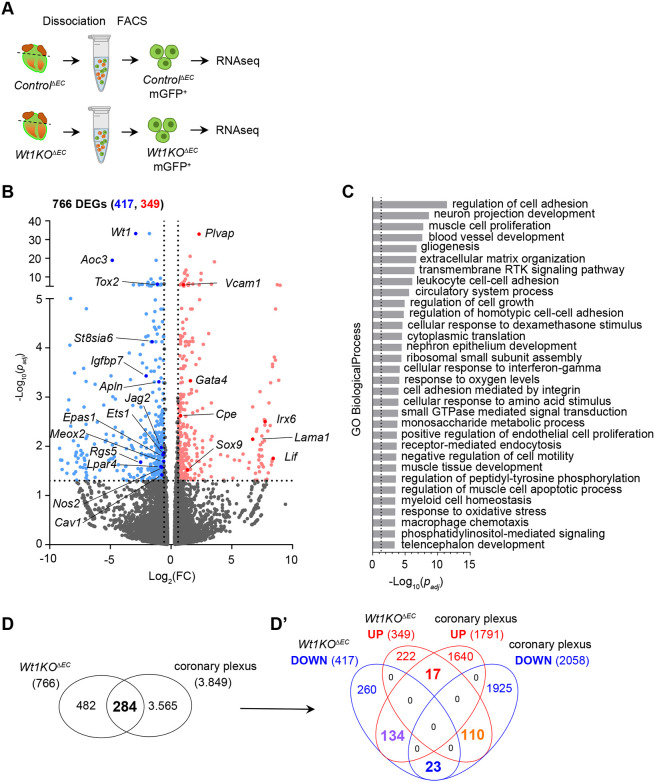
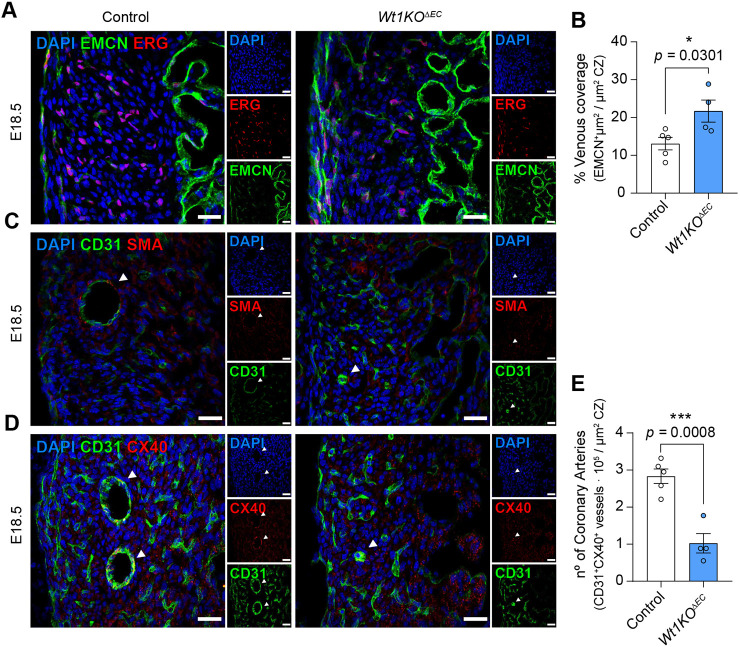
Wt1 encodes a zinc finger protein that is crucial for epicardium development. Although WT1 is also expressed in coronary endothelial cells (ECs), the abnormal heart development observed in Wt1 knockout mice is mainly attributed to its functions in the epicardium. Here, we have generated an inducible endothelial-specific Wt1 knockout mouse model (Wt1KOΔEC). Deletion of Wt1 in ECs during coronary plexus formation impaired coronary blood vessels and myocardium development. RNA-Seq analysis of coronary ECs from Wt1KOΔEC mice demonstrated that deletion of Wt1 exerted a major impact on the molecular signature of coronary ECs and modified the expression of several genes that are dynamically modulated over the course of coronary EC development. Many of these differentially expressed genes are involved in cell proliferation, migration and differentiation of coronary ECs; consequently, the aforementioned processes were affected in Wt1KOΔEC mice. The requirement of WT1 in coronary ECs goes beyond the initial formation of the coronary plexus, as its later deletion results in defects in coronary artery formation. Through the characterization of these Wt1KOΔEC mouse models, we show that the deletion of Wt1 in ECs disrupts physiological blood vessel formation.

Keywords: Angiogenesis; Blood vessel formation; Coronary endothelial cells; Heart development; WT1.


Conflict of interest statement

Competing interests The authors declare no competing or financial interests.

Figures

Fig. 1.
Fig. 1.
Efficient deletion of Wt1 in coronary ECs from Wt1KOΔEC mouse model. (A) Schematic illustration showing the tamoxifen administration scheme and the experimental strategy to obtain Wt1KOΔEC and control mice. Pregnant mice carrying control and Wt1KOΔEC embryos were administered tamoxifen in the early stages of coronary formation onset (E11.5-E13.5) and embryos were analysed at E15.5. (B) qRT-PCR analysis of Wt1 expression in heart ventricles from Wt1KOΔEC and control mice. Data are mean±s.e.m. (n=4 or 5). *P<0.05, one-way ANOVA followed by Tukey's post-hoc test. (C) Immunofluorescence staining for WT1 (red) and staining of IB4 (green) and nuclear DAPI (blue), using heart sections from control and Wt1KOΔEC E15.5 mice. There is specific downregulation of WT1 expression in coronary ECs (white arrowheads) while its expression in the epicardium and EPDCs is not affected (yellow arrowheads). (D) EC isolation procedure from enzymatically digested ControlΔEC and Wt1KOΔEC heart ventricles at E15.5. (E) qRT-PCR analysis of Wt1 expression in mGFP+ FACS-isolated ECs from Wt1KOΔEC and ControlΔEC hearts. A dramatic downregulation of Wt1 expression is observed in ECs from Wt1KOΔEC mice. Data are mean±s.e.m. (n=4). **P<0.01 (unpaired t-test with Welch's correction). Scale bars: 25 μm.
Fig. 2.
Fig. 2.
Wt1KOΔEC mice display defects in myocardium development. (A) Schematic illustration showing the experimental protocol strategy to obtain and analyse Wt1KOΔEC mice. Pregnant mice were administered tamoxifen from E11.5 to E13.5 and embryos were analysed at E15.5 and E18.5. (B) Immunostaining for endomucin (EMCN, green) and sarcomeric myosin (MF20, red) on E15.5 and E18.5 heart sections from control and Wt1KOΔEC mice. (B′) Area outlined in B, showing EMCN staining as an indicator of trabecular myocardium zone (TZ) versus the compact myocardium zone (CZ). (C,D) Quantification of CZ and TZ width in control and Wt1KOΔEC mice confirms the significant effect of endothelial Wt1 deletion on the CZ both at mid (E15.5) and late (E18.5) developmental stages. Data are mean±s.e.m. (n=7). *P<0.05, **P<0.01, ****P<0.0001 (two-way ANOVA). (E) E15.5 heart sections from control and Wt1KOΔEC mice treated with BrdU were immunostained using antibodies against sarcomeric myosin (MF20, red) and BrdU (green), and counterstained with DAPI (blue). (E′) Area outlined in E. (F) Quantitation of proliferative cardiomyocytes (CMs) (% BrdU+ MF20+/DAPI+) from control and Wt1KOΔEC heart sections at E15.5. Data are mean±s.e.m (n=6-7). *P<0.05 (unpaired t-test). Scale bars: 250 µm in B,E; 50 µm in B′ and 25 µm in E′.
Fig. 3.
Fig. 3.
Wt1KOΔEC mice display defects in coronary blood vessel development. (A) Schematic illustration showing the experimental protocol strategy to obtain and analyse Wt1KOΔEC mice. Pregnant mice were administered tamoxifen from E11.5 to E13.5, and embryos were analysed at E15.5 and E18.5. (B) Immunofluorescence staining for CD31 (green) and nuclear DAPI (blue), using heart sections from control and Wt1KOΔEC at E15.5. (B′) Magnified images of CD31 staining from the areas outlined in B. (C) Quantitation of the CD31+ signal in the compact myocardium zone (CZ) of control and Wt1KOΔEC hearts. Data are mean±s.e.m. (n=3). *P<0.05 (unpaired t-test). (D) Quantitation of CD31+ immunostaining localization from heart sections of control and Wt1KOΔEC mice at E15.5 and E18.5, reported as a percentage of intensity within a particular bin against the distance from the epicardial surface of the heart. In the Wt1KOΔEC heart, CD31+ staining is increased near the epicardium and reduced in deeper myocardium layers. Data are mean±s.e.m. (n=3, E15.5; n=4 or 5, E18.5). ****P<0.0001 (Mann–Whitney test). (E) EC isolation and representative FACS analysis of enzymatically digested ControlΔEC and Wt1KOΔEC heart ventricles at E15.5. (F) Quantification of mGFP+ ECs from enzymatically digested ControlΔEC and Wt1KOΔEC heart ventricles at E15.5. Data are mean±s.e.m. (n=6). *P<0.05 (unpaired t-test with Welch's correction). Scale bars: 250 µm in B; 50 µm in B′.
Fig. 4.
Fig. 4.
WT1 regulates the transcriptomic profile of coronary ECs. (A) Schematic illustration showing the experimental strategy to obtain coronary ECs for RNA-Seq from ControlΔEC and Wt1KOΔEC mice. E15.5 heart ventricles were enzymatically digested and mGFP+ ECs were FACS-isolated and processed for RNA extraction and sequencing. (B) Volcano plot of the 766 DEGs (Log2FC >|0.58|) identified by transcriptomic analysis of mGFP+ sorted cells from ControlΔEC versus Wt1KOΔEC hearts. Significantly upregulated (349, red) and downregulated (417, blue) genes are represented in terms of significance, -Log10 (P-value). (C) GO enrichment analysis using DEGs from E15.5 Wt1KOΔEC. Significantly up- and downregulated genes (P<0.05, and Log2FC>|0.58|) were used for this analysis; GO enrichment analysis was performed using a two-tailed hypergeometric test; the P-value was corrected using a Bonferroni step-down. Only Grouped GO Terms with P<0.05 are displayed (dotted line). (D) Venn diagram of a comparative analysis of deregulated genes from the transcriptomic profile of Wt1KOΔEC with DEGs during coronary EC remodeling. (D′) Up- and downregulated genes corresponding to both analyses. Numbers in bold indicate the total number of signatures common to the two analyses.
Fig. 5.
Fig. 5.
Wt1KO ECs exhibited impaired cell proliferation and migration. (A) E15.5 heart sections from control and Wt1KOΔEC mice treated with BrdU were immunostained with antibodies against ERG (red), BrdU (white) and IB4 (green), and counterstained with DAPI (blue). (B) Quantitation of proliferative ECs (%BrdU+ERG+/ERG+) from control and Wt1KOΔEC. Data are mean±s.e.m. (n=6 or 7). ***P<0.001, unpaired t-test. (C) Immunostaining for ERG (red) and nuclear DAPI staining (blue), using heart sections from control and Wt1KOΔEC at the indicated stages. (D) Quantitation of ERG+ immunostaining localization, reported as a percentage of intensity within a particular bin against the distance from the epicardium surface. Data are mean±s.e.m. from control (n=3, E15.5; n=5, E18.5) and Wt1KOΔEC hearts (n=3, E15.5; n=4, E18.5). ****P<0.0001 (Mann–Whitney test). (E) Quantitation of the length-to-width ratio of ERG+ nuclei. Data are mean±s.e.m. from control (n=3, E15.5; n=5, E18.5) and Wt1KOΔEC hearts (n=3, E15.5; n=4, E18.5) of comparable compact myocardium fields *P<0.05, **P<0.01 (two-way ANOVA). Scale bars: 25 µm in A; 50 µm in C.
Fig. 6.
Fig. 6.
Wt1KOΔEC hearts display an altered pattern of venous and arterial specification. (A) Immunostaining for ERG (red), EMCN (green) and nuclear DAPI staining (blue), using heart sections from control and Wt1KOΔEC E18.5 mice. Accumulation of EMCN+ vessels is observed in the subepicardial region of Wt1KOΔEC hearts. (B) Quantitation of EMCN+ signal in the compact myocardium zone (CZ) shows increased percentage of venous coverage. Data are mean±s.e.m. n=5. *P<0.05 (unpaired t-test). (C) Immunofluorescence staining for PECAM (green) and SMA (red), and nuclear DAPI staining (blue), using heart sections from control and Wt1KOΔEC mice at E18.5. Very few SMA-covered CD31+ vessels are observed in the CZ of Wt1KOΔEC hearts. (D) Immunofluorescence staining of section from E18.5 hearts with antibodies against CD31 (green) and CX40 (red, arterial ECs) reveals small-calibre arteries in the Wt1KOΔEC. (E) Quantitation of CX40+CD31+ vessels within the CZ. Data are mean±s.e.m. n=4 or 5. ***P<0.001 (unpaired t-test). Scale bars: 25 µm.
Fig. 7.
Fig. 7.
Late Wt1 deletion in coronary ECs affects coronary artery development. (A) Schematic illustration showing the experimental protocol strategy to obtain and analyse a late Wt1KOΔEC (LateWt1KOΔEC) mouse model. Pregnant mice were administered tamoxifen from E14.5 to E16.5 and embryos were analysed at E18.5. (B) Immunofluorescent staining for CD31 (green) and nuclear DAPI (blue), using heart sections from control and LateWt1KOΔEC at E18.5. (B′) Magnified images of CD31 staining from the areas outlined in B. (C) Quantitation of the CD31+ signal in the compact myocardium zone (CZ) reveals a reduction in the endothelial area of LateWt1KOΔEC hearts. Data are mean±s.e.m. n=5 or 6. *P<0.05 (unpaired t-test). (D) Immunostaining for endomucin (EMCN, green), ERG (red) and DAPI (blue) on E18.5 heart sections from control and LateWt1KOEC mice. (E) Quantitation of EMCN+ signal in the CZ shows no alteration in venous coverage in LateWt1KOEC hearts. Data are mean±s.e.m. n=5. ns: P≥0.05 (unpaired t-test). (F) Immunofluorescent staining of heart section from E18.5 hearts with antibodies against CD31 (green) and CX40 (red). (G) Quantitation of CX40+CD31+ vessels within the CZ reveals a reduction of arteries in the LateWt1KOΔEC. Data are mean±s.e.m. n=6. *P<0.05 (unpaired t-test). Scale bars: 250 µm in B; 100 µm in B′; 50 µm in D,F.

References

    1. Ariza, L., Rojas, A., Muñoz-Chápuli, R. and Carmona, R. (2019). The Wilms’ tumor suppressor gene regulates pancreas homeostasis and repair. PLoS Genet. 15, e1007971. 10.1371/journal.pgen.1007971 - DOI - PMC - PubMed
    1. Bharathavikru, R., Dudnakova, T., Aitken, S., Slight, J., Artibani, M., Hohenstein, P., Tollervey, D. and Hastie, N. (2017). Transcription factor Wilms’ tumor 1 regulates developmental RNAs through 3′ UTR interaction. Genes Dev. 31, 347-352. 10.1101/gad.291500.116 - DOI - PMC - PubMed
    1. Cano, E., Carmona, R., Ruiz-Villalba, A., Rojas, A., Chau, Y. Y., Wagner, K. D., Wagner, N., Hastie, N. D., Munoz-Chapuli, R. and Perez-Pomares, J. M. (2016). Extracardiac septum transversum/proepicardial endothelial cells pattern embryonic coronary arterio-venous connections. Proc. Natl. Acad. Sci. U.S.A. 113, 656-661. 10.1073/pnas.1509834113 - DOI - PMC - PubMed
    1. Chang, A. H., Raftrey, B. C., D'amato, G., Surya, V. N., Poduri, A., Chen, H. I., Goldstone, A. B., Woo, J., Fuller, G. G., Dunn, A. R.et al. (2017). DACH1 stimulates shear stress-guided endothelial cell migration and coronary artery growth through the CXCL12-CXCR4 signaling axis. Genes Dev. 31, 1308-1324. 10.1101/gad.301549.117 - DOI - PMC - PubMed
    1. Chau, Y. Y., Brownstein, D., Mjoseng, H., Lee, W. C., Buza-Vidas, N., Nerlov, C., Jacobsen, S. E., Perry, P., Berry, R., Thornburn, A.et al. (2011). Acute multiple organ failure in adult mice deleted for the developmental regulator Wt1. PLoS Genet. 7, e1002404. 10.1371/journal.pgen.1002404 - DOI - PMC - PubMed

Publication types