

Choosing transcatheter aortic valve replacement in porcelain aorta: outcomes versus surgical replacement
- PMID: 36852849
- PMCID: PMC10894003
- DOI: 10.1093/ejcts/ezad057
Choosing transcatheter aortic valve replacement in porcelain aorta: outcomes versus surgical replacement
Abstract
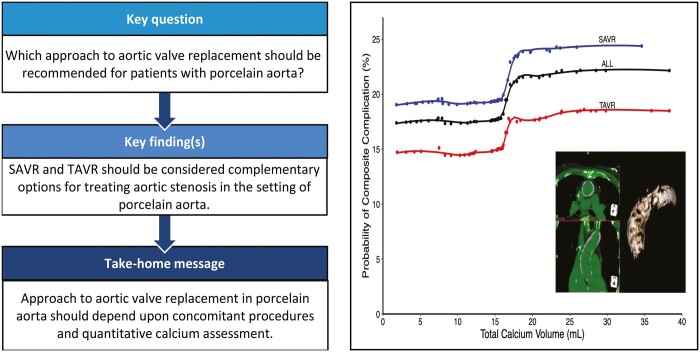
Objectives: Porcelain aorta complicates aortic valve replacement and is an indication for transcatheter approaches. No study has compared surgical and transcatheter valve replacement in the setting of porcelain aorta. We characterize porcelain aorta patients undergoing aortic valve replacement and the association of aortic calcification and outcomes.
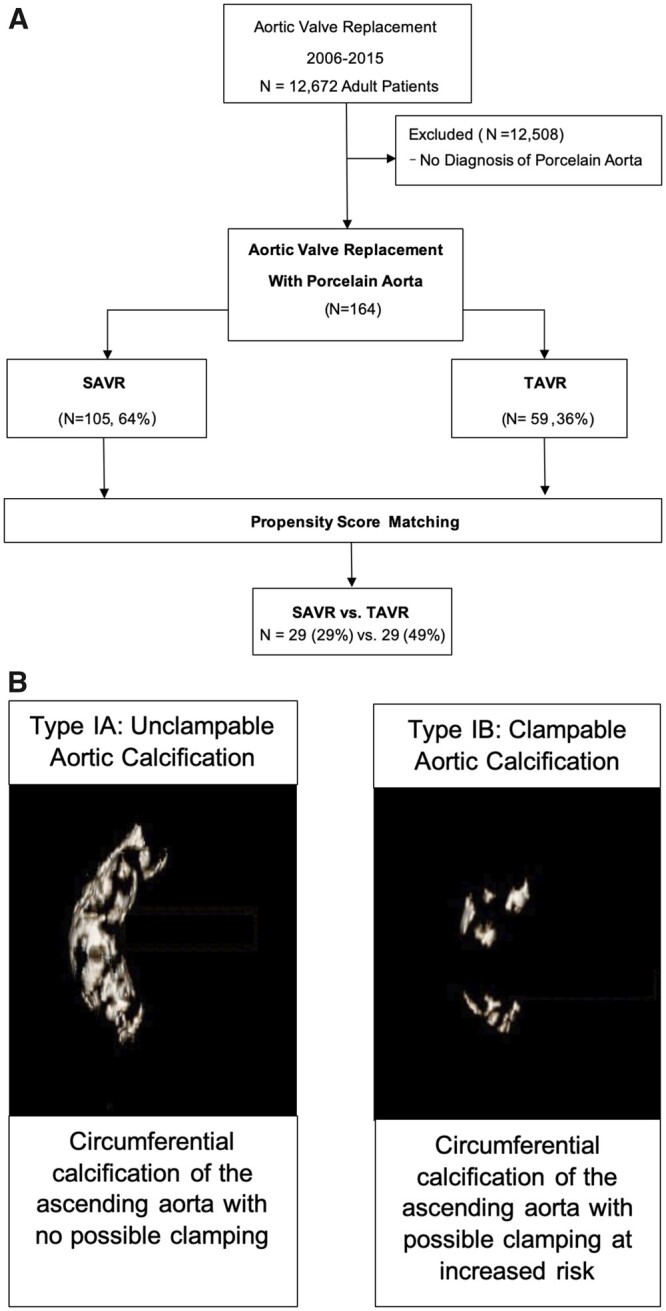
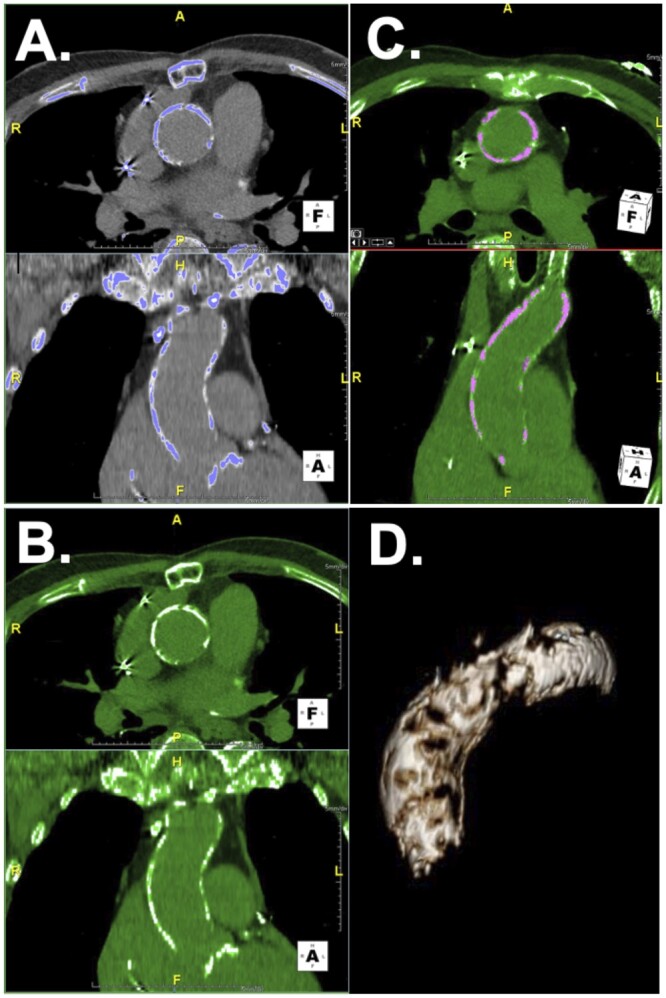
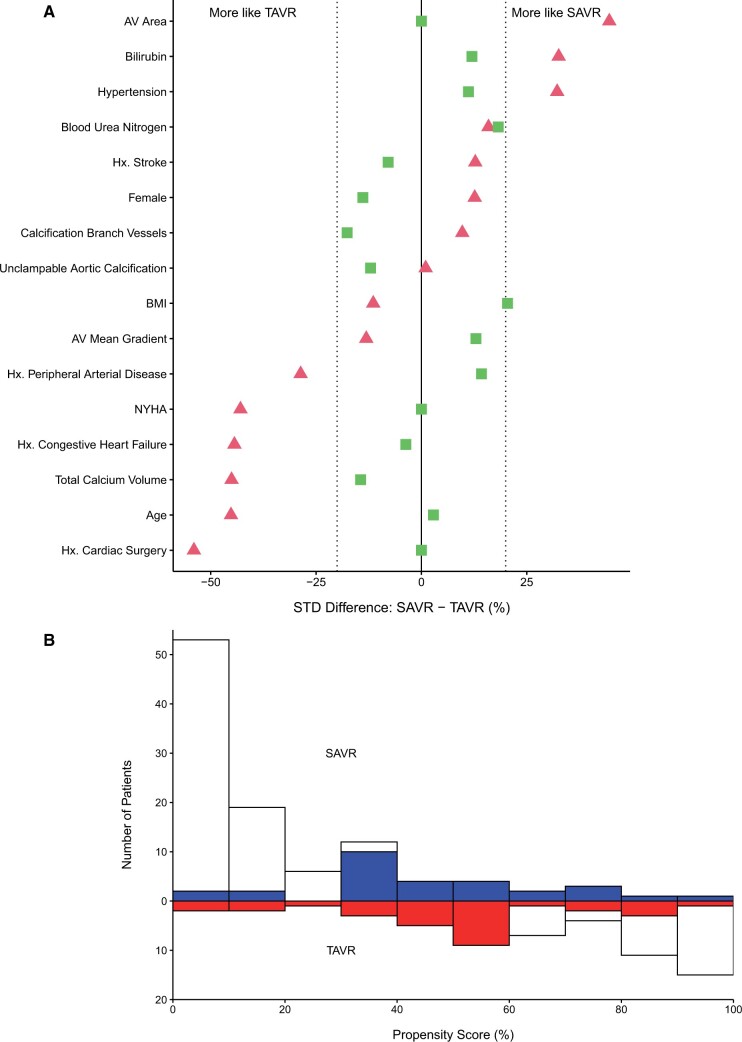
Methods: Patients undergoing aortic valve replacement with porcelain aorta were identified. Aortic calcium volume was determined using 3D computed tomography thresholding techniques. Propensity scoring was performed to assess the effect of surgical versus transcatheter approaches. Risk factors for composite major hospital complications (death, stroke and dialysis) were identified using random forest machine learning.
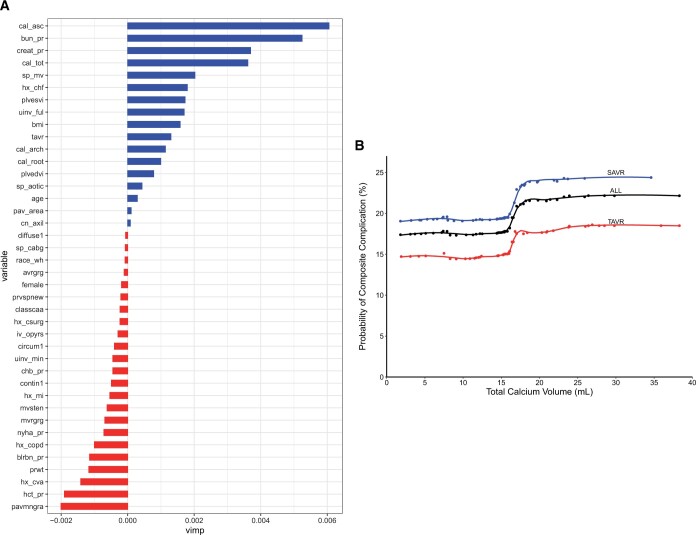
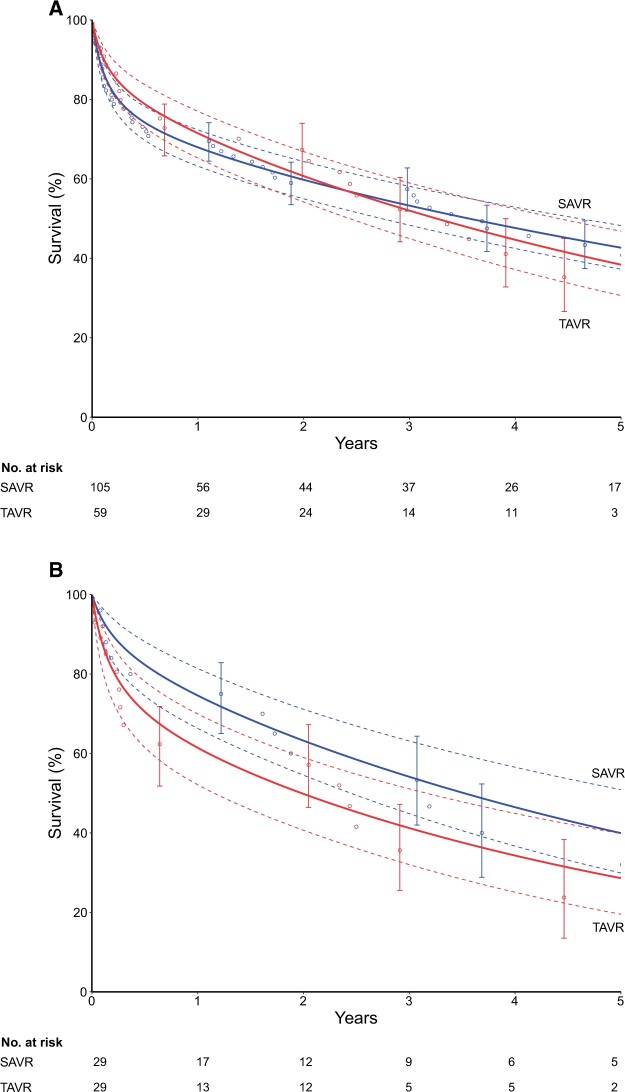
Results: From January 2006 to January 2015, 164 patients with porcelain aorta underwent aortic valve replacement [105 (64%) surgical replacement, 59 (36%) transcatheter replacement]. Propensity scoring matched 29 pairs (49% of transcatheter patients). Before matching, 5-year survival was 41% [(43% surgical, 35% transcatheter, P(log-rank) = 0.9]. After matching, mortality for surgical versus transcatheter replacement was 3.4% (n = 1) vs 10% (n = 3), stroke 14% (n = 4) vs 3.4% (n = 1) and dialysis 6.9% (n = 2) versus 11% (n = 3). Matched 5-year survival was 40% after surgical replacement and 29% after transcatheter replacement [P(log-rank) = 0.4]. Total aortic calcium volume was greater in transcatheter than surgical patients [18 (8.0) vs 17 (7.7) ml] and was associated with more major hospital complications after either approach.
Conclusions: Surgical and transcatheter approaches are complementary options for aortic stenosis with porcelain aorta. Surgical valve replacement remains an effective treatment for patients requiring concomitant procedures. Quantifying aortic calcium volume is a helpful risk predictor in all patients with porcelain aorta.
Keywords: Aortic stenosis; Calcium volume quantification; Operative approach.
© The Author(s) 2023. Published by Oxford University Press on behalf of the European Association for Cardio-Thoracic Surgery. All rights reserved.
Figures
Comment in
-
Choosing transcatheter aortic valve replacement in porcelain aorta: outcomes versus surgical replacement.Eur J Cardiothorac Surg. 2023 May 2;63(5):ezad156. doi: 10.1093/ejcts/ezad156. Eur J Cardiothorac Surg. 2023. PMID: 37099720 No abstract available.
References
-
- Abramowitz Y, Jilaihawi H, Chakravarty T, Mack MJ, Makkar RR. Porcelain aorta: a comprehensive review. Circulation 2015;131:827–36. - PubMed
-
- LeMaire SA. Individualized treatment strategies for patients with aortic valve disease and porcelain aorta. J Thorac Cardiovasc Surg 2015;149:134–6. - PubMed
-
- Urbanski PP, Luehr M, Bartolomeo D, Diegeler R, De Paulis A, Esposito R et al. Multicentre analysis of current strategies and outcomes in open aortic arch surgery: heterogeneity is still an issue. Eur J Cardiothorac Surg 2016;50:249–55. - PubMed
-
- Djaiani G, Fedorko L, Borger M, Mikulis D, Carroll J, Cheng D et al. Mild to moderate atheromatous disease of the thoracic aorta and new ischemic brain lesions after conventional coronary artery bypass graft surgery. Stroke 2004;35:e356–8. - PubMed
-
- Zahn R, Schiele R, Gerckens U, Linke A, Sievert H, Kahlert P et al. Transcatheter aortic valve implantation in patients with “porcelain” aorta (from a Multicenter Real World Registry). Am J Cardiol 2013;111:602–8. - PubMed
MeSH terms
Substances
Grants and funding
LinkOut - more resources
Full Text Sources
Medical
