. 2023 Apr 1;324(4):L536-L549.
doi: 10.1152/ajplung.00223.2022. Epub 2023 Feb 28.

Single-cell RNA sequencing reveals unique monocyte-derived interstitial macrophage subsets during lipopolysaccharide-induced acute lung inflammation

Affiliations

Single-cell RNA sequencing reveals unique monocyte-derived interstitial macrophage subsets during lipopolysaccharide-induced acute lung inflammation

Peter K Moore et al. Am J Physiol Lung Cell Mol Physiol. .

Abstract

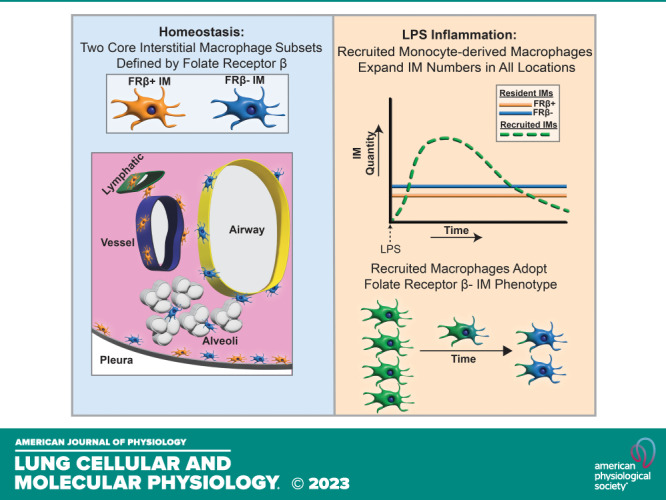
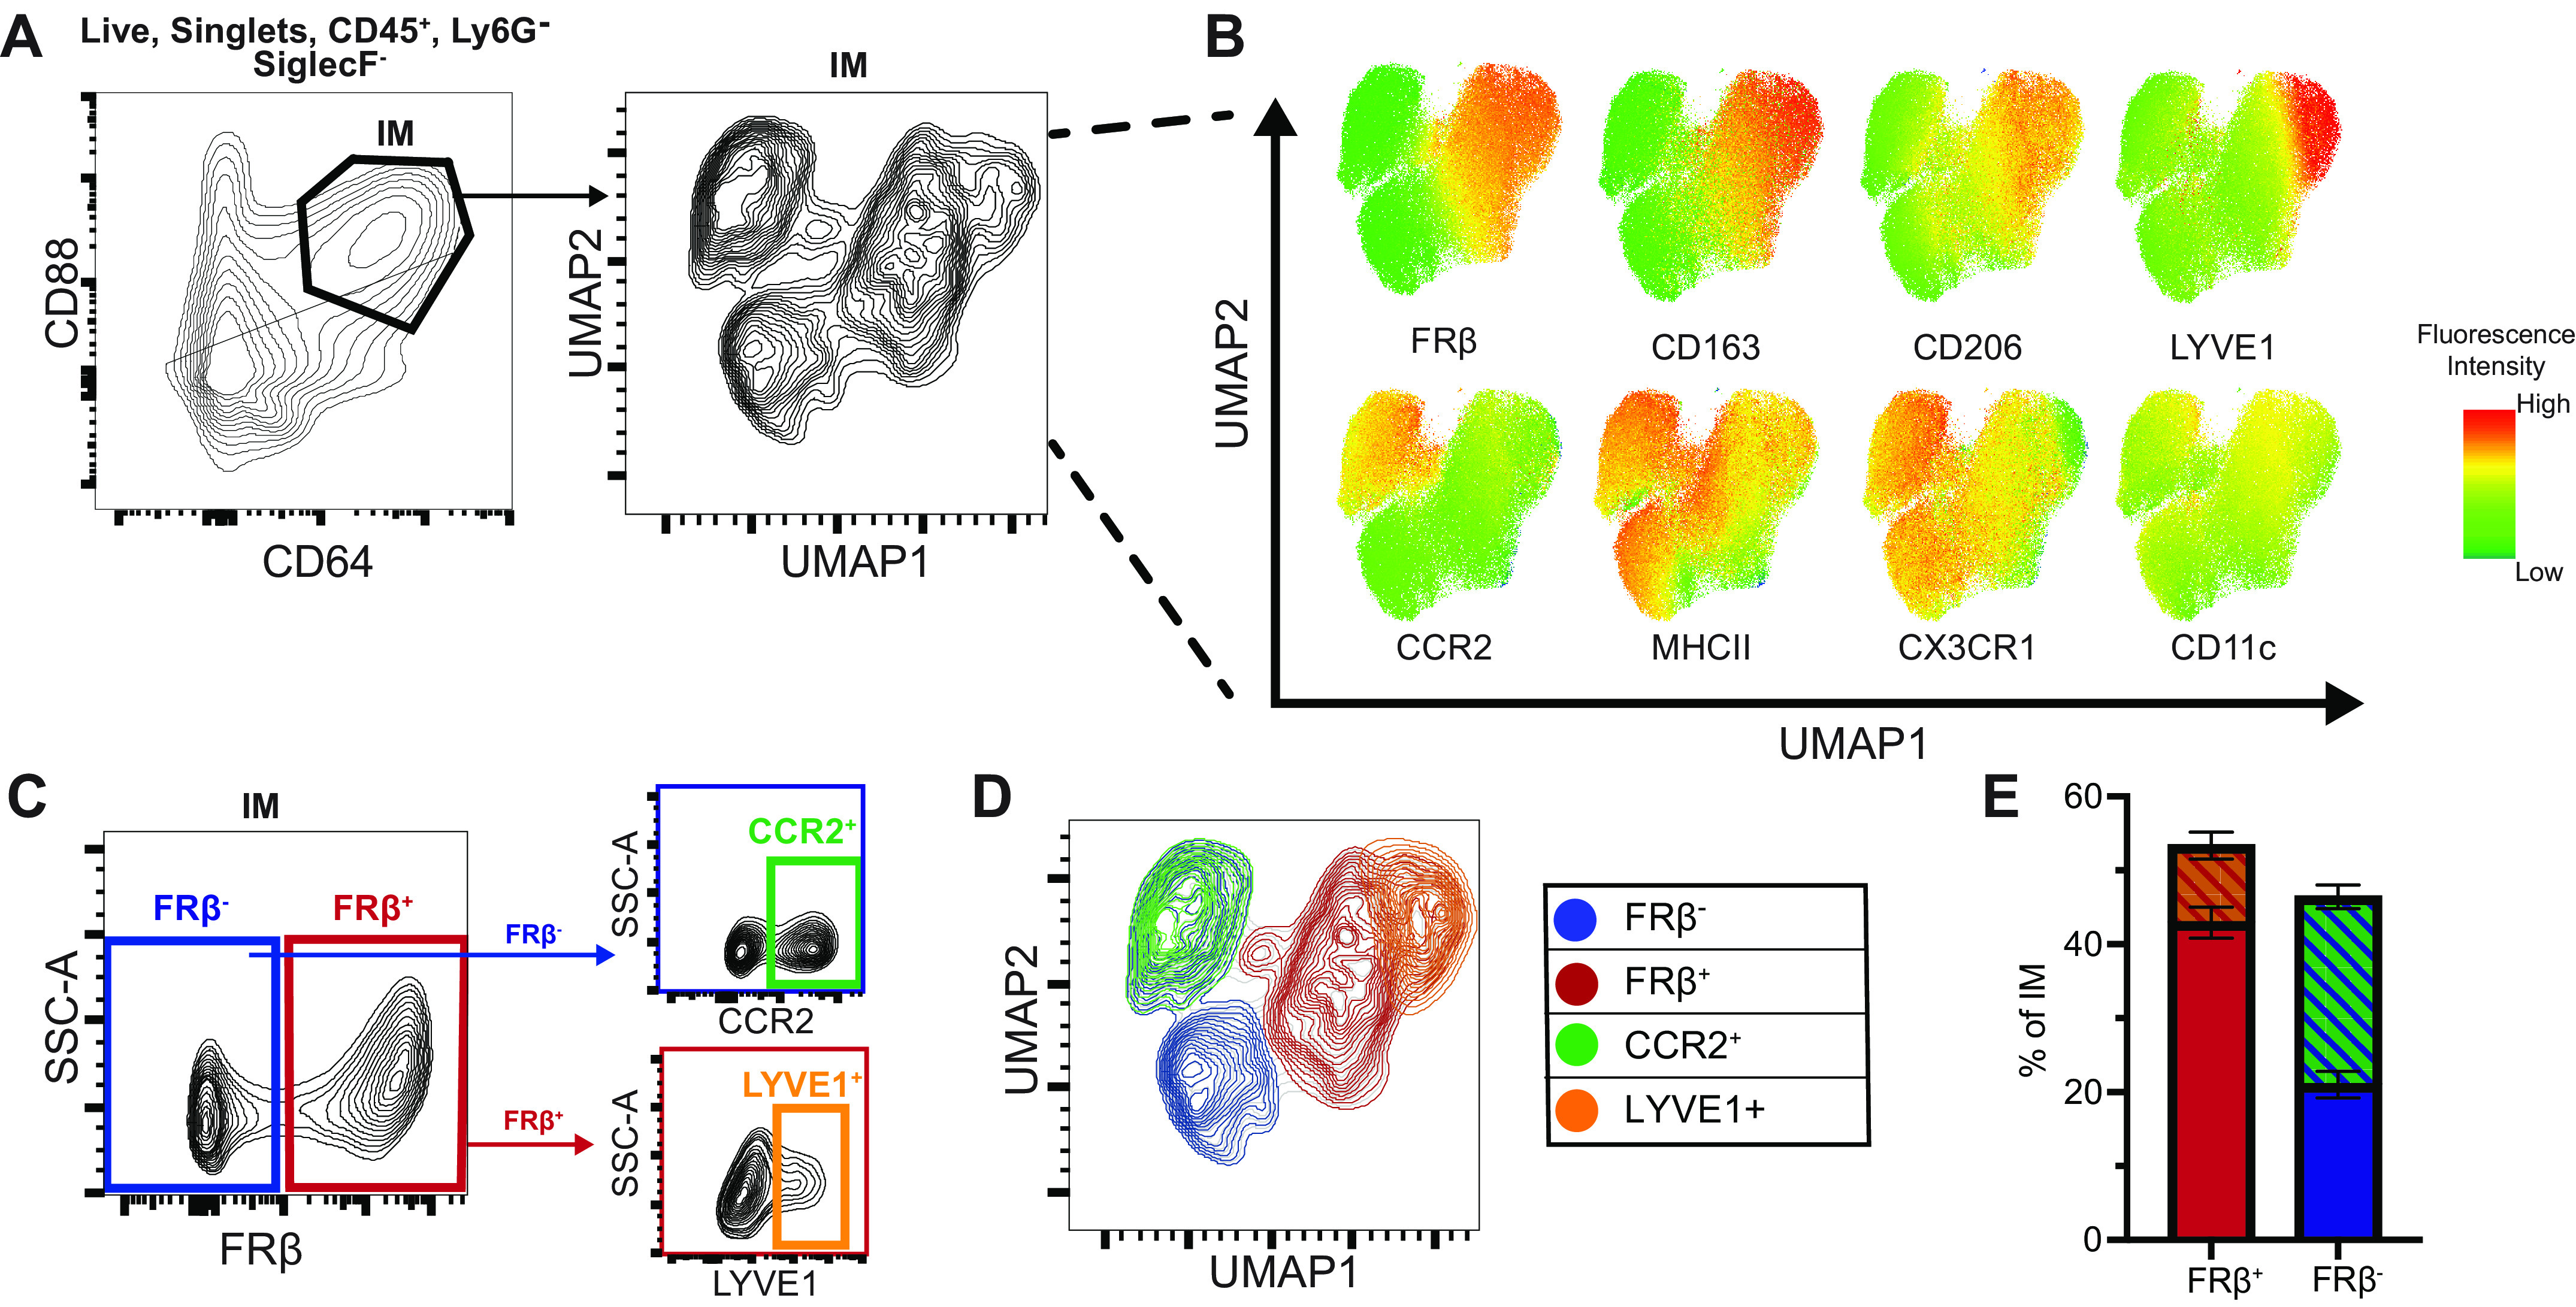
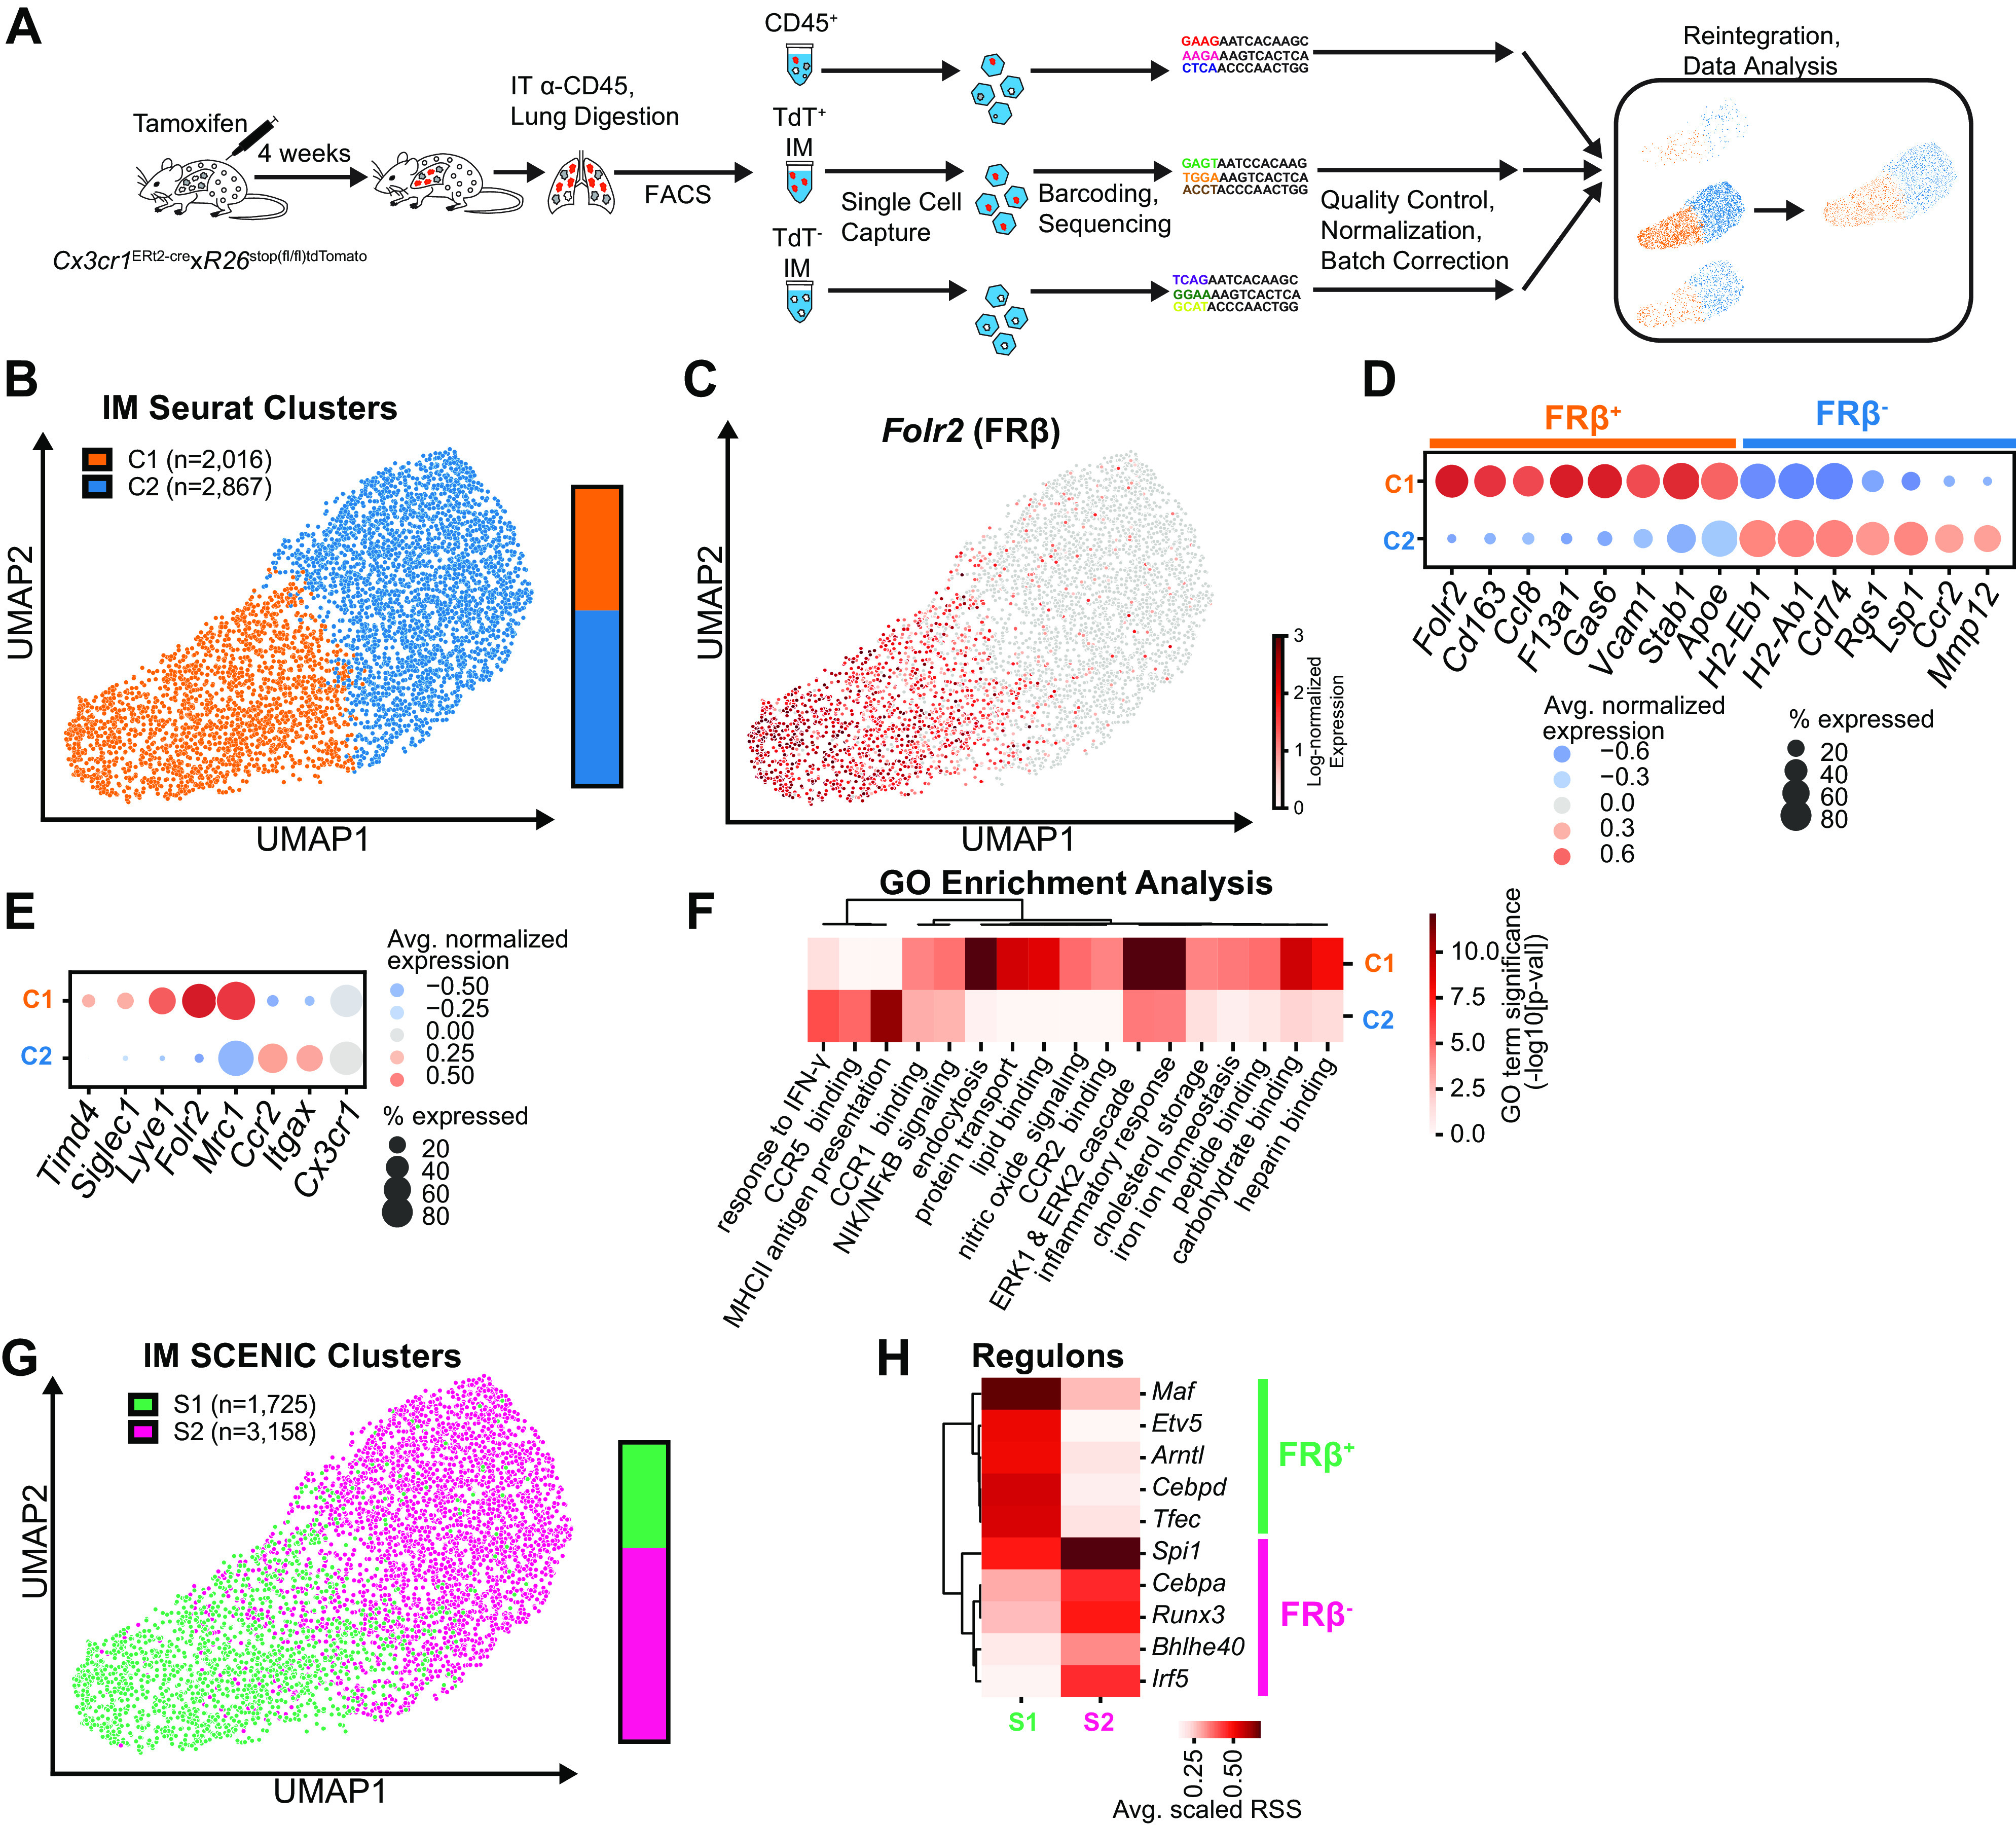
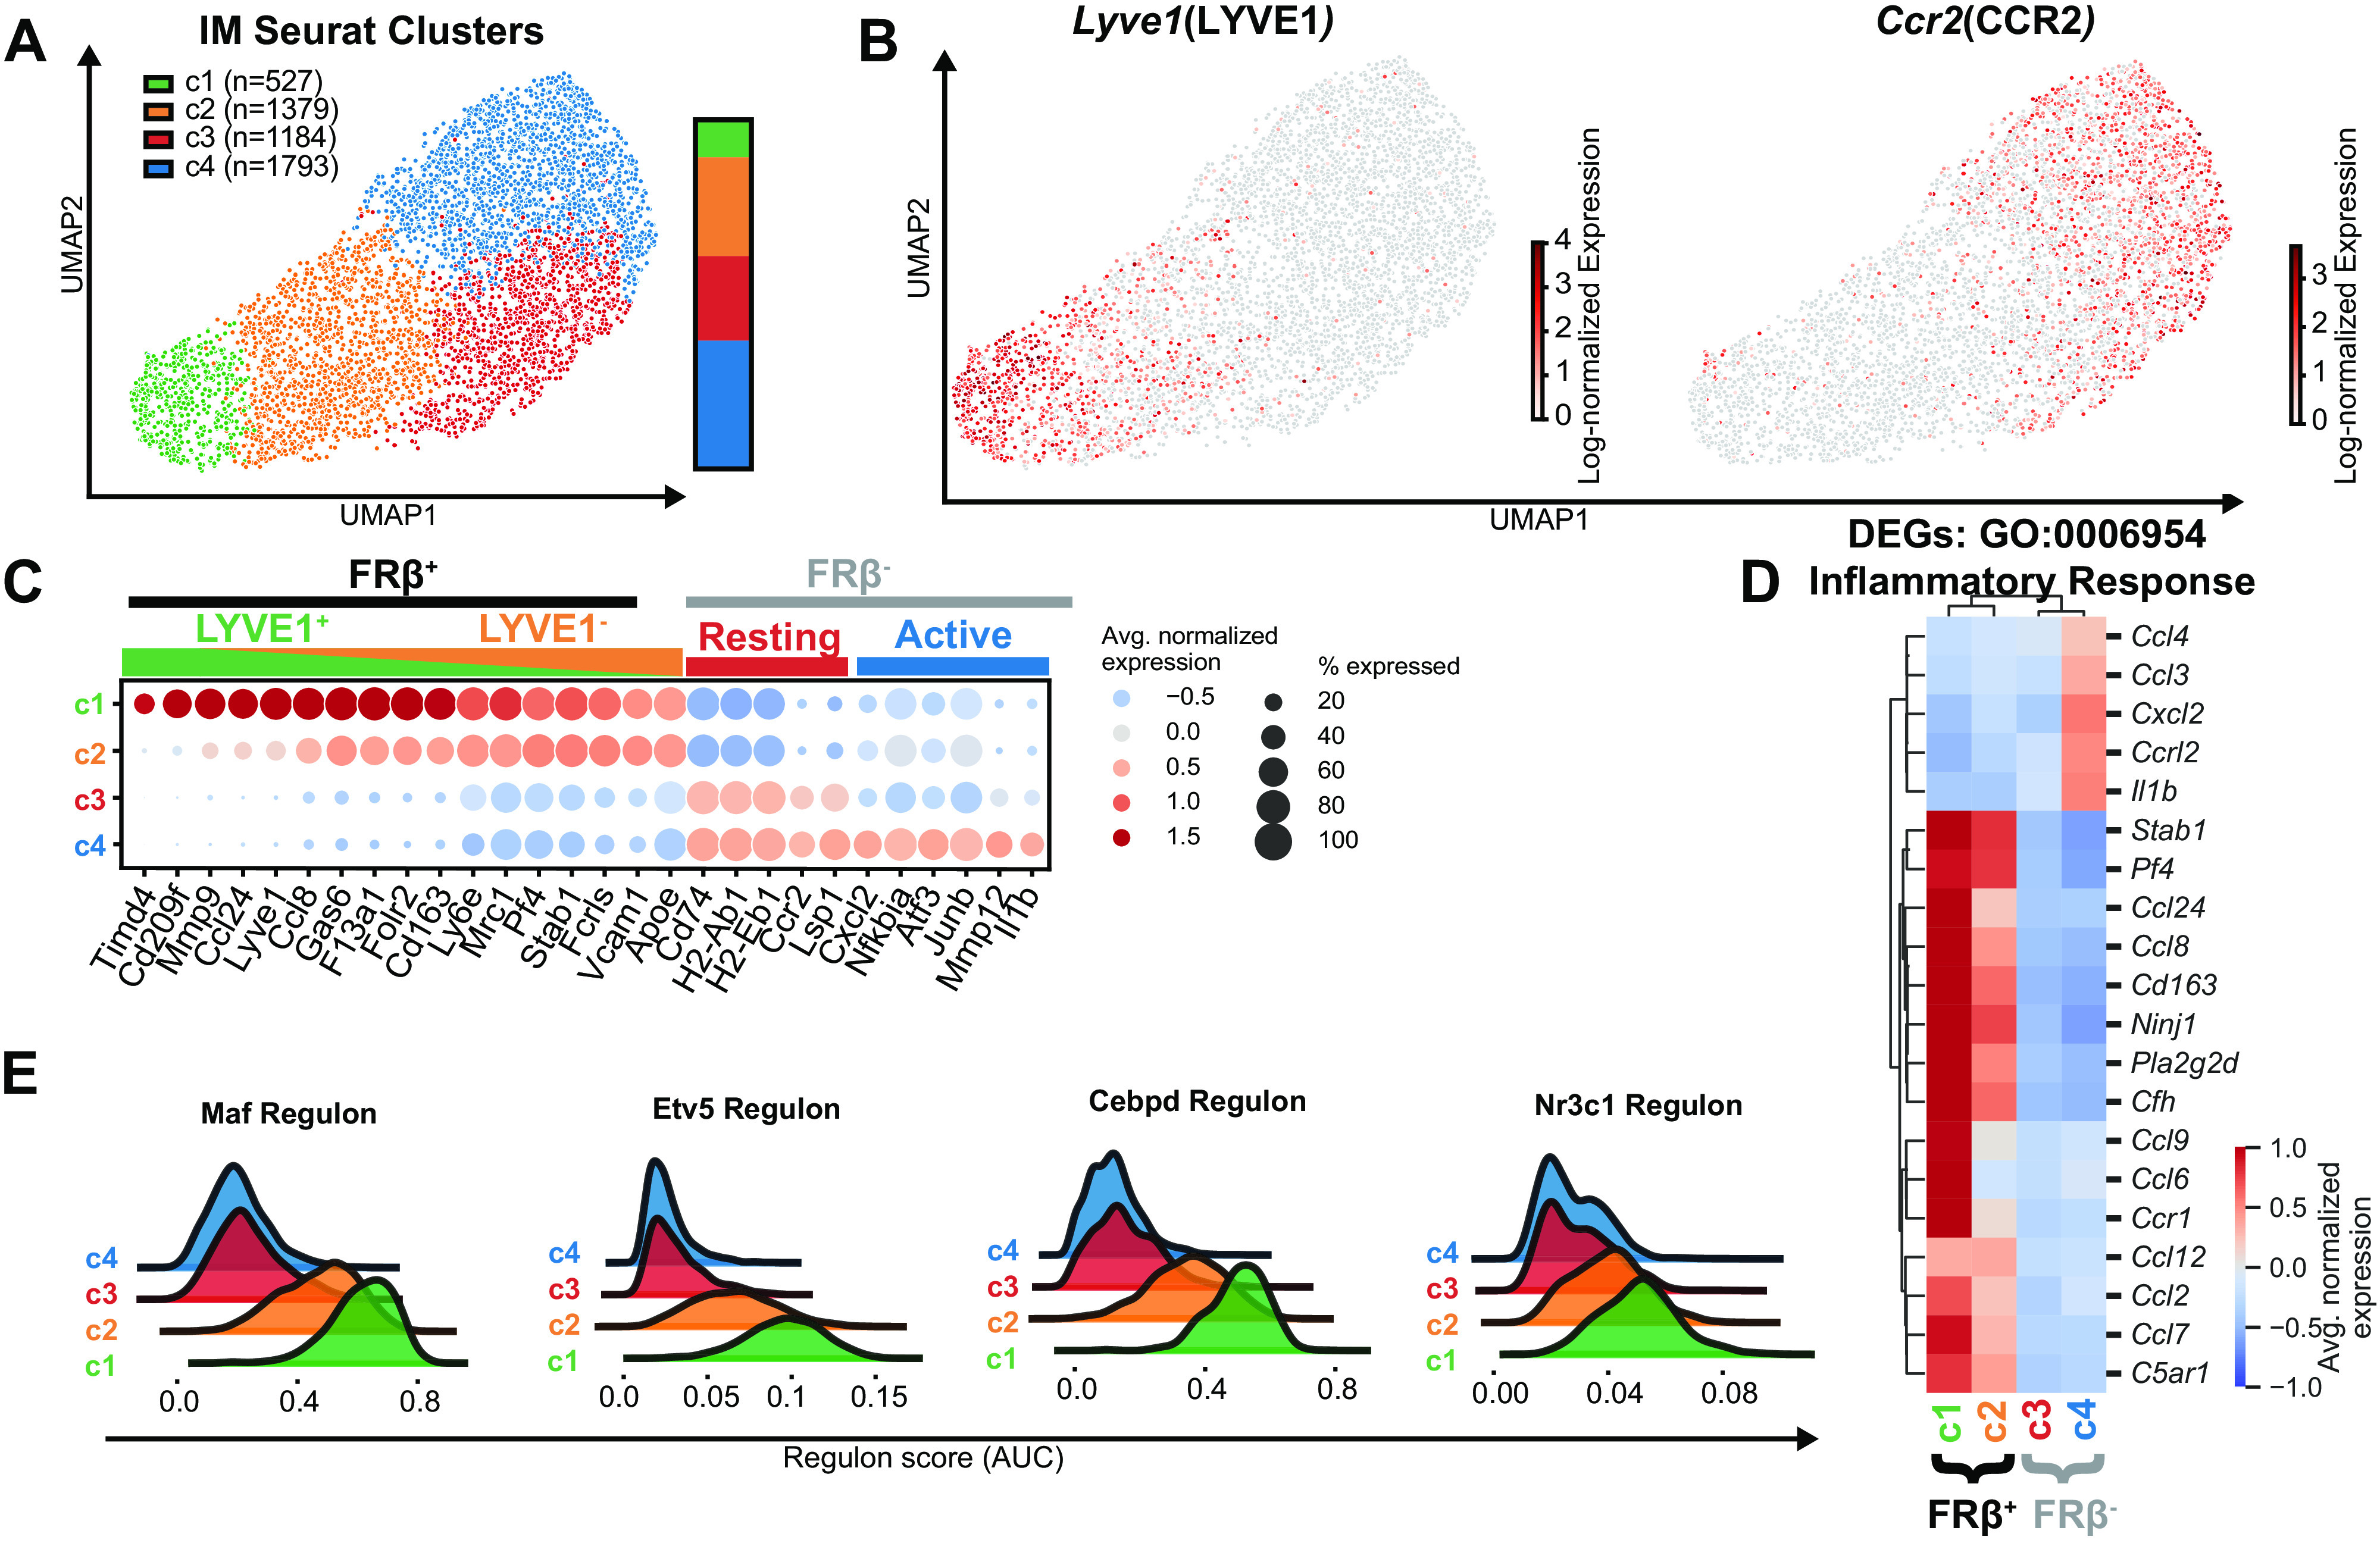
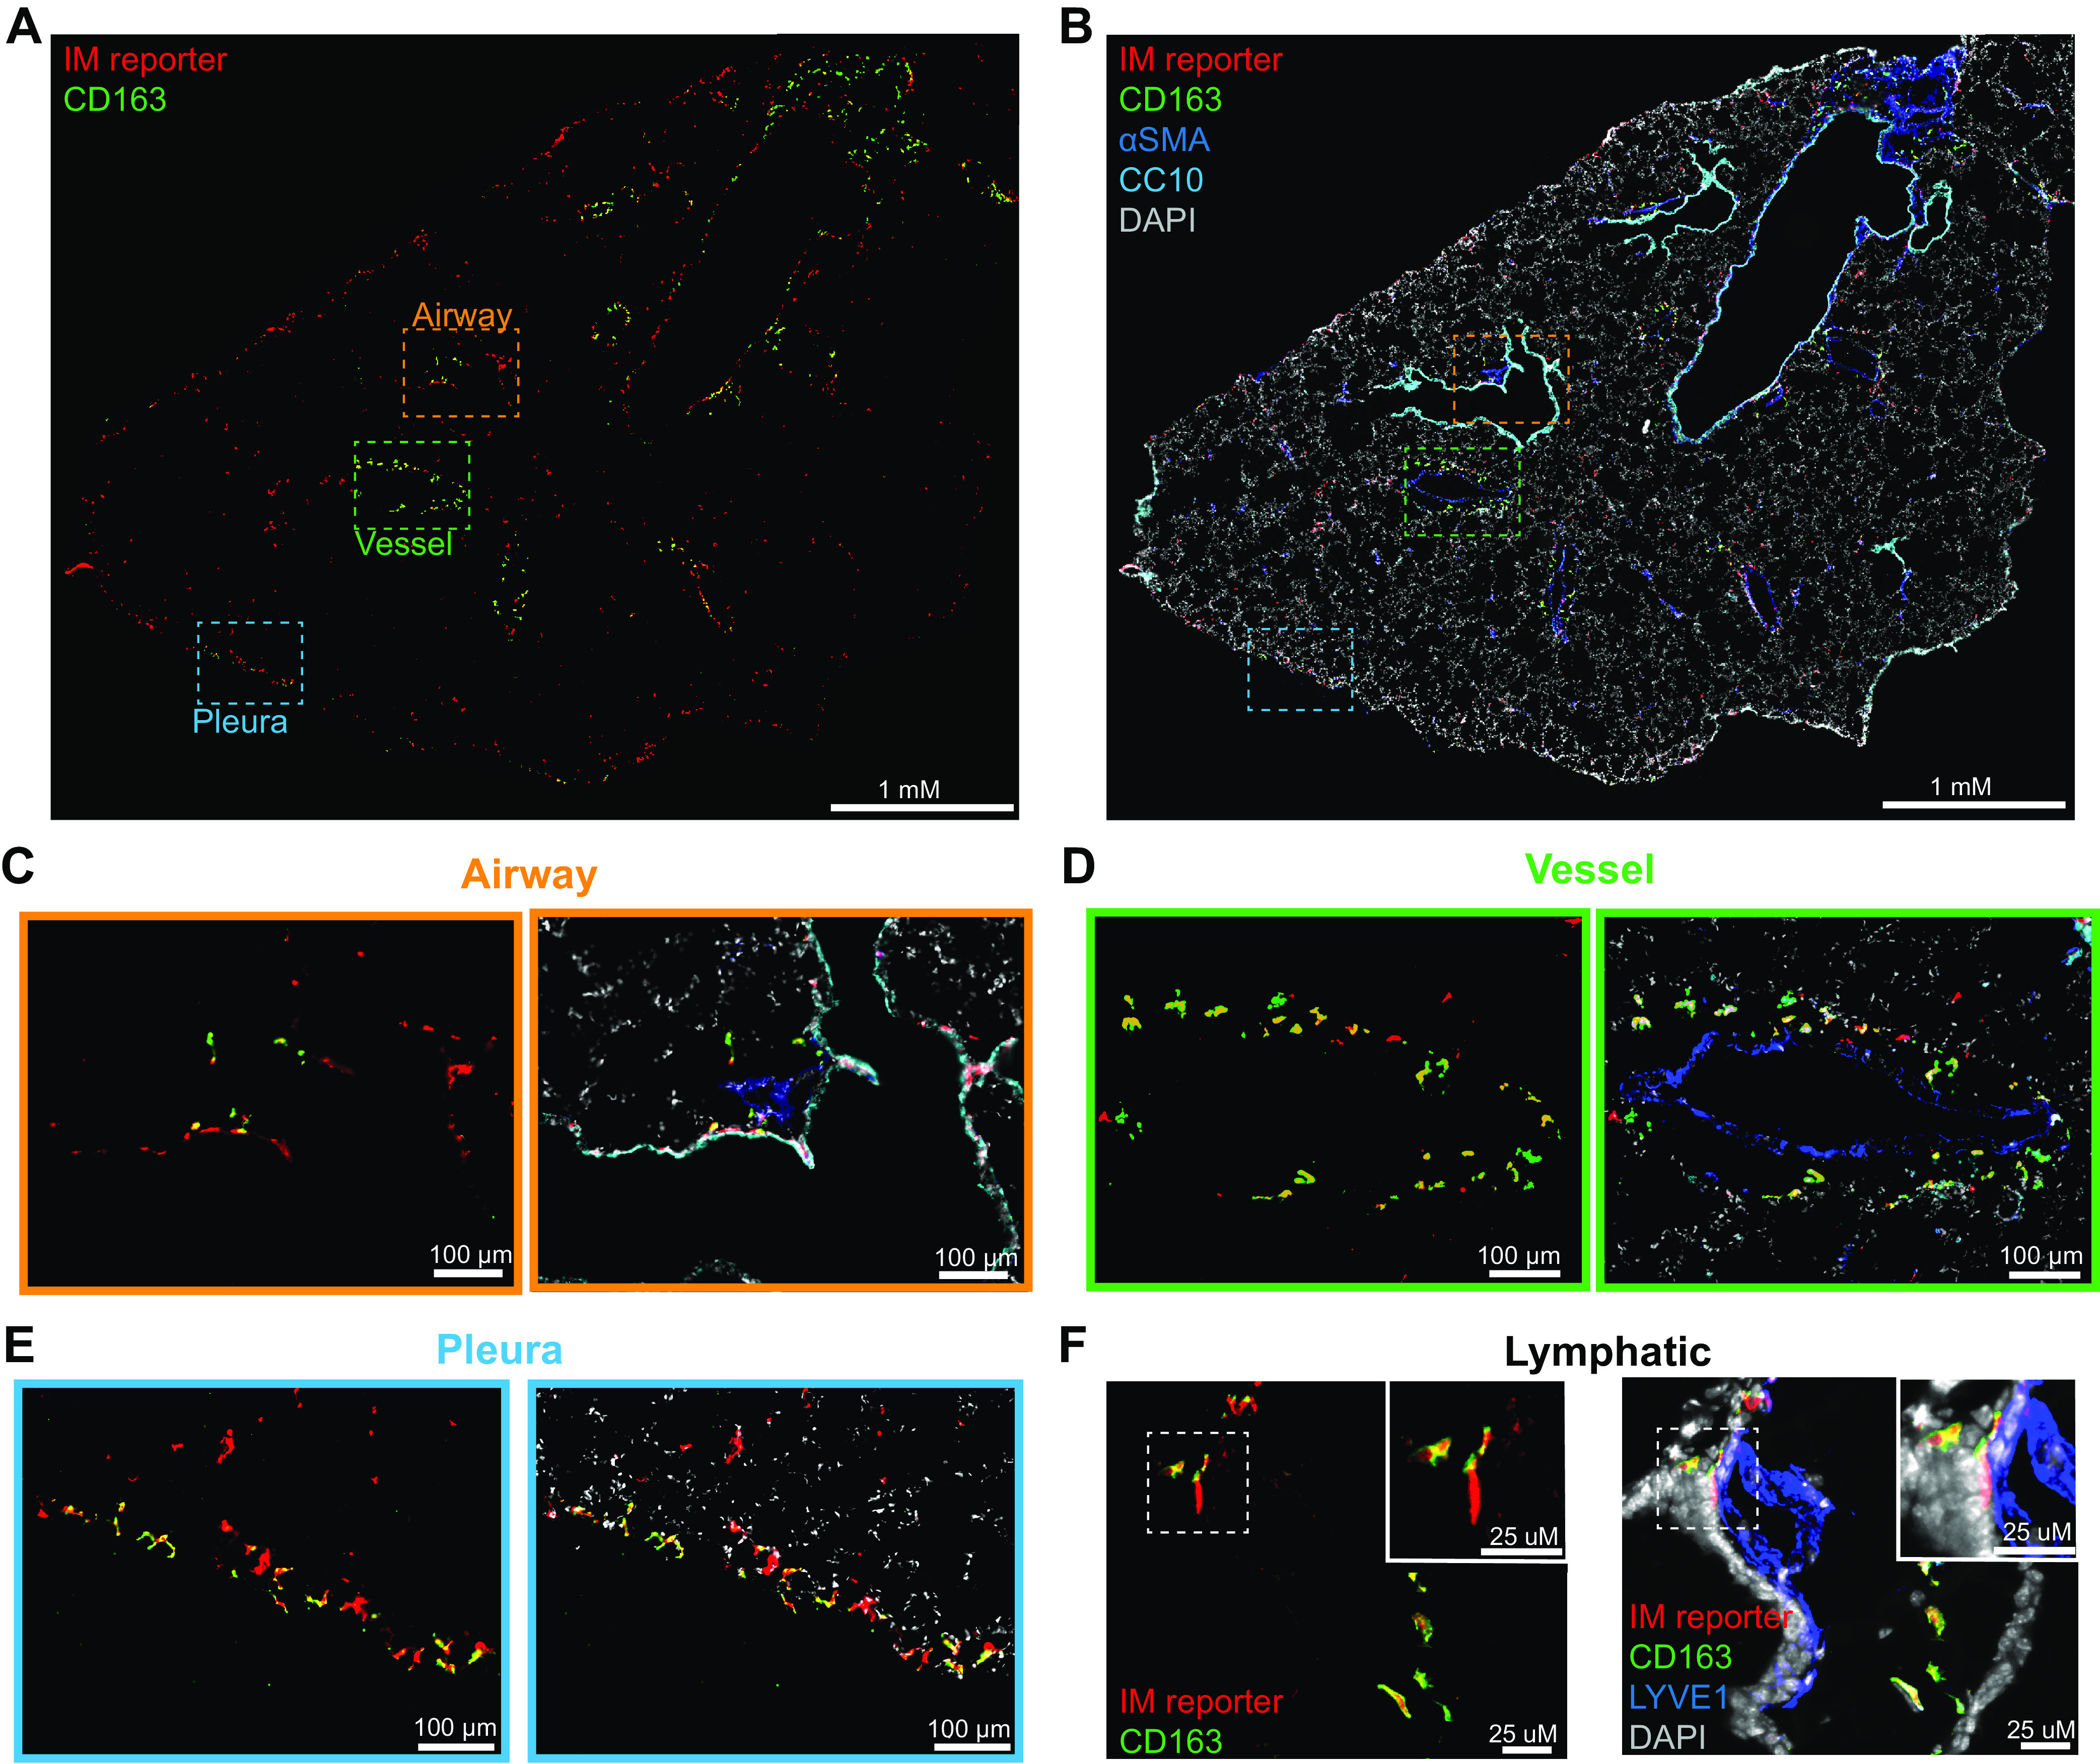
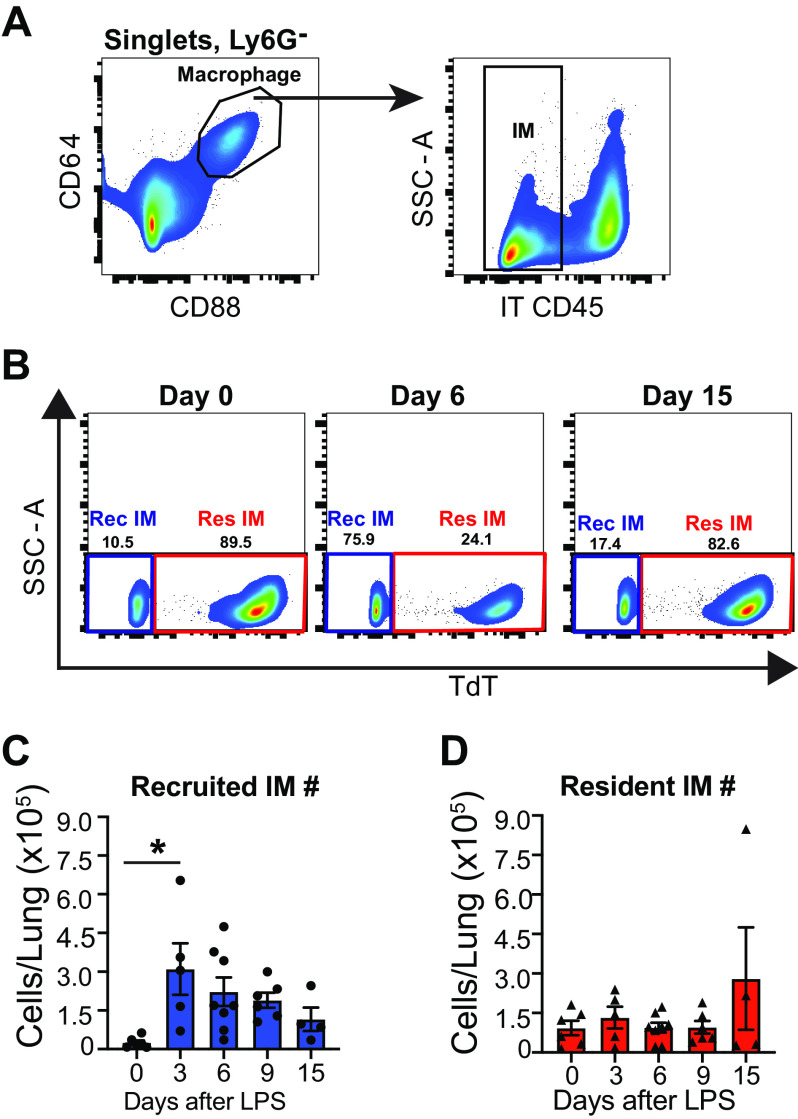
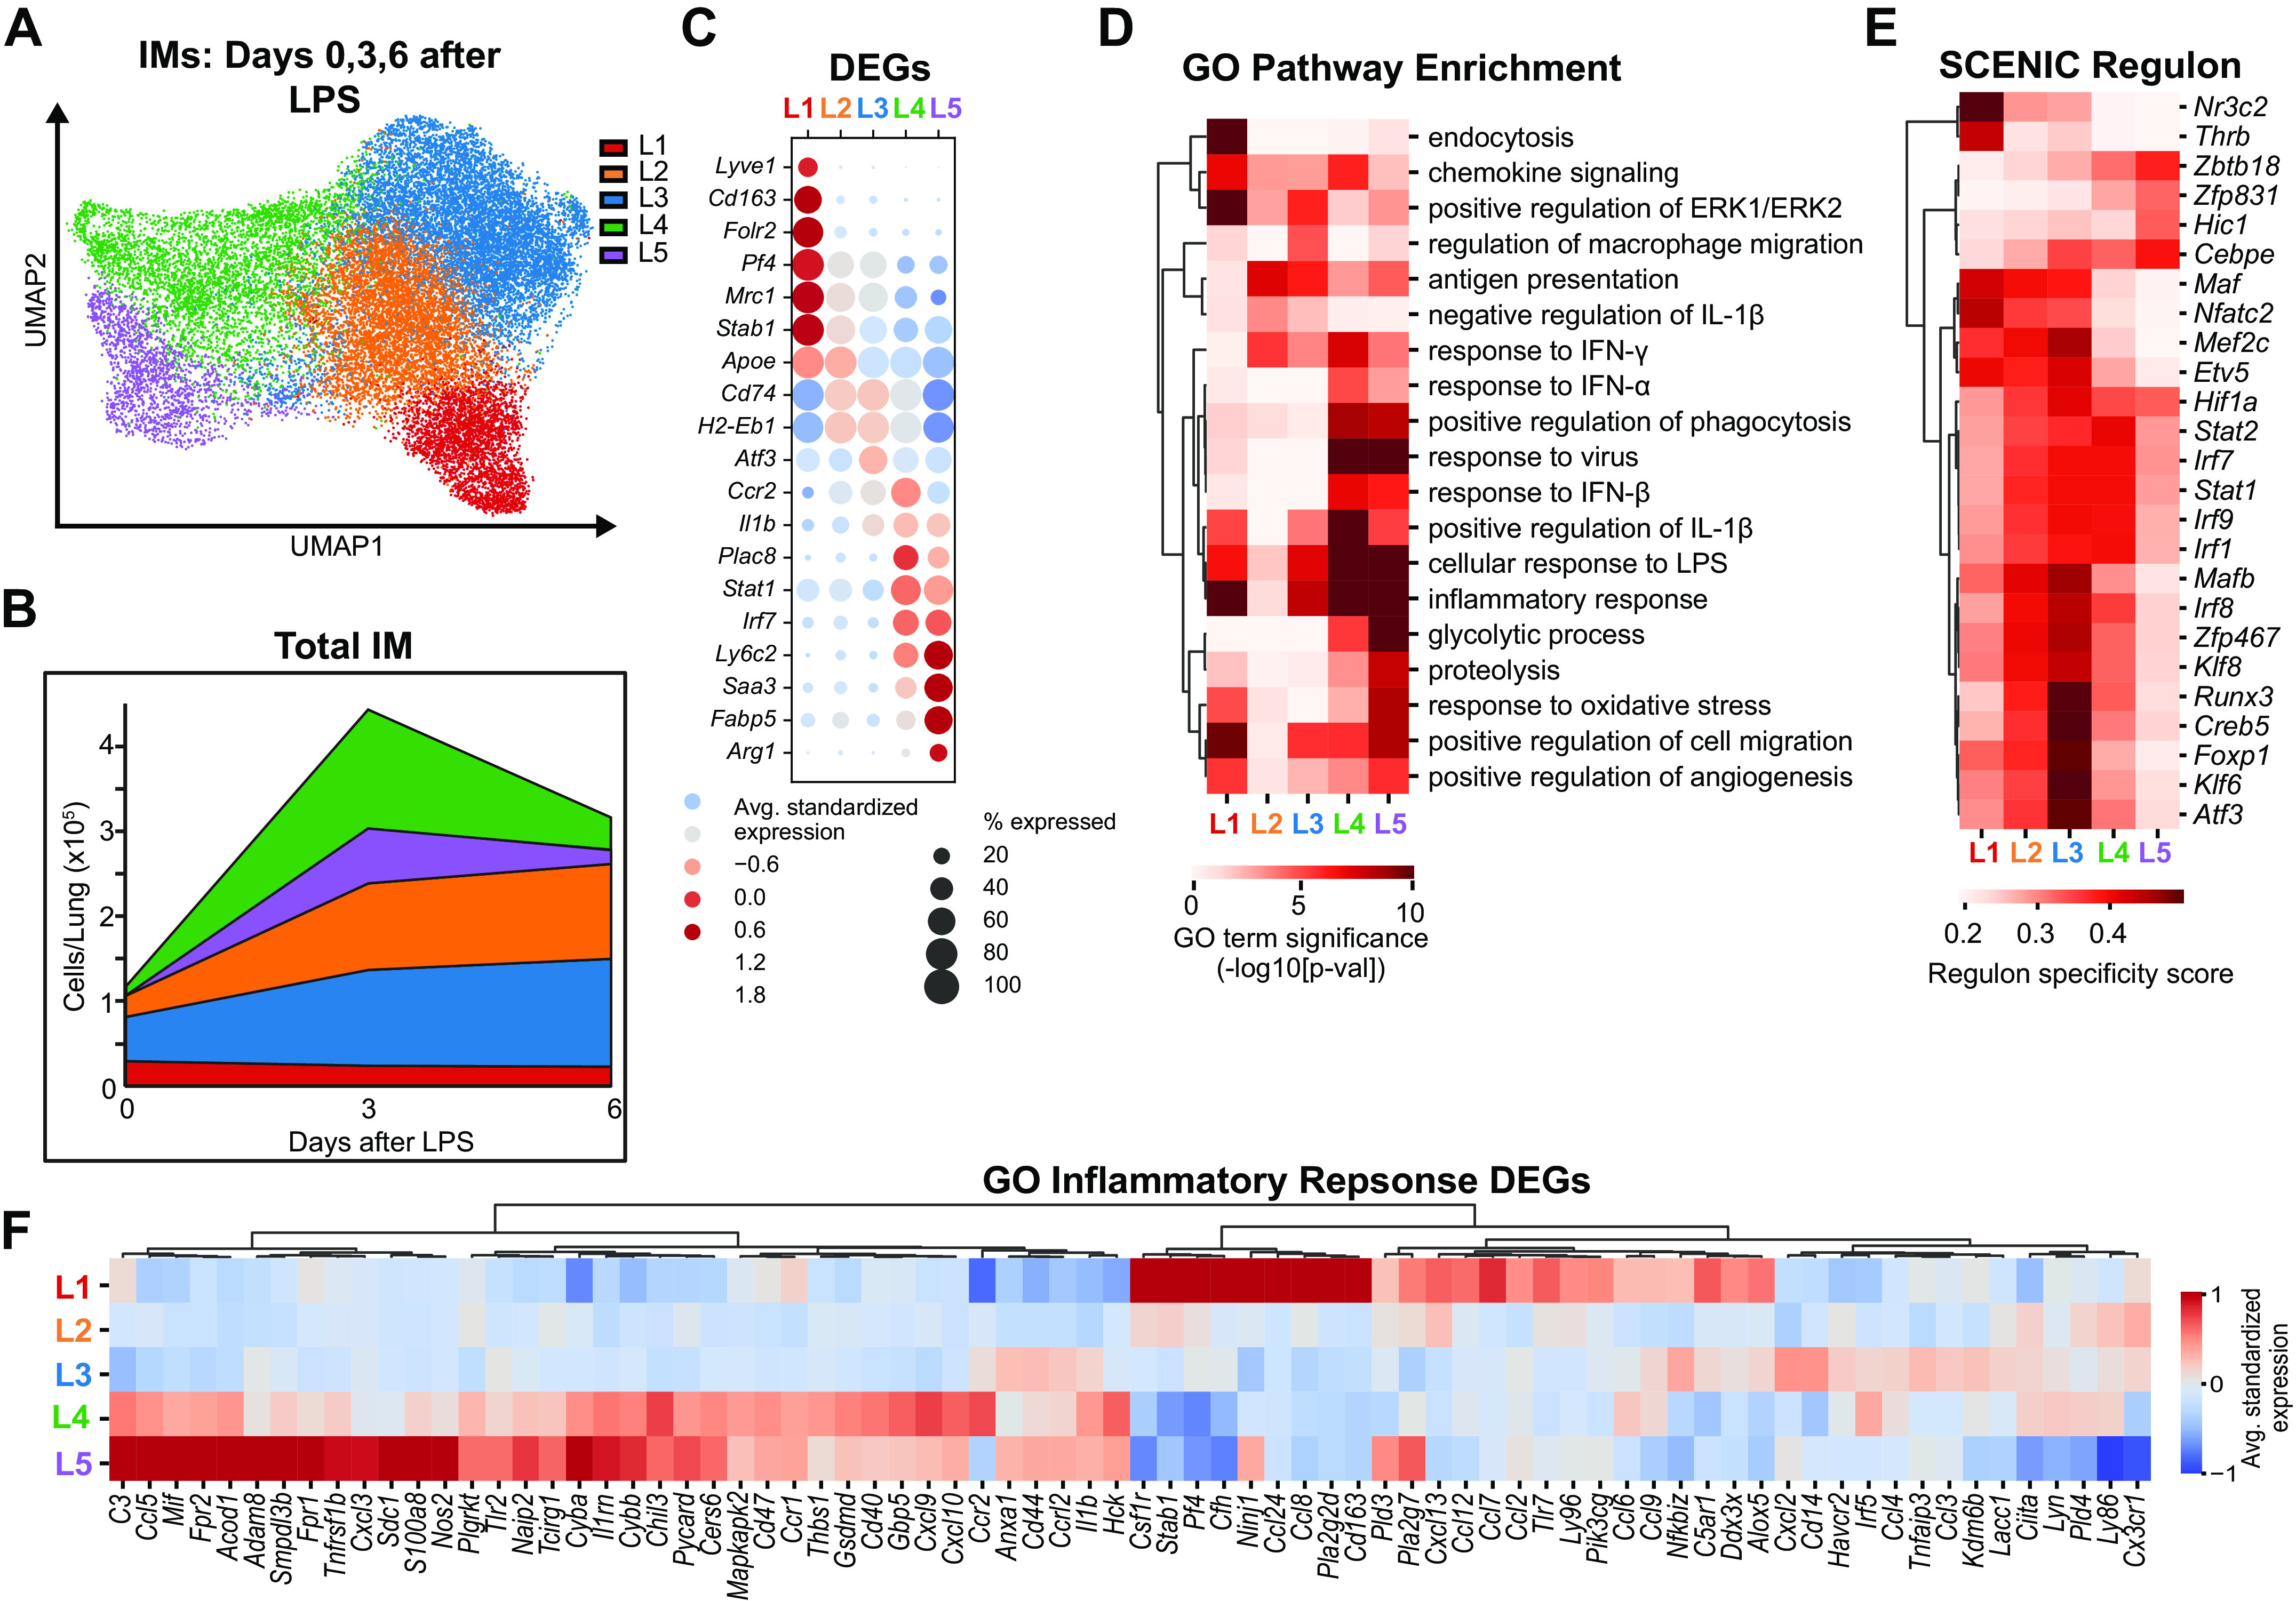
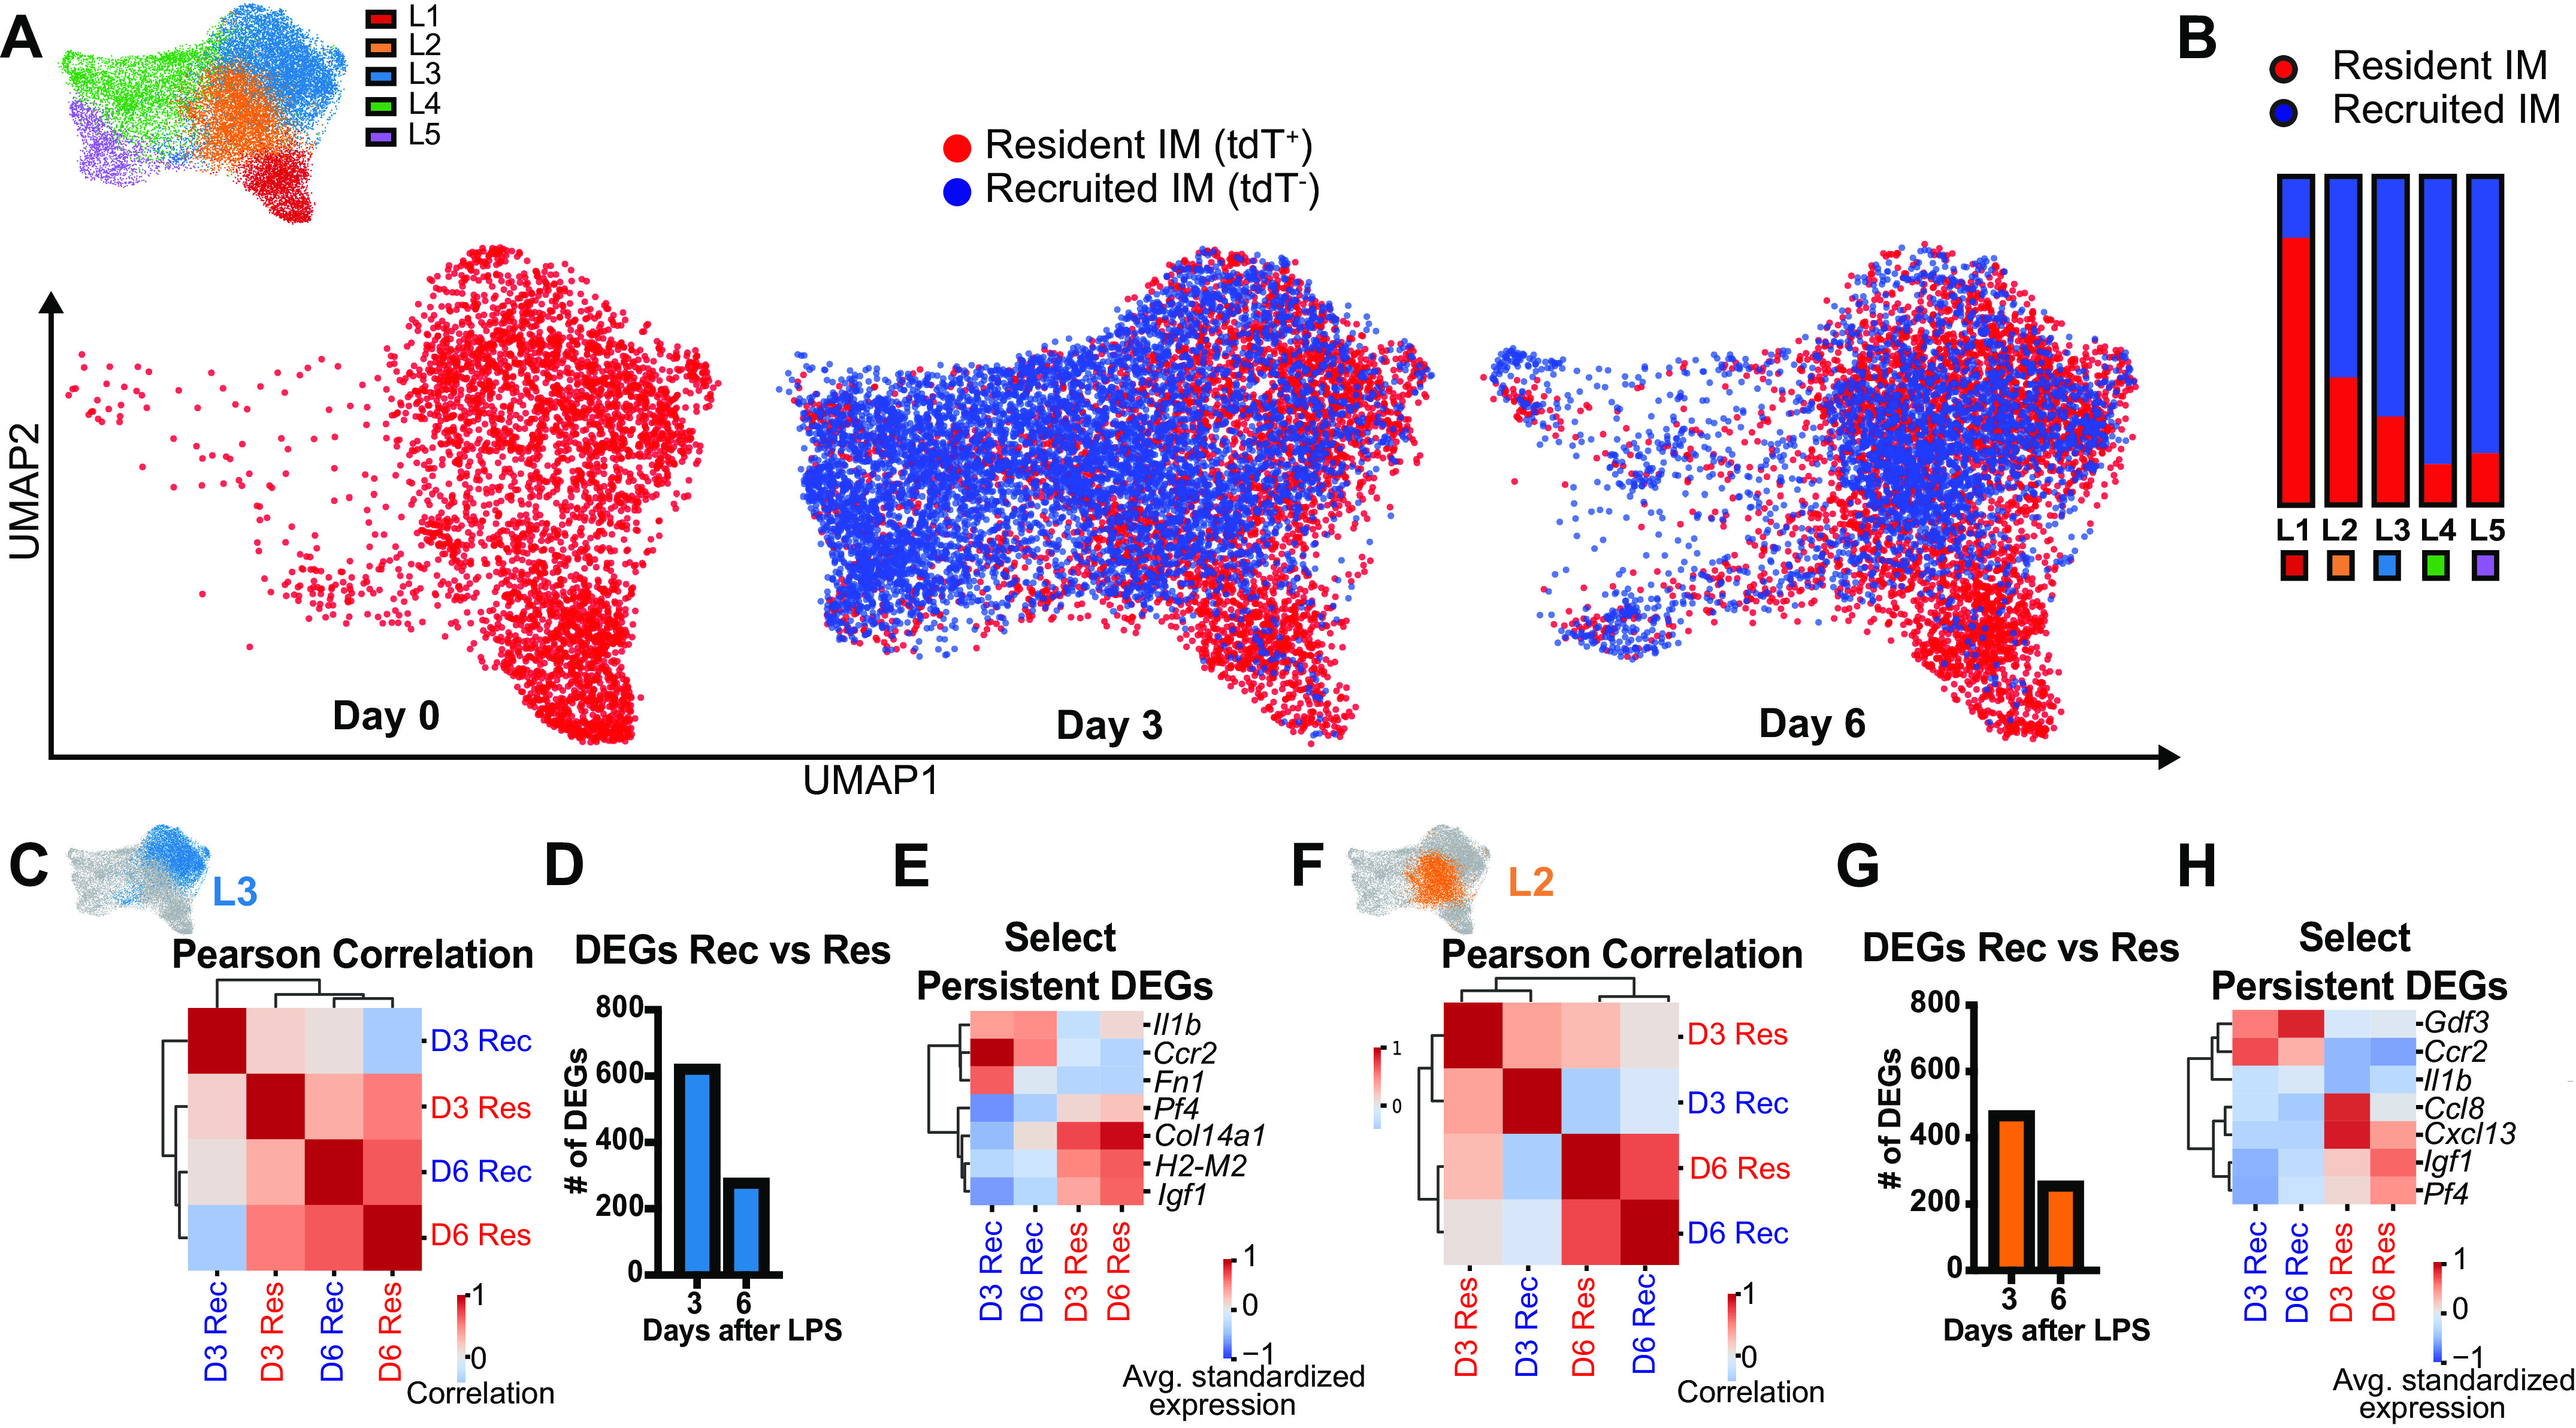
Interstitial macrophages (IMs) reside in the lung tissue surrounding key structures including airways, vessels, and alveoli. Recent work has described IM heterogeneity during homeostasis, however, there are limited data on IMs during inflammation. We sought to characterize IM origin, subsets, and transcriptomic profiles during homeostasis and lipopolysaccharide (LPS) induced acute lung inflammation. During homeostasis, we used three complementary methods, spectral flow cytometry, single-cell RNA-sequencing, and gene regulatory network enrichment, to demonstrate that IMs can be divided into two core subsets distinguished by surface and transcriptional expression of folate receptor β (Folr2/FRβ). These subsets inhabited distinct niches within the lung interstitium. Within FRβ+ IMs we identified a subpopulation marked by coexpression of LYVE1. During acute LPS-induced inflammation, lung IM numbers expand. Lineage tracing revealed IM expansion was due to recruitment of monocyte-derived IMs. At the peak of inflammation, recruited IMs were comprised two unique subsets defined by expression of genes associated with interferon signaling and glycolytic pathways. As recruited IMs matured, they adopted the overall transcriptional state of FRβ- resident IMs but retained expression in several origin-specific genes, such as IL-1β. FRβ+ IMs were of near-pure resident origin. Taken together our data show that during LPS-induced inflammation, there are distinct populations of IMs that likely have unique functions. FRΒ+ IMs comprise a stable, resident population, whereas FRβ- ΙΜs represent a mixed population of resident and recruited IMs.

Keywords: RNA sequencing; acute lung inflammation; interstitial macrophage; macrophage subsets.


Conflict of interest statement

No conflicts of interest, financial or otherwise, are declared by the authors.

Figures

None
Graphical abstract
Figure 1.
Figure 1.
Spectral flow cytometry of murine lung IMs at homeostasis identifies core binary identity defined by FRβ expression. Lung digests from 10-wk-old male mice (n = 4) were assessed by spectral flow cytometry and concatenated for analysis. A: 93,000 IMs underwent dimensional reduction using Uniform Manifold Approximation and Projection (UMAP) of eight macrophage markers. B: fluorescence intensity heatmaps of individual surface markers overlaid on UMAP plot. C: gating strategy to identify FRβ+ and FRβ IMs, FRβCCR2+ IMs and FRβ+LYVE1+ IMs. D: four populations from C overlaid on UMAP from A. E: proportions of total IMs for each subpopulation identified in C. FRβ, folate receptor β; IM, interstitial macrophage.
Figure 2.
Figure 2.
Single-cell RNA-sequencing of murine lung IMs at homeostasis identifies core binary identity defined by Folr2 expression. In anticipation of sequencing IMs during inflammation, A: sequencing was performed on three resident IM lineage tracing male mice (n = 3). CD45+ cells, tdΤ+ IMs, and tdT IMs were sorted from lung digestates from individual mice, sequenced in parallel, and reintegrated for data analysis. Data from all mice were pooled before clustering and expression analysis. B: UMAP projection of Seurat clustering of all IMs demonstrated two core IM clusters. C: feature plot of Folr2 expression. D: dot plot of highly differentially expressed genes between C1 and C2. X-axis depicts genes and the Y-axis refers to clusters from B. E: dot plot of gene expression in C1 vs. C2 of previously described IM surface markers. F: heatmap of functional enrichment analysis of Gene Ontology (GO) terms comparing C1 vs. C2. G: comparison of primary clusters identified by SCENIC vs. Seurat clustering, with SCENIC clusters overlaid on Seurat UMAP. H: heatmap of top five regulons defining each SCENIC cluster. Avg, average; FACS, fluorescence-activated cell sorting; FRβ, folate receptor β; IM, interstitial macrophage; IT, intratracheal; RSS, regulon specificity score; SCENIC, single-cell regulatory network inference and clustering; tdT, tdTomato; UMAP, Uniform Manifold Approximation and Projection.
Figure 3.
Figure 3.
Reclustering murine lung IMs during homeostasis with increased resolution identifies additional IM clusters within FRβ+ and FRβ subsets. A: four IM subsets identified by clustering with increased resolution. B: feature plot of Lyve1 and Ccr2 expression. C: dot plot of highly differentially expressed genes between the four clusters. D: heatmap of top differentially expressed genes within Gene Ontology (GO) 00069543 Inflammatory Response pathway. E: overlapping histograms of selected SCENIC regulons that define clusters c1 and c2. AUC, area under the curve; Avg, average; DEGs, differentially expressed genes; FRβ, folate receptor β; SCENIC, single-cell regulatory network inference and clustering; UMAP, Uniform Manifold Approximation and Projection.
Figure 4.
Figure 4.
CD163+ IMs are located near vessels, lymphatics, and pleura. CD163 IMs are adjacent to airways, alveoli and pleura. Immunofluorescence microscopy was performed on 10-μm thick frozen sections from male and female pulse-wait resident IM reporter mice (CX3CR1ERT2-Cre x R26Stop(fl/fl)tdTomato) at homeostasis (male mouse shown). CD163 was used to identify FRβ+ IMs. A: whole lobe projection of reporter positive IMs (red) and CD163 (green) imaged at ×20 on scanning microscope from a male mouse. B: airways (CC10/cyan) and vessels (αSMA/blue) and nuclei (DAPI/gray) are highlighted on whole lobe projection. Zoomed projection of IMs near an airway (C), a vessel (D), and the pleura (E). F: maximal intensity projection of 1 μM thick images of CD163 (green) IMs (red) and lymphatics (LYVE1/blue) using confocal microscopy. αSMA, α-smooth muscle actin; CC10, Clara Cell 10 kDa Protein; DAPI, 4′,6-diamidino-2-phenylindole; FRβ, folate receptor β; IM, interstitial macrophage.
Figure 5.
Figure 5.
Quantification of murine IMs after intratracheal lipopolysaccharide (LP) shows expansion is driven by recruited IMs. Flow cytometry was performed on male and female resident IM reporter mice (CX3CR1ERT2-Cre x R26Stop(fl/fl)tdTomato “pulse-wait”). A: IMs were identified as IT anti-CD45 macrophages. B: representative gating showing separation of resident and recruited IMs by tdT reporter label in IMs. C: bar graph of recruited monocyte-derived (tdT) IM numbers over time. D: bar graph of resident (tdT+) IM numbers over time. Values shown are means ± SE. Data were analyzed with ANOVA and Tukey’s multiple comparisons test. *P < 0.05. IM, interstitial macrophage; IT, intratracheal; Rec, recruited; Res, resident; tdT, tdTomato.
Figure 6.
Figure 6.
Single-cell RNA-sequencing of lung IMs after intratracheal LPS identifies new clusters. Sequencing was performed on three populations sorted from resident IM lineage tracing male mice at homeostasis (n = 3), 3 (n = 4), and 6 days (n = 3) after LPS, using the scheme outlined in Fig. 2A A: UMAP plot of Seurat clustering of IMs demonstrates five IM clusters. B: total IMs per cluster were calculated by multiplying each cluster proportion by the mean cell count from flow cytometry experiments in Fig. 4, B and C. C: dot plot of highly differentially expressed genes defining each cluster. D: heat map of differential pathway enrichment analysis between the five clusters. E: heat map of differential activity of defining regulons identified by SCENIC analysis between the five clusters. F: differential genes in Gene Ontology (GO) 00069543 Inflammatory Response pathway highlights differences in inflammatory related transcripts between the clusters. DEG, differential expressed gene; IM, interstitial macrophage; LPS, lipopolysaccharide; SCENIC, single-cell regulatory network inference and clustering; UMAP, Uniform Manifold Approximation and Projection.
Figure 7.
Figure 7.
Time and cell origin determine IM clustering after LPS-induced lung inflammation. A: UMAP plot of IMs showing resident vs. recruited origin at each time point. B: proportion of resident vs. recruited IMs by cluster. C and D: within cluster L3, increasing correlation between recruited and resident IMs over time by Pearson’s correlation (C), and number of significant DEGs (D). E: select DEGs in cluster L3 that remain segregated by cell origin at day 6. F and G: within cluster L2, increasing correlation between recruited and resident IMs over time by Pearson’s correlation (F), and number of significant DEGs (G). H: select DEGs in cluster L2 that remain segregated by cell origin at day 6. DEG, differential expressed gene; IM, interstitial macrophage; LPS, lipopolysaccharide; UMAP, Uniform Manifold Approximation and Projection.

References

    1. Ginhoux F, Jung S. Monocytes and macrophages: developmental pathways and tissue homeostasis. Nat Rev Immunol 14: 392–404, 2014. doi:10.1038/nri3671. - DOI - PubMed
    1. Schyns J, Bai Q, Ruscitti C, Radermecker C, De Schepper S, Chakarov S, Farnir F, Pirottin D, Ginhoux F, Boeckxstaens G, Bureau F, Marichal T. Non-classical tissue monocytes and two functionally distinct populations of interstitial macrophages populate the mouse lung. Nat Commun 10, 2019. doi:10.1038/s41467-019-11843-0. - DOI - PMC - PubMed
    1. Janssen WJ, Barthel L, Muldrow A, Oberley-Deegan RE, Kearns MT, Jakubzick C, Henson PM. Fas determines differential fates of resident and recruited macrophages during resolution of acute lung injury. Am J Respir Crit Care Med 184: 547–560, 2011. doi:10.1164/rccm.201011-1891OC. - DOI - PMC - PubMed
    1. Sabatel C, Radermecker C, Fievez L, Paulissen G, Chakarov S, Fernandes C, Olivier S, Toussaint M, Pirottin D, Xiao X, Quatresooz P, Sirard J-C, Cataldo D, Gillet L, Bouabe H, Desmet CJ, Ginhoux F, Marichal T, Bureau F. Exposure to bacterial CpG DNA protects from airway allergic inflammation by expanding regulatory lung interstitial macrophages. Immunity 46: 457–473, 2017. doi:10.1016/j.immuni.2017.02.016. - DOI - PubMed
    1. Mould KJ, Jackson ND, Henson PM, Seibold M, Janssen WJ. Single cell RNA sequencing identifies unique inflammatory airspace macrophage subsets. JCI Insight 4: 126556, 2019. doi:10.1172/jci.insight.126556. - DOI - PMC - PubMed

Publication types