

Alterations in the Gut Microbiota in Pregnant Women with Pregestational Type 2 Diabetes Mellitus
- PMID: 36853013
- PMCID: PMC10134876
- DOI: 10.1128/msystems.01146-22
Alterations in the Gut Microbiota in Pregnant Women with Pregestational Type 2 Diabetes Mellitus
Abstract
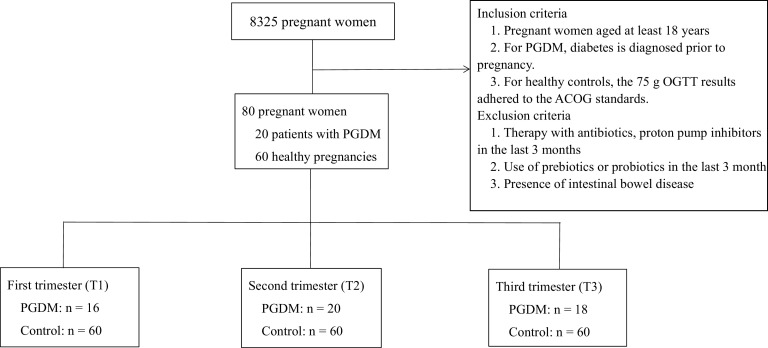
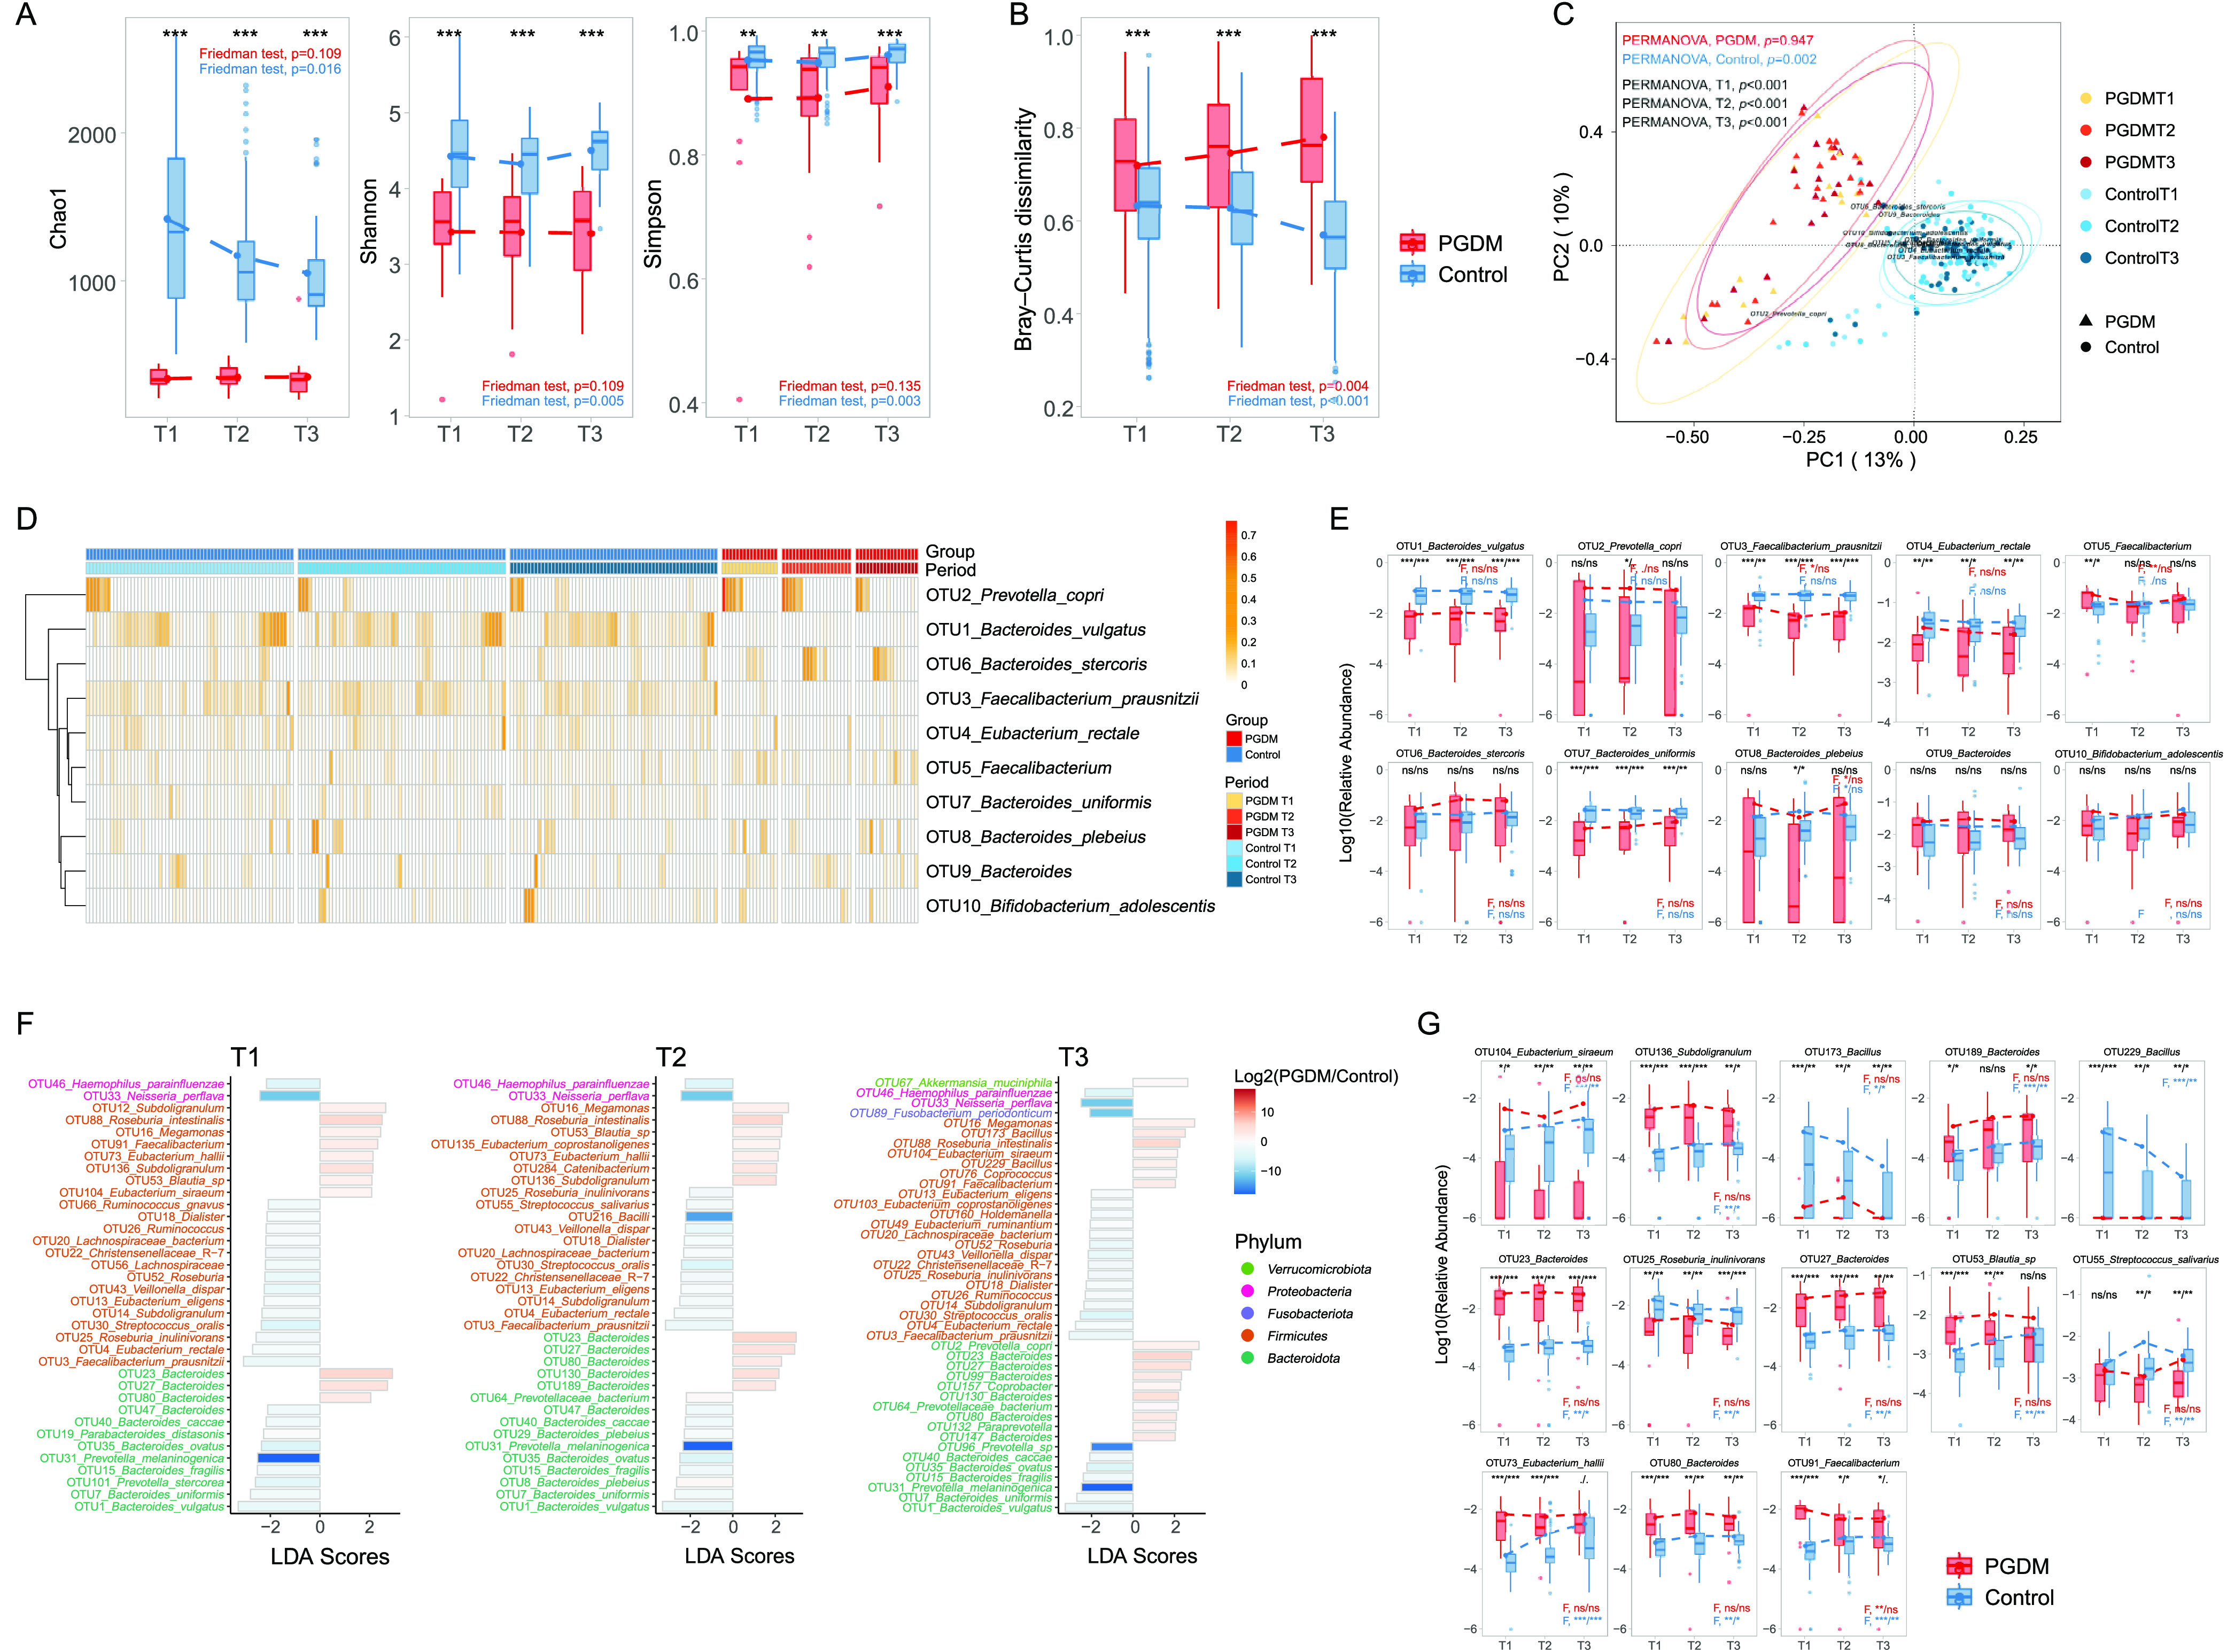
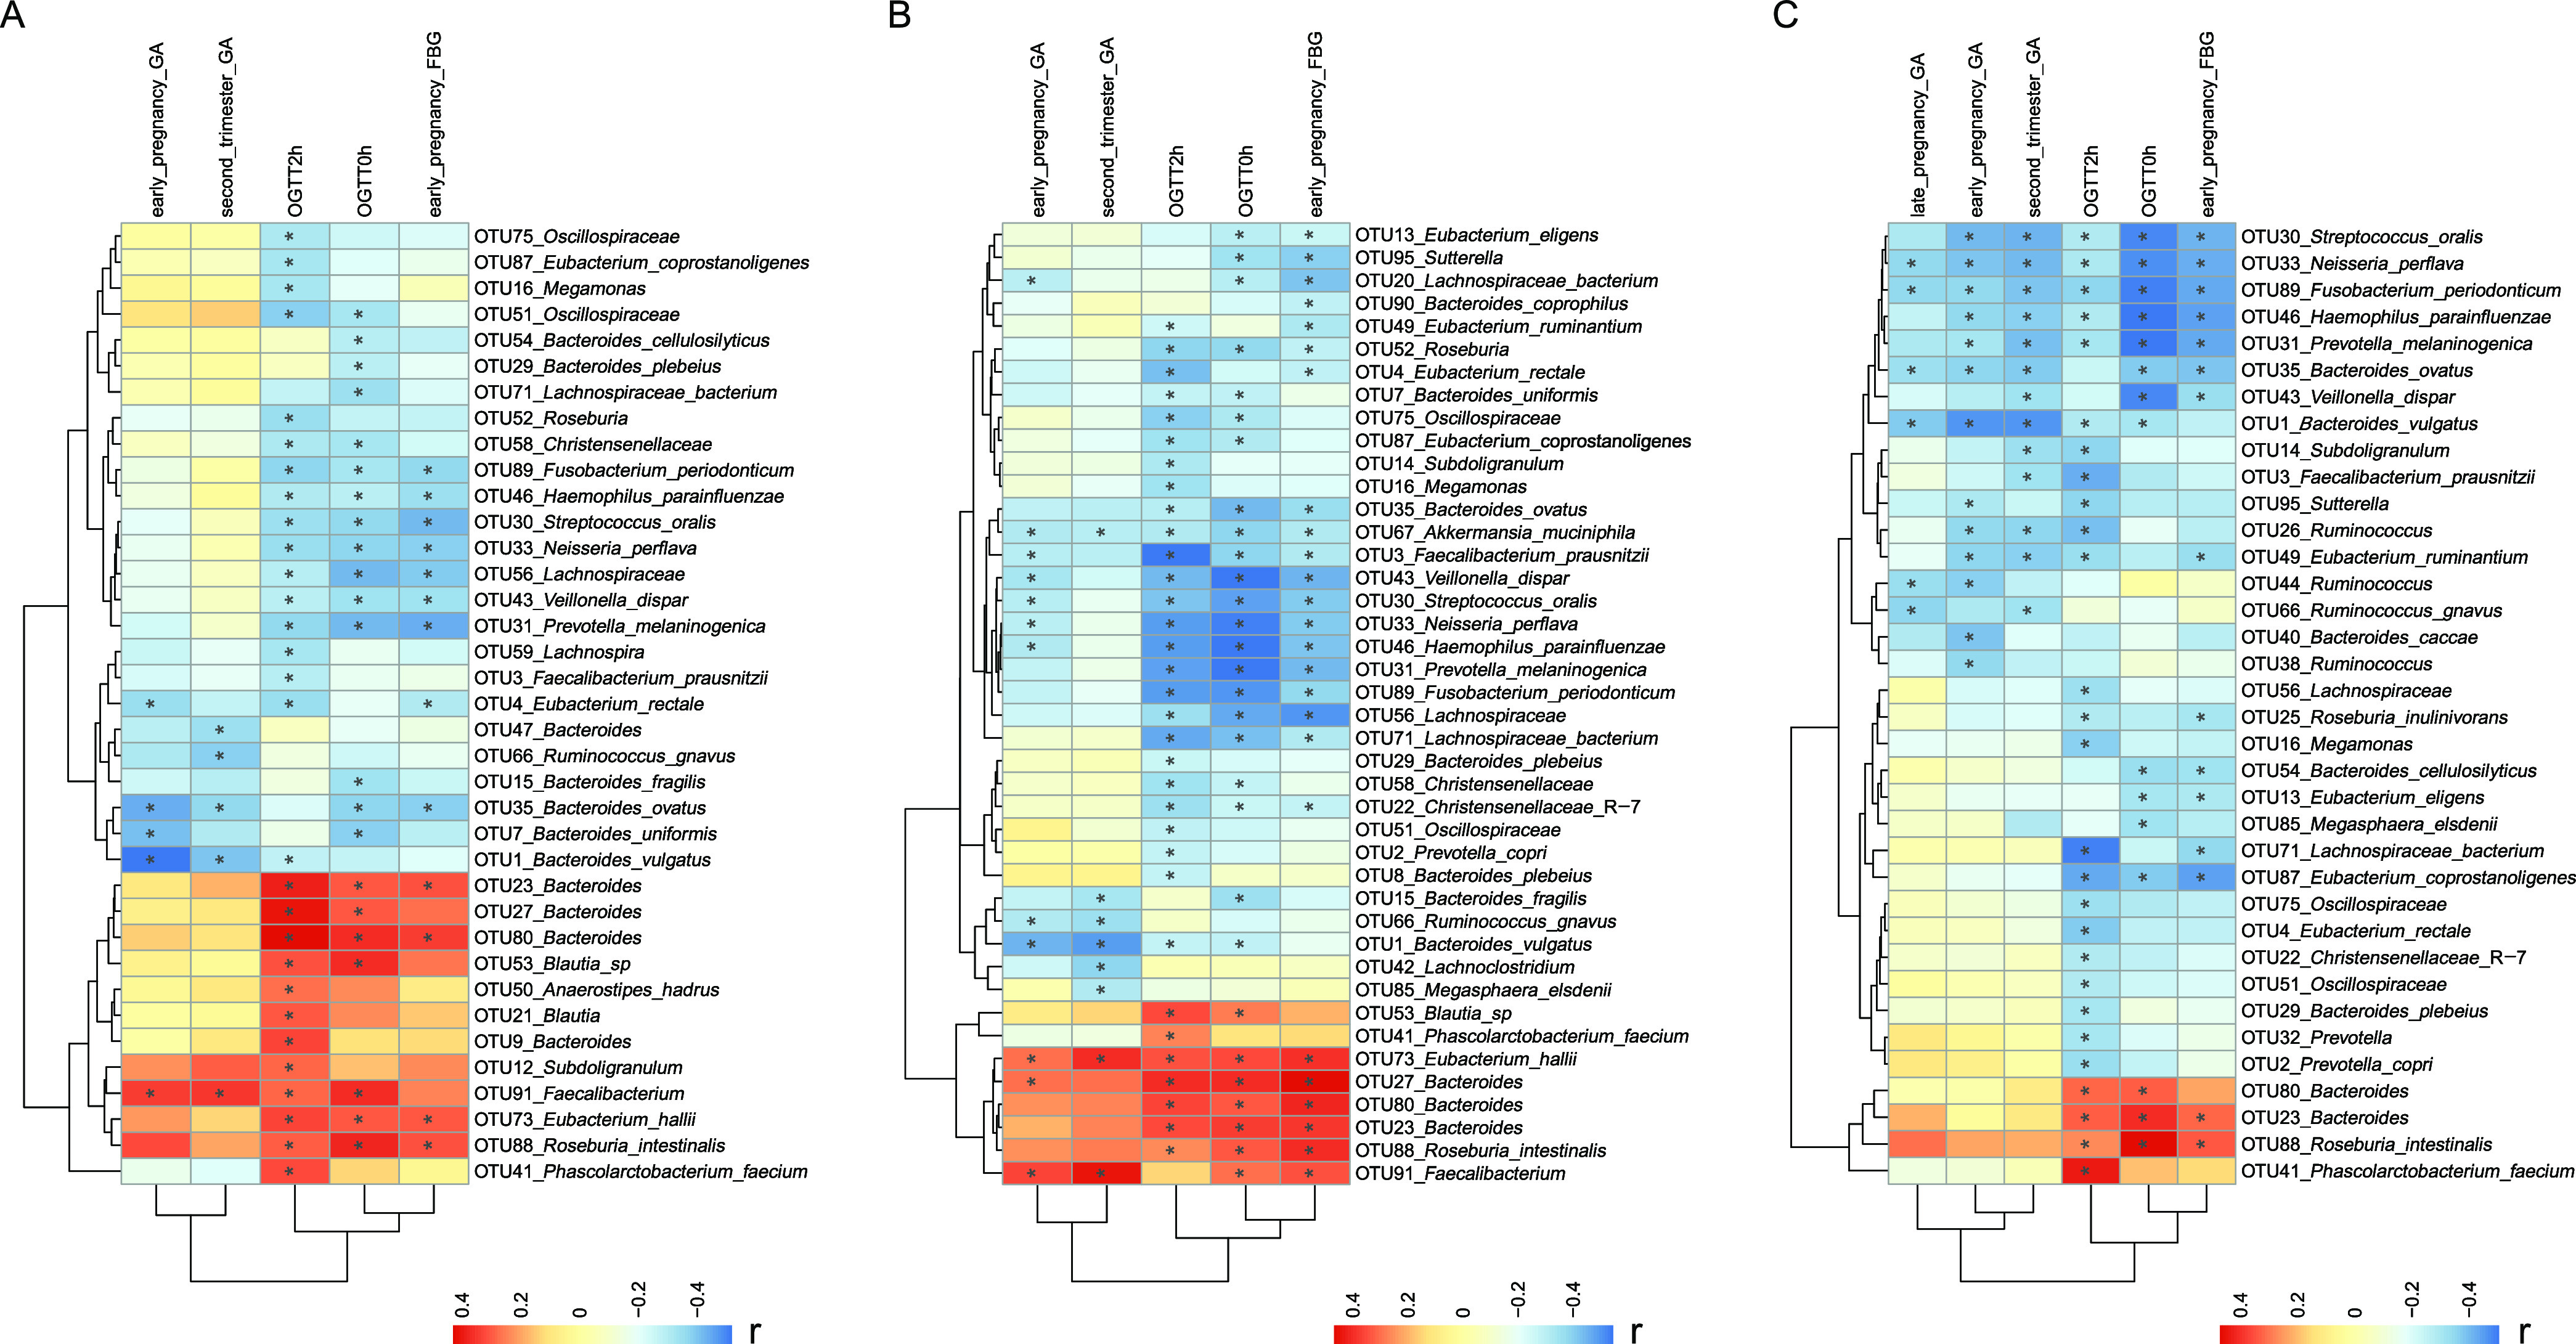
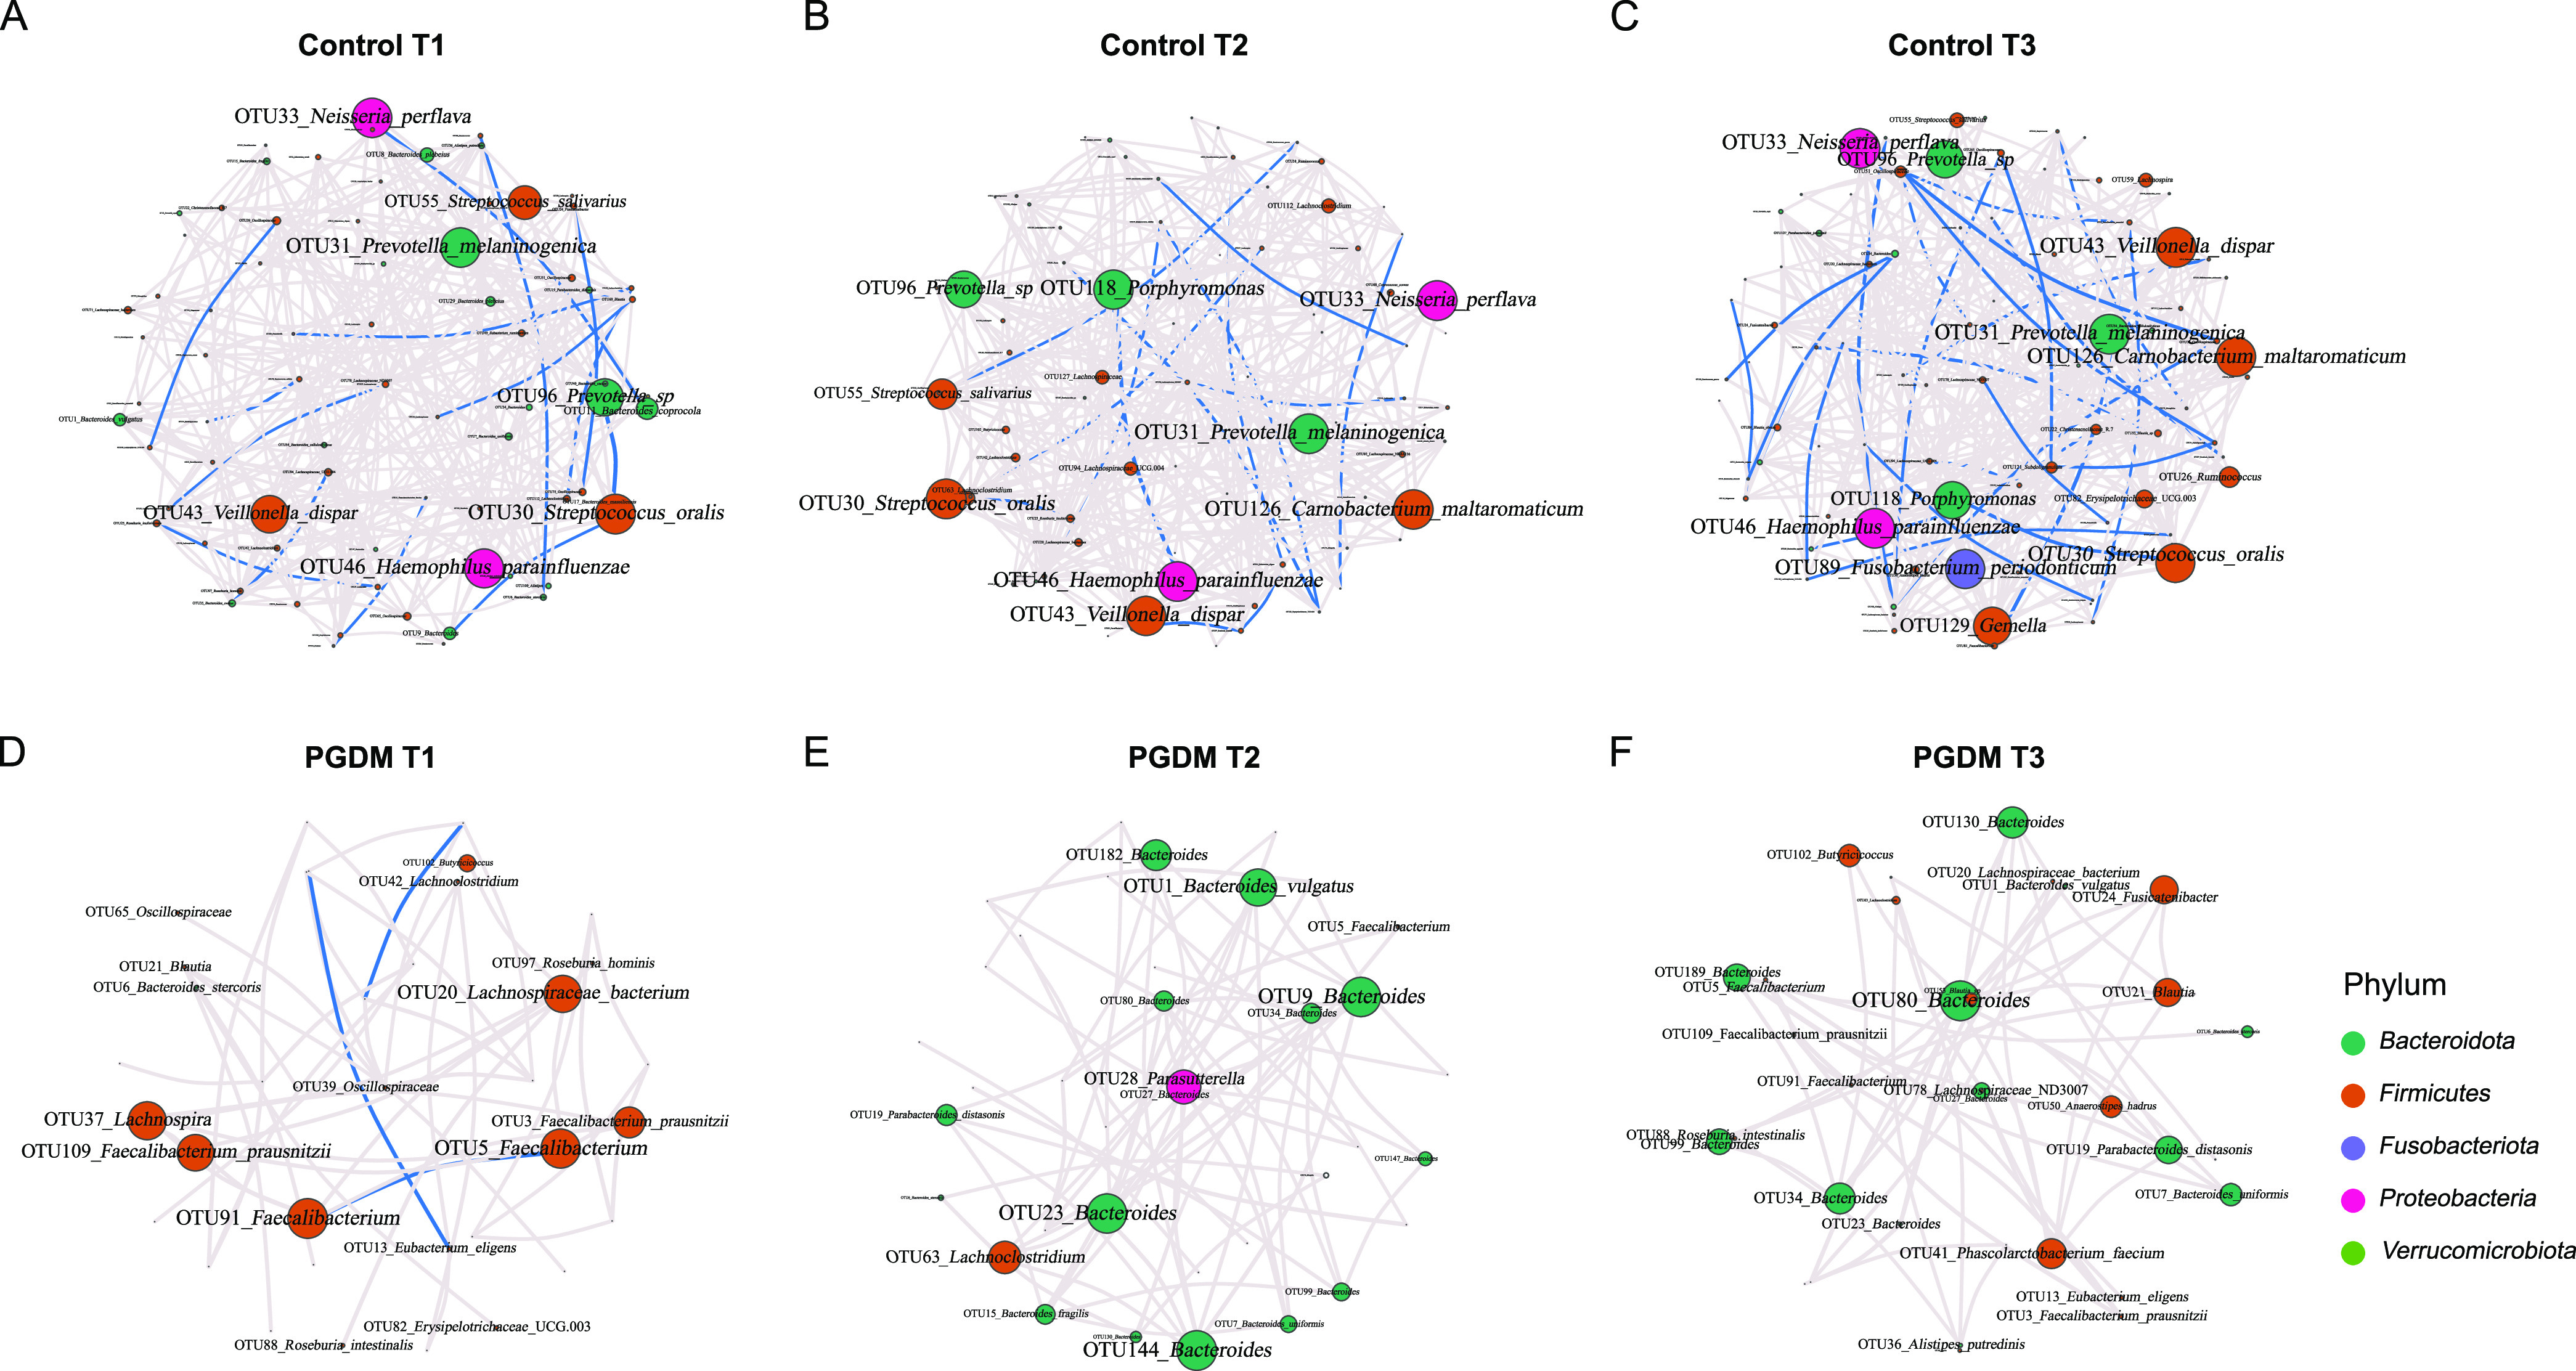
Human gut dysbiosis is associated with type 2 diabetes mellitus (T2DM); however, the gut microbiome in pregnant women with pregestational type 2 diabetes mellitus (PGDM) remains unexplored. We investigated the alterations in the gut microbiota composition in pregnant women with or without PGDM. The gut microbiota was examined using 16S rRNA sequencing data of 234 maternal fecal samples that were collected during the first (T1), second (T2), and third (T3) trimesters. The PGDM group presented a reduction in the number of gut bacteria taxonomies as the pregnancies progressed. Linear discriminant analyses revealed that Megamonas, Bacteroides, and Roseburia intestinalis were enriched in the PGDM group, whereas Bacteroides vulgatus, Faecalibacterium prausnitzii, Eubacterium rectale, Bacteroides uniformis, Eubacterium eligens, Subdoligranulum, Bacteroides fragilis, Dialister, Lachnospiraceae, Christensenellaceae R-7, Roseburia inulinivorans, Streptococcus oralis, Prevotella melaninogenica, Neisseria perflava, Bacteroides ovatus, Bacteroides caccae, Veillonella dispar, and Haemophilus parainfluenzae were overrepresented in the control group. Correlation analyses showed that the PGDM-enriched taxa were correlated with higher blood glucose levels during pregnancy, whereas the taxonomic biomarkers of normoglycemic pregnancies exhibited negative correlations with glycemic traits. The microbial networks in the PGDM group comprised weaker microbial interactions than those in the control group. Our study reveals the distinct characteristics of the gut microbiota composition based on gestational ages between normoglycemic and PGDM pregnancies. Further longitudinal research involving women with T2DM at preconception stages and investigations using shotgun metagenomic sequencing should be performed to elucidate the relationships between specific bacterial functions and PGDM metabolic statuses during pregnancy and to identify potential therapeutic targets. IMPORTANCE The incidence of pregestational type 2 diabetes mellitus (PGDM) is increasing, with high rates of serious adverse maternal and neonatal outcomes that are strongly correlated with hyperglycemia. Recent studies have shown that type 2 diabetes mellitus is associated with gut microbial dysbiosis; however, the gut microbiome composition and its associations with the metabolic features of patients with PGDM remain largely unknown. In this study, we investigated the changes in the gut microbiota composition in pregnant women with and without PGDM. We identified differential taxa that may be correlated with maternal metabolic statuses during pregnancy. Additionally, we observed that the number of taxonomic and microbial networks of gut bacteria were distinctly reduced in women with hyperglycemia as their pregnancies progressed. These results extend our understanding of the associations between the gut microbial composition, PGDM-related metabolic changes, and pregnancy outcomes.
Keywords: bacterial metabolic pathway; gut microbiota; pregestational diabetes mellitus; pregnancy; taxonomic biomarker.
Conflict of interest statement
The authors declare no conflict of interest.
Figures
Similar articles
-
Gut microbiota dysbiosis in Chinese children with type 1 diabetes mellitus: An observational study.World J Gastroenterol. 2021 May 21;27(19):2394-2414. doi: 10.3748/wjg.v27.i19.2394. World J Gastroenterol. 2021. PMID: 34040330 Free PMC article.
-
Gestational diabetes is associated with change in the gut microbiota composition in third trimester of pregnancy and postpartum.Microbiome. 2018 May 15;6(1):89. doi: 10.1186/s40168-018-0472-x. Microbiome. 2018. PMID: 29764499 Free PMC article.
-
Alterations in Gut Microbiota of Gestational Diabetes Patients During the First Trimester of Pregnancy.Front Cell Infect Microbiol. 2020 Feb 27;10:58. doi: 10.3389/fcimb.2020.00058. eCollection 2020. Front Cell Infect Microbiol. 2020. PMID: 32175285 Free PMC article.
-
Characteristics of the gut microbiome in women with gestational diabetes mellitus: A systematic review.PLoS One. 2022 Jan 13;17(1):e0262618. doi: 10.1371/journal.pone.0262618. eCollection 2022. PLoS One. 2022. PMID: 35025980 Free PMC article.
-
A systematic review on gut microbiota in type 2 diabetes mellitus.Front Endocrinol (Lausanne). 2025 Jan 17;15:1486793. doi: 10.3389/fendo.2024.1486793. eCollection 2024. Front Endocrinol (Lausanne). 2025. PMID: 39897957 Free PMC article.
Cited by
-
From-Toilet-to-Freezer: A Review on Requirements for an Automatic Protocol to Collect and Store Human Fecal Samples for Research Purposes.Biomedicines. 2023 Sep 28;11(10):2658. doi: 10.3390/biomedicines11102658. Biomedicines. 2023. PMID: 37893032 Free PMC article. Review.
-
Reduced abundance of Fusobacterium signifies cardiovascular benefits of sodium glucose cotransporter 2 inhibitor in type 2 diabetes: a single arm clinical trial.Front Pharmacol. 2025 May 8;16:1600464. doi: 10.3389/fphar.2025.1600464. eCollection 2025. Front Pharmacol. 2025. PMID: 40406484 Free PMC article.
-
A legume-enriched diet improves metabolic health in prediabetes mediated through gut microbiome: a randomized controlled trial.Nat Commun. 2025 Jan 22;16(1):942. doi: 10.1038/s41467-025-56084-6. Nat Commun. 2025. PMID: 39843443 Free PMC article. Clinical Trial.
-
Insight of the interrelationship and association mechanism between periodontitis and diabetes mellitus.Regen Ther. 2024 Nov 20;26:1159-1167. doi: 10.1016/j.reth.2024.11.001. eCollection 2024 Jun. Regen Ther. 2024. PMID: 39640921 Free PMC article. Review.
-
Targeting Lactobacillus johnsonii to reverse chronic kidney disease.Signal Transduct Target Ther. 2024 Aug 5;9(1):195. doi: 10.1038/s41392-024-01913-1. Signal Transduct Target Ther. 2024. PMID: 39098923 Free PMC article.
References
-
- Chivese T, Hoegfeldt CA, Werfalli M, Yuen L, Sun H, Karuranga S, Li N, Gupta A, Immanuel J, Divakar H, Powe CE, Levitt NS, Yang X, Simmons D. 2022. Idf diabetes atlas: the prevalence of pre-existing diabetes in pregnancy – a systematic review and meta-analysis of studies published during 2010–2020. Diabetes Res Clin Pract 183:109049. doi:10.1016/j.diabres.2021.109049. - DOI - PubMed
-
- Metzger BE, Lowe LP, Dyer AR, Trimble ER, Chaovarindr U, Coustan DR, Hadden DR, Mccance DR, Hod M, Mcintyre HD, Oats JJ, Persson B, Rogers MS, Sacks DA, HAPO Study Cooperative Research Group . 2008. Hyperglycemia and adverse pregnancy outcomes. N Engl J Med 358:1991–2002. doi:10.1056/NEJMoa0707943. - DOI - PubMed
-
- Norgaard SK, Vestgaard MJ, Jorgensen IL, Asbjornsdottir B, Ringholm L, Mcintyre HD, Damm P, Mathiesen ER. 2018. Diastolic blood pressure is a potentially modifiable risk factor for preeclampsia in women with pre-existing diabetes. Diabetes Res Clin Pract 138:229–237. doi:10.1016/j.diabres.2018.02.014. - DOI - PubMed
MeSH terms
Substances
LinkOut - more resources
Full Text Sources
Medical
