

Single-cell RNA sequencing reveals tumor heterogeneity, microenvironment, and drug-resistance mechanisms of recurrent glioblastoma
- PMID: 36853018
- PMCID: PMC10236634
- DOI: 10.1111/cas.15773
Single-cell RNA sequencing reveals tumor heterogeneity, microenvironment, and drug-resistance mechanisms of recurrent glioblastoma
Abstract
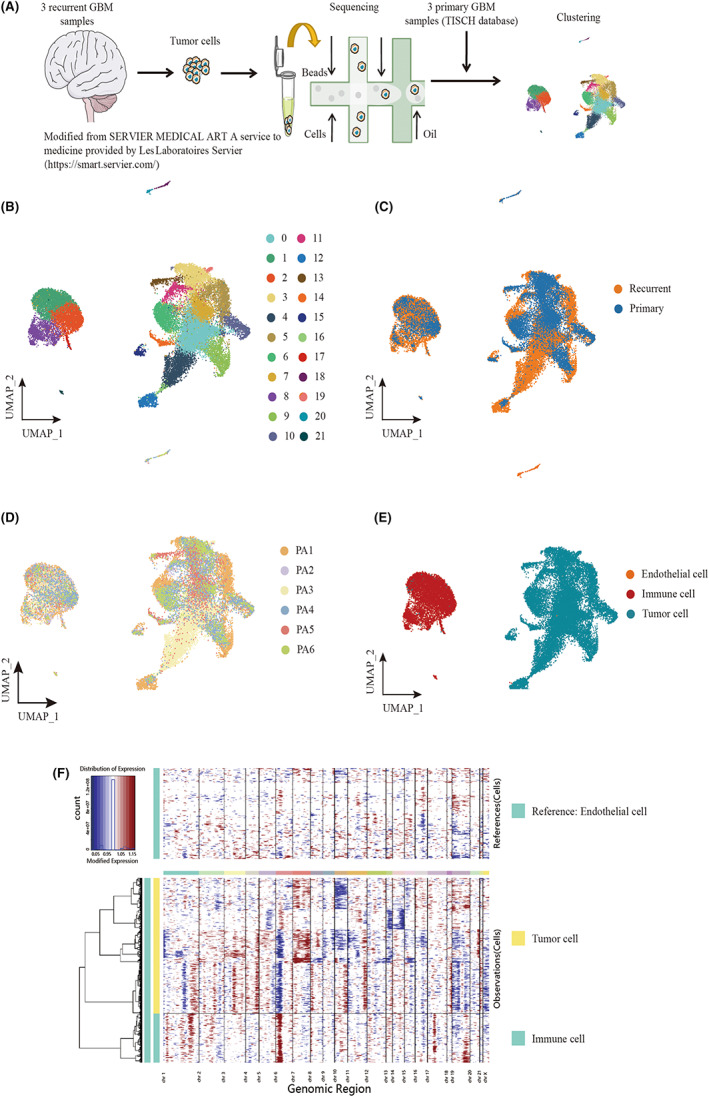
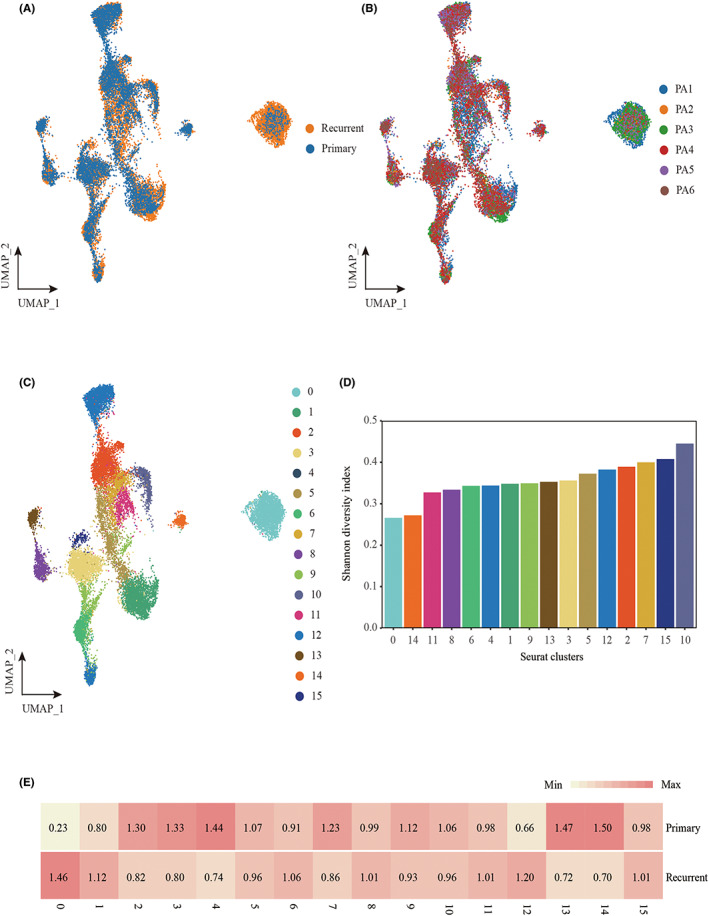
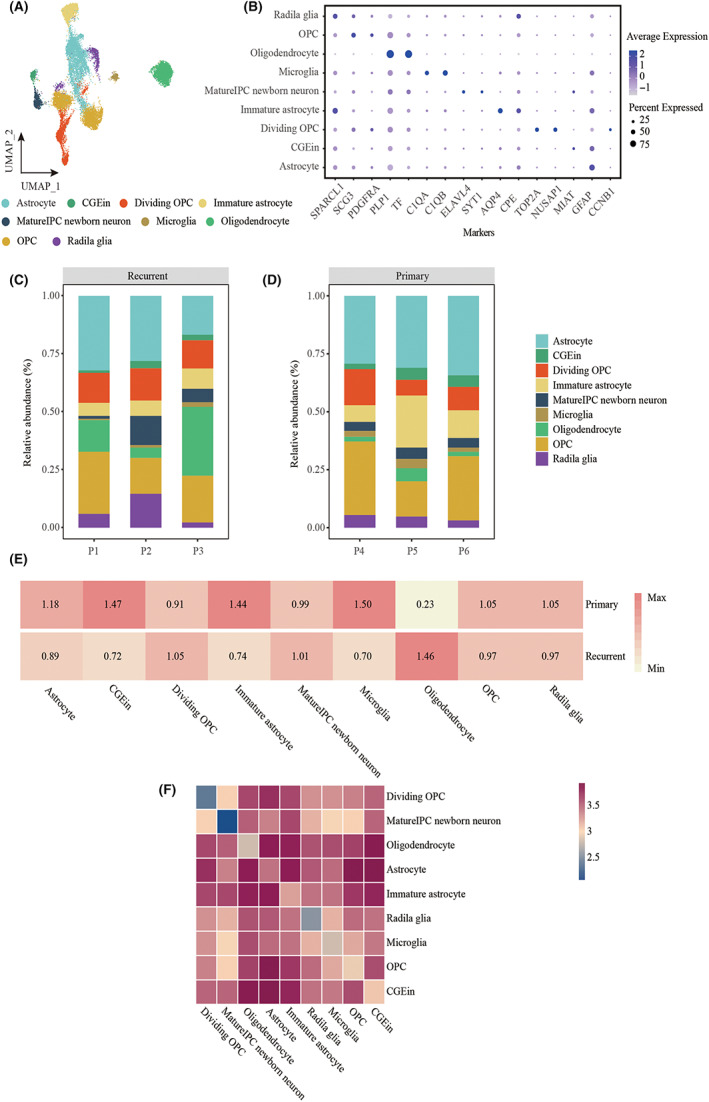
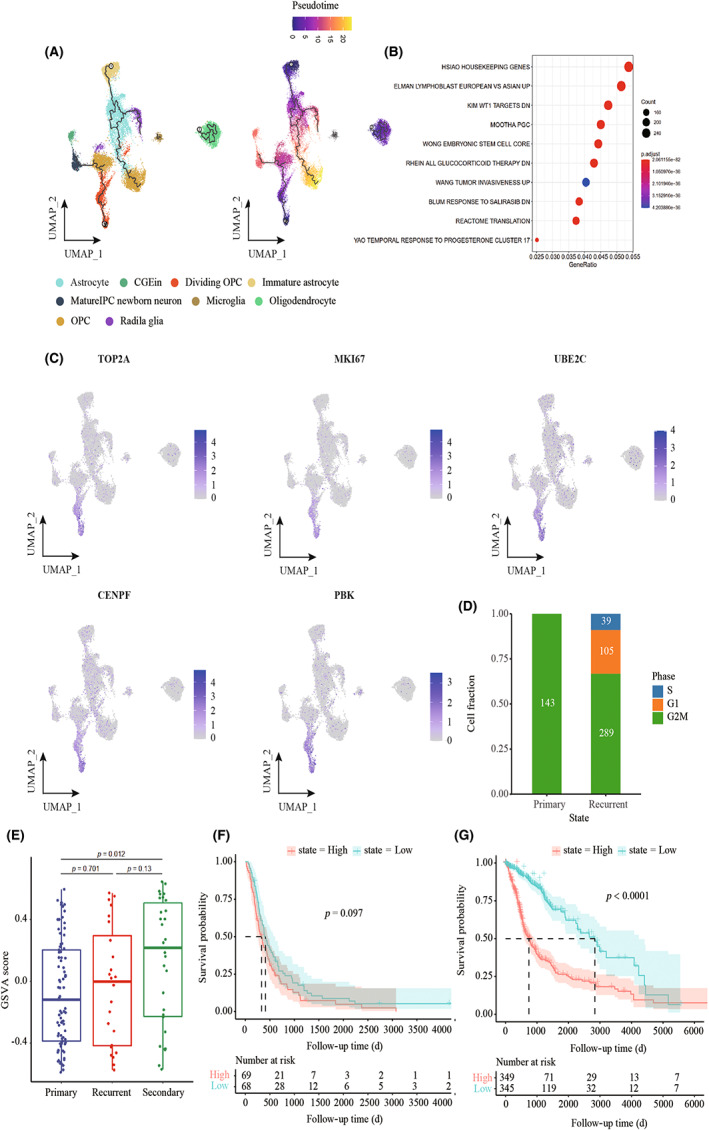
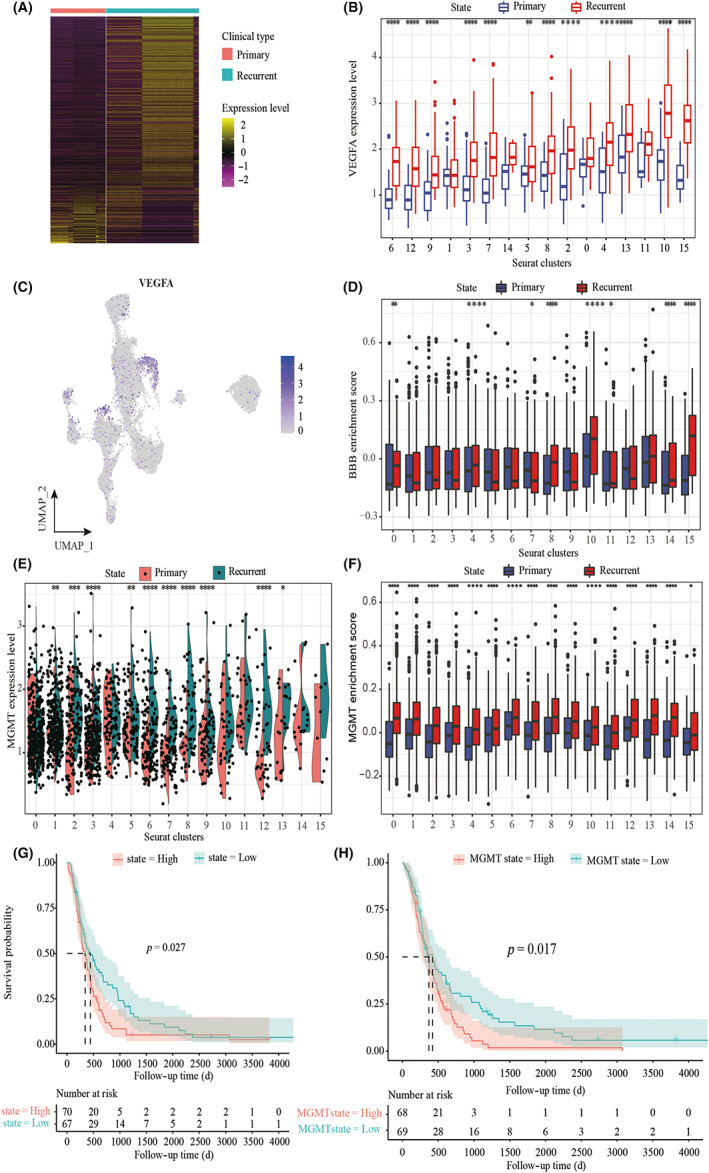
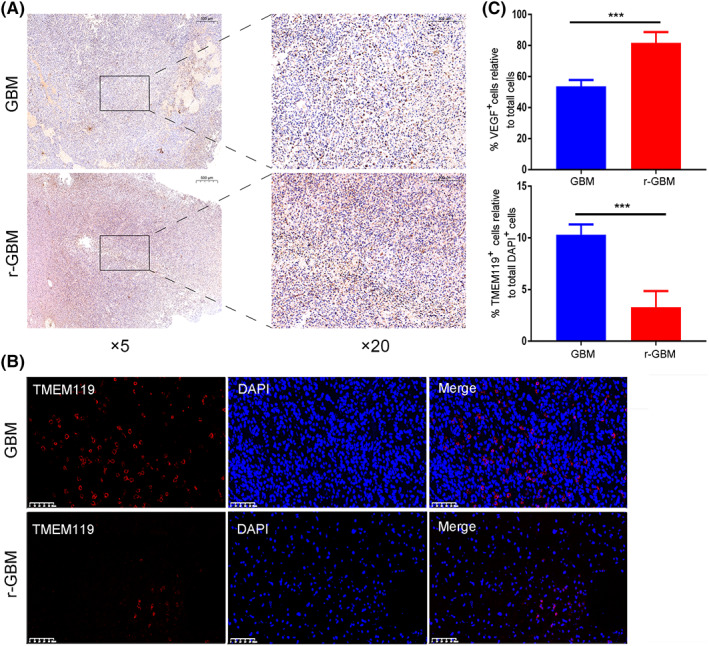
Glioblastomas are highly heterogeneous brain tumors. Despite the availability of standard treatment for glioblastoma multiforme (GBM), i.e., Stupp protocol, which involves surgical resection followed by radiotherapy and chemotherapy, glioblastoma remains refractory to treatment and recurrence is inevitable. Moreover, the biology of recurrent glioblastoma remains unclear. Increasing evidence has shown that intratumoral heterogeneity and the tumor microenvironment contribute to therapeutic resistance. However, the interaction between intracellular heterogeneity and drug resistance in recurrent GBMs remains controversial. The aim of this study was to map the transcriptome landscape of cancer cells and the tumor heterogeneity and tumor microenvironment in recurrent and drug-resistant GBMs at a single-cell resolution and further explore the mechanism of drug resistance of GBMs. We analyzed six tumor tissue samples from three patients with primary GBM and three patients with recurrent GBM in which recurrence and drug resistance developed after treatment with the standard Stupp protocol using single-cell RNA sequencing. Using unbiased clustering, nine major cell clusters were identified. Upregulation of the expression of stemness-related and cell-cycle-related genes was observed in recurrent GBM cells. Compared with the initial GBM tissues, recurrent GBM tissues showed a decreased proportion of microglia, consistent with previous reports. Finally, vascular endothelial growth factor A expression and the blood-brain barrier permeability were high, and the O6 -methylguanine DNA methyltransferase-related signaling pathway was activated in recurrent GBM. Our results delineate the single-cell map of recurrent glioblastoma, tumor heterogeneity, tumor microenvironment, and drug-resistance mechanisms, providing new insights into treatment strategies for recurrent glioblastomas.
Keywords: cancer microenvironment; drug resistance; recurrent glioblastoma; scRNA-seq; tumor heterogeneity.
© 2023 The Authors. Cancer Science published by John Wiley & Sons Australia, Ltd on behalf of Japanese Cancer Association.
Conflict of interest statement
The authors declare no conflict of interest.
Figures
Similar articles
-
"Zooming in" on Glioblastoma: Understanding Tumor Heterogeneity and its Clinical Implications in the Era of Single-Cell Ribonucleic Acid Sequencing.Neurosurgery. 2021 Feb 16;88(3):477-486. doi: 10.1093/neuros/nyaa305. Neurosurgery. 2021. PMID: 32674143 Review.
-
Combining single-cell sequencing and spatial transcriptome sequencing to identify exosome-related features of glioblastoma and constructing a prognostic model to identify BARD1 as a potential therapeutic target for GBM patients.Front Immunol. 2023 Aug 31;14:1263329. doi: 10.3389/fimmu.2023.1263329. eCollection 2023. Front Immunol. 2023. PMID: 37727789 Free PMC article.
-
Identification of a unique tumor cell subset employing myeloid transcriptional circuits to create an immunomodulatory microenvironment in glioblastoma.Oncoimmunology. 2022 Jan 26;11(1):2030020. doi: 10.1080/2162402X.2022.2030020. eCollection 2022. Oncoimmunology. 2022. PMID: 35096487 Free PMC article.
-
Intratumoral heterogeneity: pathways to treatment resistance and relapse in human glioblastoma.Ann Oncol. 2017 Jul 1;28(7):1448-1456. doi: 10.1093/annonc/mdx169. Ann Oncol. 2017. PMID: 28407030 Review.
-
Unveiling novel cell clusters and biomarkers in glioblastoma and its peritumoral microenvironment at the single-cell perspective.J Transl Med. 2024 Jun 8;22(1):551. doi: 10.1186/s12967-024-05313-5. J Transl Med. 2024. PMID: 38851695 Free PMC article.
Cited by
-
Overcoming immunotherapy resistance in glioblastoma: challenges and emerging strategies.Front Pharmacol. 2025 Mar 28;16:1584688. doi: 10.3389/fphar.2025.1584688. eCollection 2025. Front Pharmacol. 2025. PMID: 40223940 Free PMC article. Review.
-
Temozolomide promotes glioblastoma stemness expression through senescence-associated reprogramming via HIF1α/HIF2α regulation.Cell Death Dis. 2025 Apr 19;16(1):317. doi: 10.1038/s41419-025-07617-w. Cell Death Dis. 2025. PMID: 40253386 Free PMC article.
-
Construction of a whole-brain panorama for glioma vasculature reveals tumor heterogeneity and blood-brain barrier disruption.Sci Adv. 2025 Jul 25;11(30):eadw8330. doi: 10.1126/sciadv.adw8330. Epub 2025 Jul 23. Sci Adv. 2025. PMID: 40700511 Free PMC article.
-
Efficacy and Cognitive Outcomes of Gamma Knife Radiosurgery in Glioblastoma Management for Elderly Patients.J Pers Med. 2024 Oct 10;14(10):1049. doi: 10.3390/jpm14101049. J Pers Med. 2024. PMID: 39452556 Free PMC article.
-
Enhancing cancer immunotherapy: Nanotechnology-mediated immunotherapy overcoming immunosuppression.Acta Pharm Sin B. 2024 Sep;14(9):3834-3854. doi: 10.1016/j.apsb.2024.05.032. Epub 2024 Jun 3. Acta Pharm Sin B. 2024. PMID: 39309502 Free PMC article. Review.
References
-
- LeBlanc VG, Trinh DL, Aslanpour S, et al. Single‐cell landscapes of primary glioblastomas and matched explants and cell lines show variable retention of inter‐ and intratumor heterogeneity. Cancer Cell. 2022;40:379‐392. - PubMed
-
- Louis DN, Perry A, Reifenberger G, et al. The 2016 World Health Organization classification of tumors of the central nervous system: a summary. Acta Neuropathol. 2016;131:803‐820. - PubMed
-
- Zhang X, Ding K, Wang J, Li X, Zhao P. Chemoresistance caused by the microenvironment of glioblastoma and the corresponding solutions. Biomed Pharmacother. 2018;109:39‐46. - PubMed
MeSH terms
Substances
Grants and funding
LinkOut - more resources
Full Text Sources
Medical
Research Materials
