Review
. 2023 Apr;307(1):e222801.
doi: 10.1148/radiol.222801. Epub 2023 Feb 28.

LI-RADS: Looking Back, Looking Forward

Affiliations
Review

LI-RADS: Looking Back, Looking Forward

Victoria Chernyak et al. Radiology. 2023 Apr.

Abstract

Since its initial release in 2011, the Liver Imaging Reporting and Data System (LI-RADS) has evolved and expanded in scope. It started as a single algorithm for hepatocellular carcinoma (HCC) diagnosis with CT or MRI with extracellular contrast agents and has grown into a multialgorithm network covering all major liver imaging modalities and contexts of use. Furthermore, it has developed its own lexicon, report templates, and supplementary materials. This article highlights the major achievements of LI-RADS in the past 11 years, including adoption in clinical care and research across the globe, and complete unification of HCC diagnostic systems in the United States. Additionally, the authors discuss current gaps in knowledge, which include challenges in surveillance, diagnostic population definition, perceived complexity, limited sensitivity of LR-5 (definite HCC) category, management implications of indeterminate observations, challenges in reporting, and treatment response assessment following radiation-based therapies and systemic treatments. Finally, the authors discuss future directions, which will focus on mitigating the current challenges and incorporating advanced technologies. Tha authors envision that LI-RADS will ultimately transform into a probability-based system for diagnosis and prognostication of liver cancers that will integrate patient characteristics and quantitative imaging features, while accounting for imaging modality and contrast agent.


Conflict of interest statement

Disclosures of conflicts of interest: V.C. Consulting fees from Bayer. K.J.F. Grant support from GE, Bayer, and Pfizer; consulting with Bayer, GE, and Epigenomics; payment or honoraria for CME lectures series from UCSD; payment for expert witness; unpaid board member of Quantix Bio; member of Radiology editorial board. R.K.G.D. No relevant relationships. A.K. Book royalties from Elsevier. Y.K. No relevant relationships. A.T. Equipment loan (Sequoia) from Siemens Healthineers for US scanner with research mode for a project publicly funded by the Canadian Institutes of Health Research entitled “Quantitative Ultrasound Techniques for Diagnosis of Nonalcoholic Steatohepatitis.” D.G.M. No relevant relationships. J.W. Paid consultant for Guerbet, Bracco, and GE Healthcare. C.S.S. Consulting fees from Alimentiv Clinical Research; payment for educational Symposia as visiting professor for University of Kentucky Bluegrass. C.B.S. Payment to the institution from ACR, Bayer, Foundation of NIH, GE, Gilead, Pfizer, Philips, and Siemens; payment from Medscape and Wolters Kluwer; personal consulting for Blade, Boehringer, Epigenomics, and Guerbet; institutional consulting for AMRA, BMS, Exact Sciences, IBM-Watson, and Pfizer; payment for educational symposia from Japanese Society of Radiology; subsidization of flights and hotels from Fundacion Santa Fe, CADI; own stock options in Livivos; unpaid participation on a DataSafety Monitoring Board or Advisory Board; Chief Medical Officer for Livivos, an unsalaried position with ownership of stock options that is approved by the university; equipment loan of GE Logiq E10 US system from GE; payment to institution for lab service agreements from Enanta, Gilead, ICON, Intercept, Nusirt, Shire, Synageva, and Takeda.

Figures

None
Graphical abstract
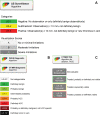
Description of categories included in the Liver Imaging Reporting and Data
System algorithms: (A) US surveillance, (B) CT/MRI and CEUS diagnosis, and (C)
CT/MRI treatment response assessment. CEUS = contrast-enhanced US, HCC =
hepatocellular carcinoma, TACE = transarterial chemoembolization, TRA =
treatment response assessment.
Figure 1:
Description of categories included in the Liver Imaging Reporting and Data System algorithms: (A) US surveillance, (B) CT/MRI and CEUS diagnosis, and (C) CT/MRI treatment response assessment. CEUS = contrast-enhanced US, HCC = hepatocellular carcinoma, TACE = transarterial chemoembolization, TRA = treatment response assessment.
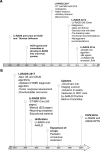
Timelines summarize major achievements of the Liver Imaging Reporting and
Data System (LI-RADS) (A) 2011–2016 and (B) 2017–2023. AASLD =
American Association for the Study of Liver Diseases; ACR = American College of
Radiology; CEUS = contrast-enhanced US; ECA = extracellular agent; HB =
hepatobiliary; HCC = hepatocellular carcinoma; OPTN = Organ Procurement and
Transplantation Network; UCSD = University of California, San Diego; UNOS =
United Network for Organ Sharing.
Figure 2:
Timelines summarize major achievements of the Liver Imaging Reporting and Data System (LI-RADS) (A) 2011–2016 and (B) 2017–2023. AASLD = American Association for the Study of Liver Diseases; ACR = American College of Radiology; CEUS = contrast-enhanced US; ECA = extracellular agent; HB = hepatobiliary; HCC = hepatocellular carcinoma; OPTN = Organ Procurement and Transplantation Network; UCSD = University of California, San Diego; UNOS = United Network for Organ Sharing.
Summary of the Liver Imaging Reporting and Data System governance. AASLD =
American Association for Study of Liver Diseases, NCCN = National Comprehensive
Cancer Network, OPTN = Organ Procurement and Transplantation Network.
Figure 3:
Summary of the Liver Imaging Reporting and Data System governance. AASLD = American Association for Study of Liver Diseases, NCCN = National Comprehensive Cancer Network, OPTN = Organ Procurement and Transplantation Network.
Probabilities of hepatocellular carcinoma (HCC) and overall malignancy per
each diagnostic category for (A) CT/MRI (2014, 2017, and 2018 versions) and (B)
contrast-enhanced US (2016 and 2017 versions) diagnostic algorithms. The graphs
are based on the data from meta-analysis performed by Zhou et al (14). LR-M =
probably or definitely malignant, not HCC specific, LR-2 = probably benign, LR-3
= intermediate probability of malignancy, LR-4 = probable HCC, LR-5 = definite
HCC.
Figure 4:
Probabilities of hepatocellular carcinoma (HCC) and overall malignancy per each diagnostic category for (A) CT/MRI (2014, 2017, and 2018 versions) and (B) contrast-enhanced US (2016 and 2017 versions) diagnostic algorithms. The graphs are based on the data from meta-analysis performed by Zhou et al (14). LR-M = probably or definitely malignant, not HCC specific, LR-2 = probably benign, LR-3 = intermediate probability of malignancy, LR-4 = probable HCC, LR-5 = definite HCC.
Patient images and Bayes diagrams show the relationship between
pretest conditional probability of hepatocellular carcinoma (HCC) and
posttest probability (positive predictive value) of HCC. (A, B) Patient 1 is
a 53-year-old man without a history of parenchymal liver disease. Axial
contrast-enhanced CT images show a 23-mm observation with nonrim arterial
phase hyperenhancement (arrow, A), nonperipheral washout on portal venous
phase (long arrow, B), and enhancing capsule (short arrow, B). (C, D)
Patient 2 is a 62-year-old man with history of hepatitis C virus cirrhosis.
Axial contrast-enhanced CT images show a 24-mm observation with the same
imaging features as patient 1, including a nonrim arterial phase
hyperenhancement (arrow, C), nonperipheral washout on portal venous phase
(long arrow, D), and enhancing capsule (short arrow, D). (E, F) Bayes
theorem diagrams show conditional pretest and posttest probabilities of HCC
in patients 1 and 2. Imaging features for both patients meet criteria for
LR-5 (definite HCC), which has positive likelihood ratio of 17 (23). (E)
Bayes diagram for the patient without parenchymal liver disease (patient 1)
demonstrates the patient has a low pretest probability of 0.5%–2% and
posttest probability of 7%–28% (shaded area in E). (F) Bayes diagram
for the patient with cirrhosis (patient 2) demonstrates a high pretest
probability of ≥50% and a posttest probability of ≥95% (shaded
area in F). On resection, patient 1 had a neuroendocrine tumor metastasis,
and patient 2 had HCC.
Figure 5:
Patient images and Bayes diagrams show the relationship between pretest conditional probability of hepatocellular carcinoma (HCC) and posttest probability (positive predictive value) of HCC. (A, B) Patient 1 is a 53-year-old man without a history of parenchymal liver disease. Axial contrast-enhanced CT images show a 23-mm observation with nonrim arterial phase hyperenhancement (arrow, A), nonperipheral washout on portal venous phase (long arrow, B), and enhancing capsule (short arrow, B). (C, D) Patient 2 is a 62-year-old man with history of hepatitis C virus cirrhosis. Axial contrast-enhanced CT images show a 24-mm observation with the same imaging features as patient 1, including a nonrim arterial phase hyperenhancement (arrow, C), nonperipheral washout on portal venous phase (long arrow, D), and enhancing capsule (short arrow, D). (E, F) Bayes theorem diagrams show conditional pretest and posttest probabilities of HCC in patients 1 and 2. Imaging features for both patients meet criteria for LR-5 (definite HCC), which has positive likelihood ratio of 17 (23). (E) Bayes diagram for the patient without parenchymal liver disease (patient 1) demonstrates the patient has a low pretest probability of 0.5%–2% and posttest probability of 7%–28% (shaded area in E). (F) Bayes diagram for the patient with cirrhosis (patient 2) demonstrates a high pretest probability of ≥50% and a posttest probability of ≥95% (shaded area in F). On resection, patient 1 had a neuroendocrine tumor metastasis, and patient 2 had HCC.
Liver Imaging Reporting and Data System (LI-RADS) diagnostic
algorithms for (A) CT/MRI (70) and (B) contrast-enhanced US (CEUS) (87). HCC
= hepatocellular carcinoma.
Figure 6:
Liver Imaging Reporting and Data System (LI-RADS) diagnostic algorithms for (A) CT/MRI (70) and (B) contrast-enhanced US (CEUS) (87). HCC = hepatocellular carcinoma.
CT images show examples of observations that meet criteria for Liver
Imaging Reporting and Data System (LI-RADS) category LR-M (probably or
definitely malignant, not hepatocellular carcinoma [HCC] specific). Axial
contrast-enhanced CT in (A) arterial phase and (B) portal venous phase in a
56-year-old woman with nonalcoholic steatohepatitis-induced cirrhosis
demonstrates a 36-mm observation (arrow, B) with rim arterial phase
hyperenhancement (arrow, A). Pathology revealed intrahepatic
cholangiocarcinoma. Axial contrast-enhanced CT in (C) arterial phase and (D)
portal venous phase in a 63-year-old man with hepatitis C virus cirrhosis
demonstrates a 90-mm observation (arrow, D) with rim arterial phase
hyperenhancement (arrow, C). Pathology revealed poorly differentiated HCC
with p53 mutation.
Figure 7:
CT images show examples of observations that meet criteria for Liver Imaging Reporting and Data System (LI-RADS) category LR-M (probably or definitely malignant, not hepatocellular carcinoma [HCC] specific). Axial contrast-enhanced CT in (A) arterial phase and (B) portal venous phase in a 56-year-old woman with nonalcoholic steatohepatitis-induced cirrhosis demonstrates a 36-mm observation (arrow, B) with rim arterial phase hyperenhancement (arrow, A). Pathology revealed intrahepatic cholangiocarcinoma. Axial contrast-enhanced CT in (C) arterial phase and (D) portal venous phase in a 63-year-old man with hepatitis C virus cirrhosis demonstrates a 90-mm observation (arrow, D) with rim arterial phase hyperenhancement (arrow, C). Pathology revealed poorly differentiated HCC with p53 mutation.
MRI scans with gadoxetate in a 57-year-old woman with hepatitis C
virus cirrhosis. MRI scans demonstrate (A) a 10-mm observation (arrow) with
hepatobiliary phase hypointensity, (B) mild diffusion restriction (arrow)
with diffusion-weighted image with b = 800 m/sec2, and (C) mild
T2-hyperintensity (arrow) with lesional fat sparing (not shown). The
observation is not discernable on (D) precontrast T1-weighted image, (E)
arterial phase, or (F) portal venous phase (the region of the observation is
marked by a circle in D–F). The observation progressed to LR-5
(definite hepatocellular carcinoma) in 2 years.
Figure 8:
MRI scans with gadoxetate in a 57-year-old woman with hepatitis C virus cirrhosis. MRI scans demonstrate (A) a 10-mm observation (arrow) with hepatobiliary phase hypointensity, (B) mild diffusion restriction (arrow) with diffusion-weighted image with b = 800 m/sec2, and (C) mild T2-hyperintensity (arrow) with lesional fat sparing (not shown). The observation is not discernable on (D) precontrast T1-weighted image, (E) arterial phase, or (F) portal venous phase (the region of the observation is marked by a circle in D–F). The observation progressed to LR-5 (definite hepatocellular carcinoma) in 2 years.
Proposed minor modification to the Liver Imaging Reporting and Data
System CT/MRI Diagnostic Table that includes the nontargetoid LR-M category
(probably or definitely malignant, not hepatocellular carcinoma specific).
(A) Current description of the nontargetoid LR-M criteria in version 2018
Core (70). (B) Authors’ proposed illustration of the nontargetoid
LR-M criteria.
Figure 9:
Proposed minor modification to the Liver Imaging Reporting and Data System CT/MRI Diagnostic Table that includes the nontargetoid LR-M category (probably or definitely malignant, not hepatocellular carcinoma specific). (A) Current description of the nontargetoid LR-M criteria in version 2018 Core (70). (B) Authors’ proposed illustration of the nontargetoid LR-M criteria.
Illustration of the ultimate system for diagnosis and prognostication
of liver cancers. A comprehensive probability-based system integrates
patient characteristics and quantitative and qualitative imaging features
and takes into account imaging modality and contrast agent to arrive at
patient-specific probability of hepatocellular carcinoma (HCC) and
posttreatment recurrence. AF = ancillary feature, LR-M = Liver Imaging
Reporting and Data System category M, probably or definitely malignant, not
HCC specific category, LRT = local-regional treatment, MF = major feature,
PDFF = proton density fat fraction.
Figure 10:
Illustration of the ultimate system for diagnosis and prognostication of liver cancers. A comprehensive probability-based system integrates patient characteristics and quantitative and qualitative imaging features and takes into account imaging modality and contrast agent to arrive at patient-specific probability of hepatocellular carcinoma (HCC) and posttreatment recurrence. AF = ancillary feature, LR-M = Liver Imaging Reporting and Data System category M, probably or definitely malignant, not HCC specific category, LRT = local-regional treatment, MF = major feature, PDFF = proton density fat fraction.

References

    1. Marrero JA , Kulik LM , Sirlin CB , et al. . Diagnosis, Staging, and Management of Hepatocellular Carcinoma: 2018 Practice Guidance by the American Association for the Study of Liver Diseases . Hepatology 2018. ; 68 ( 2 ): 723 – 750 . - PubMed
    1. Chernyak V , Fowler KJ , Kamaya A , et al. . Liver Imaging Reporting and Data System (LI-RADS) Version 2018: Imaging of Hepatocellular Carcinoma in At-Risk Patients . Radiology 2018. ; 289 ( 3 ): 816 – 830 . - PMC - PubMed
    1. Tang A , Cruite I , Mitchell DG , Sirlin CB . Hepatocellular carcinoma imaging systems: why they exist, how they have evolved, and how they differ . Abdom Radiol (NY) 2018. ; 43 ( 1 ): 3 – 12 . - PubMed
    1. Liver Reporting and Data System . American College of Radiology . https://www.acr.org/Clinical-Resources/Reporting-and-Data-Systems/LI-RAD... . Accessed January 31, 2023.
    1. Sirlin CB . The LI-RADS adventure-a personal statement . Abdom Radiol (NY) 2018. ; 43 ( 1 ): 1 – 2 . - PubMed

Publication types