. 2023 Mar 17;4(1):102095.
doi: 10.1016/j.xpro.2023.102095. Epub 2023 Feb 13.

Protocol to determine antibody affinity and concentration in complex solutions using microfluidic antibody affinity profiling

Affiliations

Protocol to determine antibody affinity and concentration in complex solutions using microfluidic antibody affinity profiling

Marc Emmenegger et al. STAR Protoc. .

Abstract

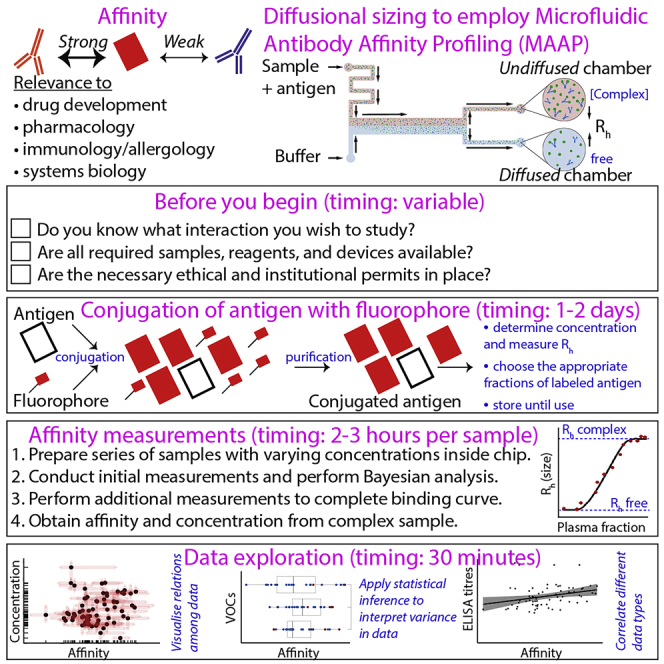
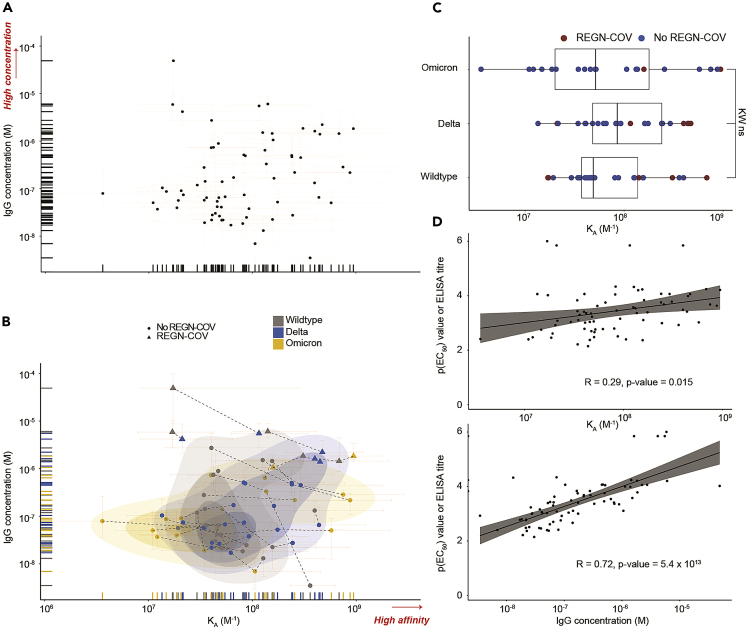
Conventional methods of measuring affinity are limited by artificial immobilization, large sample volumes, and homogeneous solutions. This protocol describes microfluidic antibody affinity profiling on complex human samples in solution to obtain a fingerprint reflecting both affinity and active concentration of the target protein. To illustrate the protocol, we analyze the antibody response in SARS-CoV-2 omicron-naïve samples against different SARS-CoV-2 variants of concern. However, the protocol and the technology are amenable to a broad spectrum of biomedical questions. For complete details on the use and execution of this protocol, please refer to Emmenegger et al. (2022),1 Schneider et al. (2022),2 and Fiedler et al. (2022).3.

Keywords: Antibody; Health Sciences; Immunology; Protein Biochemistry; Proteomics; Surface Plasmon Resonance (SPR).


Conflict of interest statement

Declaration of interests T.P.J.K. is a member of the board of directors of Fluidic Analytics. A.A. is a member of the clinical and scientific advisory board of Fluidic Analytics. A.A. is a member of the board of directors of Mabylon AG and AB2Bio AG. S.F., R.W., and S.R.A.D. are employees of Fluidic Analytics.

Figures

None
Graphical abstract
Figure 1
Figure 1
Workflow to effectively conjugate an antigen with Alexa Fluor™ 647 for use in a MAAP assay that will determine the affinity and concentration of the labeled antigen to its target antibody (A-C) The target protein is solubilized in PBS and conjugated with Alexa Fluor 647 dye. (D-F) Purification is conducted on an AKTA Pure System, fractions of the eluted Alexa 647-conjugated target protein are collected, and the molar label:protein ratio is calculated on a Nanodrop. (G-H) For those fractions for which the dye:protein ratio is close to 1, the Rh is measured (G). The fractions where Rh is close to 3.5 nm are pooled, concentrated, and stored.
Figure 2
Figure 2
Workflow for preparing serum samples for a MAAP assay that will be analyzed by MDS on the Fluidity One-M (Fluidic Analytics) (A) A serum or plasma sample is thawed and centrifuged at 14,000 xg for 10 min. (B) The serum stock samples are prepared using Viscomatch buffer. (C) The flow buffer dilutions and serum samples containing the probe protein are prepared. (D) The Fluidity One-M chip plate is loaded for analysis.
Figure 3
Figure 3
Additional measurements to refine the KD and target concentration parameters (A) The data from the initial conditions (i.e., 2, 10 and 50% of serum with 10 and 100 nM of the protein probe) may yield a complete data set. (B) In most situations, additional samples need to be prepared to better refine the data. Using Bayesian statistical analysis, the Fluidity Cloud (Fluidic Analytics) will predict a concentration range of both the serum and protein probe concentration that will refine the data set. (C) The refined data set yielding a defined KD and target concentration for the interaction after additional measurements.
Figure 4
Figure 4
Data visualization and exploration (A) All quantifiable data points reflecting KA (in M−1) and IgG concentration values (in M) are plotted.. (B) Same as (A) but including a 2D scatter plot with integrated density contours. Triangles denote patients receiving the REGN-COV cocktail. RBD variants: wild type (WT, gray), delta (blue), omicron (yellow). Dotted lines represent the measurements of the same patient sample against different RBD variants. Plot taken from. Higher affinity and higher concentration (for A and B) are indicated in red writing with an arrow. 95% confidence intervals for each point are colored in light red. (C) Boxplot analysis of KA values for WT, delta, and omicron RBD variants. Samples of patients treated with REGN-COV antibody cocktail are shown in red color. (D) KA and IgG concentration were plotted against the respective ELISA titers, i.e., p(EC50) values, obtained for WT, delta, and omicron RBD variants. Concentration, but not affinity, is shown to correlate with titers measured by ELISA. Data and plots are from work recently published.

References

    1. Emmenegger M., Fiedler S., Brugger S.D., Devenish S.R.A., Morgunov A.S., Ilsley A., Ricci F., Malik A.Y., Scheier T., Batkitar L., et al. Both COVID-19 infection and vaccination induce high-affinity cross-clade responses to SARS-CoV-2 variants. iScience. 2022;25:104766. doi: 10.1016/j.isci.2022.104766. - DOI - PMC - PubMed
    1. Schneider M.M., Emmenegger M., Xu C.K., Condado Morales I., Meisl G., Turelli P., Zografou C., Zimmermann M.R., Frey B.M., Fiedler S., et al. Microfluidic characterisation reveals broad range of SARS-CoV-2 antibody affinity in human plasma. Life Sci. Alliance. 2022;5:e202101270. doi: 10.26508/lsa.202101270. - DOI - PMC - PubMed
    1. Fiedler S., Devenish S.R.A., Morgunov A.S., Ilsley A., Ricci F., Emmenegger M., Kosmoliaptsis V., Theel E.S., Mills J.R., Sholukh A.M., et al. Serological fingerprints link antiviral activity of therapeutic antibodies to affinity and concentration. Sci. Rep. 2022;12:19791. doi: 10.1038/s41598-022-22214-z. - DOI - PMC - PubMed
    1. Svitel J., Boukari H., van Ryk D., Willson R.C., Schuck P. Probing the functional heterogeneity of surface binding sites by analysis of experimental binding traces and the effect of mass transport limitation. Biophys. J. 2007;92:1742–1758. doi: 10.1529/biophysj.106.094615. - DOI - PMC - PubMed
    1. Butch A.W. Dilution protocols for detection of Hook effects/prozone phenomenon. Clin. Chem. 2000;46:1719–1721. doi: 10.1093/clinchem/46.10.1719. - DOI - PubMed

Publication types

Supplementary concepts