. 2023 Mar 17;4(1):102069.
doi: 10.1016/j.xpro.2023.102069. Epub 2023 Jan 25.

ImmCellFie: A user-friendly web-based platform to infer metabolic function from omics data

Affiliations

ImmCellFie: A user-friendly web-based platform to infer metabolic function from omics data

Helen O Masson et al. STAR Protoc. .

Abstract

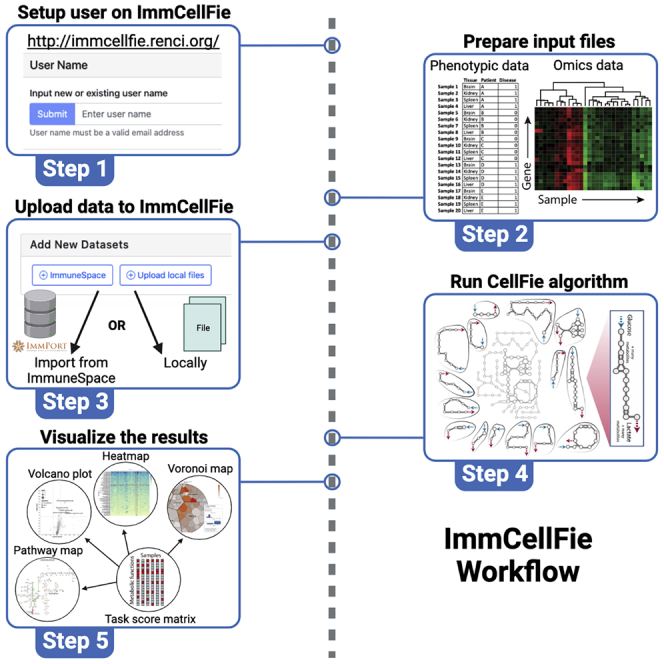
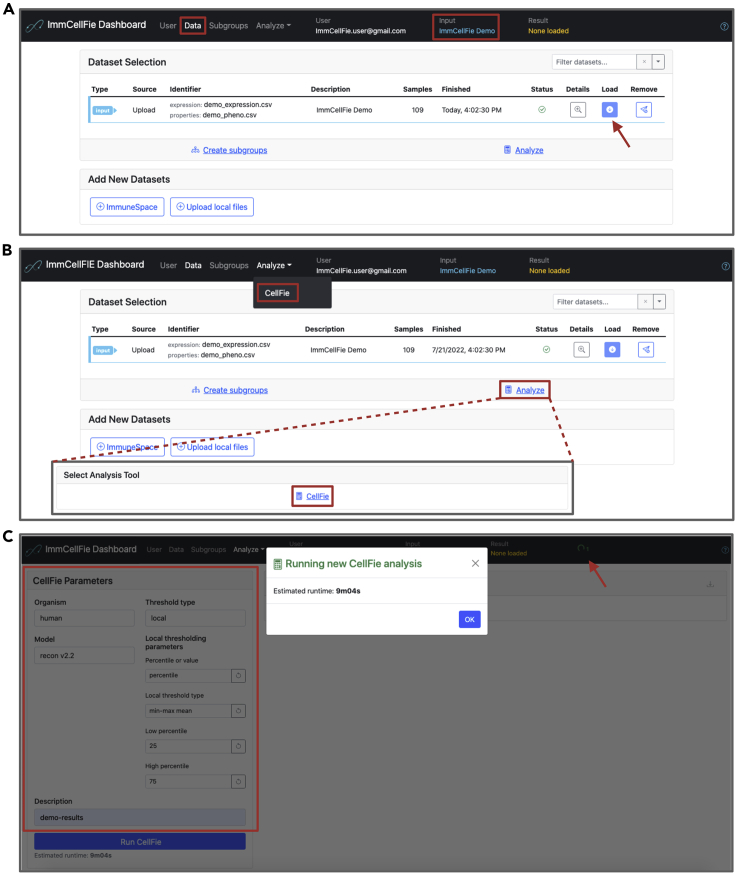
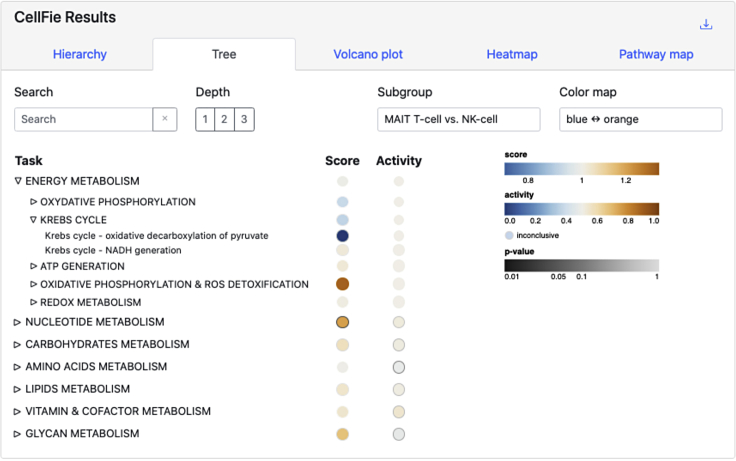
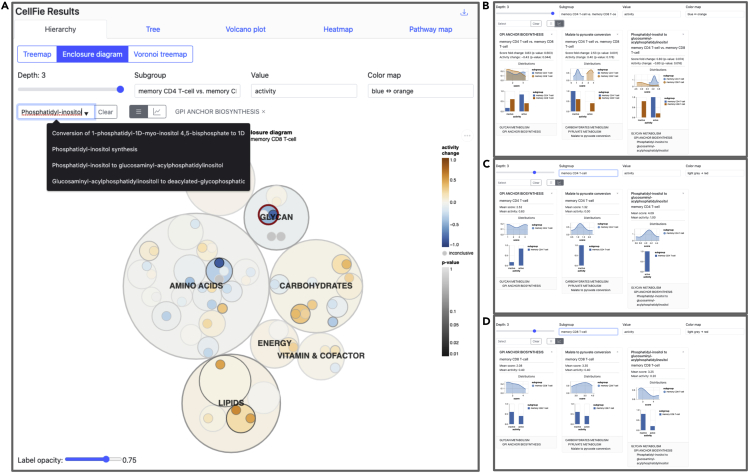
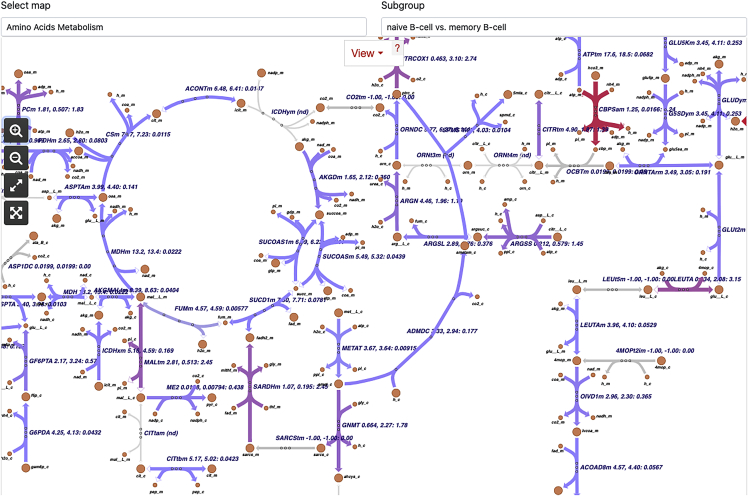
Understanding cellular metabolism is important across biotechnology and biomedical research and has critical implications in a broad range of normal and pathological conditions. Here, we introduce the user-friendly web-based platform ImmCellFie, which allows the comprehensive analysis of metabolic functions inferred from transcriptomic or proteomic data. We explain how to set up a run using publicly available omics data and how to visualize the results. The ImmCellFie algorithm pushes beyond conventional statistical enrichment and incorporates complex biological mechanisms to quantify cell activity. For complete details on the use and execution of this protocol, please refer to Richelle et al. (2021).1.

Keywords: Bioinformatics; Genomics; Metabolism; Systems Biology.


Conflict of interest statement

Declaration of interests The authors declare no competing interest.

Figures

None
Graphical abstract
Figure 1
Figure 1
Setting up a user account with ImmCellFie Screenshots showing how users create an account (or login in with a pre-existing account) with ImmCellFie.
Figure 2
Figure 2
Setting up a CellFie run Series of screenshots demonstrating various steps of setting up a CellFie run in ImmCellFie. (A) Load input data. (B) Two methods of navigating to the CellFie setup page. (C) Setting CellFie parameters (red box) and starting a run.
Figure 3
Figure 3
Creating subgroups based on immune cell type Series of screenshots demonstrating how to create subgroups. (A) Creating subgroups based on columns from the properties document upload. (B) Example of creating a custom subgroup.
Figure 4
Figure 4
Treemap tool The interactive treemap tool allows users to explore the CellFie Hierarchy. Users can click on various levels of the hierarchy to expand/shrink layers.
Figure 5
Figure 5
Hierarchy tool Screenshots demonstrating use of the Hierarchy tool. (A) Users can use the Search tool to select tasks, systems, or subsystems of interest. Here we have already selected the subsystem ‘GPI ANCHOR BIOSYNTHESIS’ (outlined in red in the plot and listed to the right of the search bar) and we are currently searching for the task ‘Phosphatidyl-inositol to glucosaminyl-acylphosphatidylinositol’. (B–D) Summary statistics for 3 select CellFie elements showing the difference in activity scores (B) and the activity scores of the individual groups (C and D).
Figure 6
Figure 6
Volcano plot tool Neutrophils and eosinophils are metabolically quite different. Here, we highlight 4 subsystems which show significant differential activity between the two cell types.
Figure 7
Figure 7
Heatmap tool Heatmap showing metabolic differences between Dendritic Cells and Monocytes. (A) Metabolic subsystem scores (continuous) of monocyte and dendritic cell samples. (B) Metabolic task activity (binary) of the same set of samples.
Figure 8
Figure 8
Pathway map tool Escher pathway map of Amino Acid Metabolism differences between naive B cells and memory B cells. The Pathway map tool provides Escher pathway maps for the 7 systems of CellFie. The reaction activity scores of selected samples (using the subgroup parameter) are projected onto the reactions in the map and colored accordingly.
Figure 9
Figure 9
RESTful API Screenshot of the RESTful, OpenAPI-compliant API system used to interface with ImmCellFie functions interactively over HTTP via notebooks (e.g., Jupyter, Google Colab).
Figure 10
Figure 10
Troubleshooting the volcano plot Example volcano plots showing the effect of adding a pseudo-count to the expression data. (A) Volcano plot with no pseudo-count added to the expression data. (B) Volcano plot using expression data with a pseudo-count.

References

    1. Richelle A., Kellman B.P., Wenzel A.T., Chiang A.W.T., Reagan T., Gutierrez J.M., Joshi C., Li S., Liu J.K., Masson H., et al. Model-based assessment of mammalian cell metabolic functionalities using omics data. Cell Rep. Methods. 2021;1:100040. doi: 10.1016/j.crmeth.2021.100040. - DOI - PMC - PubMed
    1. Lewis N.E., Nagarajan H., Palsson B.O. Constraining the metabolic genotype-phenotype relationship using a phylogeny of in silico methods. Nat. Rev. Microbiol. 2012;10:291–305. - PMC - PubMed
    1. Feist A.M., Herrgård M.J., Thiele I., Reed J.L., Palsson B.Ø. Reconstruction of biochemical networks in microorganisms. Nat. Rev. Microbiol. 2009;7:129–143. - PMC - PubMed
    1. Granados J.C., Richelle A., Gutierrez J.M., Zhang P., Zhang X., Bhatnagar V., Lewis N.E., Nigam S.K. Coordinate regulation of systemic and kidney tryptophan metabolism by the drug transporters OAT1 and OAT3. J. Biol. Chem. 2021;296:100575. - PMC - PubMed
    1. Swainston N., Smallbone K., Hefzi H., Dobson P.D., Brewer J., Hanscho M., Zielinski D.C., Ang K.S., Gardiner N.J., Gutierrez J.M., et al. Recon 2.2: from reconstruction to model of human metabolism. Metabolomics. 2016;12:109. - PMC - PubMed

Publication types