. 2023 Mar 17;4(1):102075.
doi: 10.1016/j.xpro.2023.102075. Epub 2023 Jan 29.

Quantitative analysis of myofiber type composition in human and mouse skeletal muscles

Affiliations

Quantitative analysis of myofiber type composition in human and mouse skeletal muscles

Tooba Abbassi-Daloii et al. STAR Protoc. .

Abstract

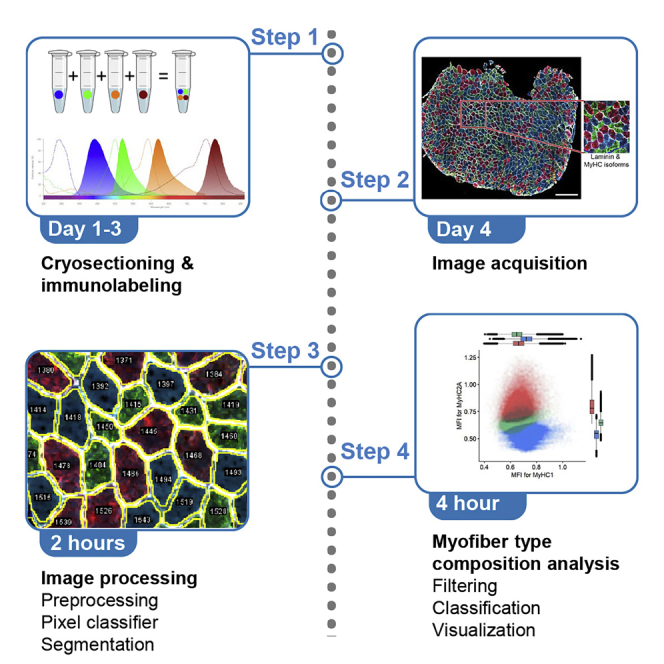
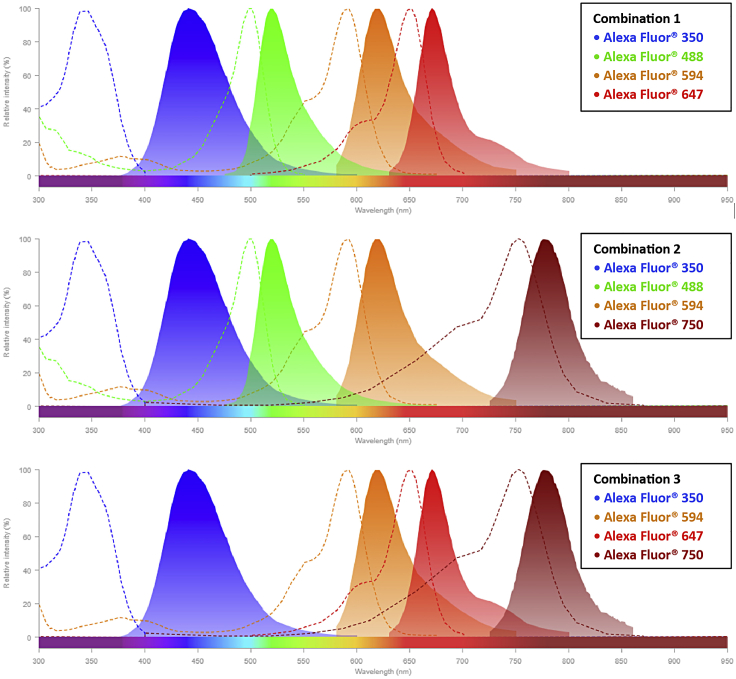
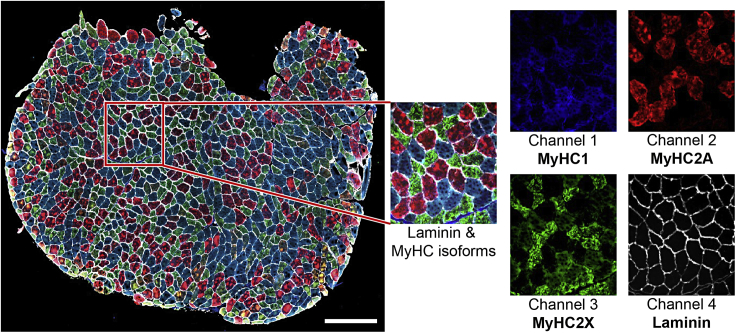
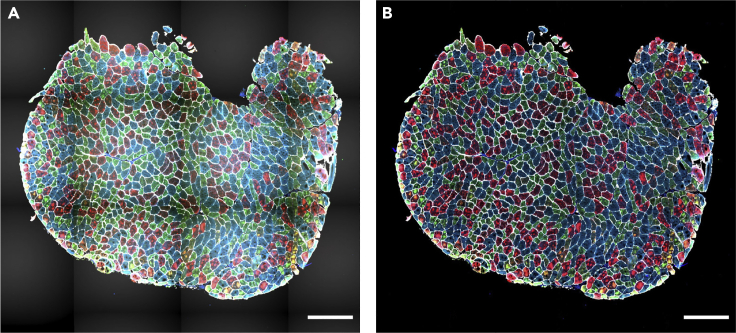
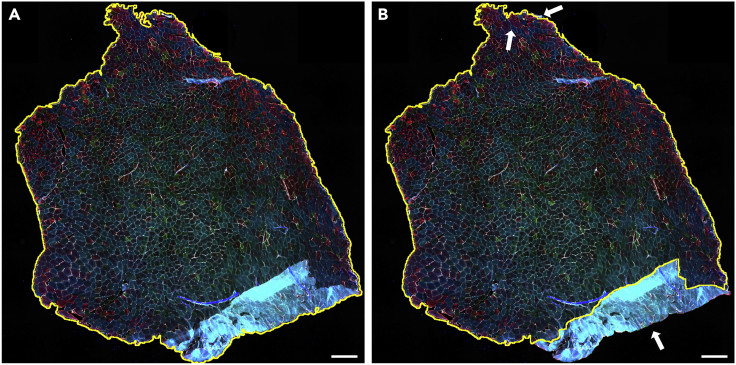
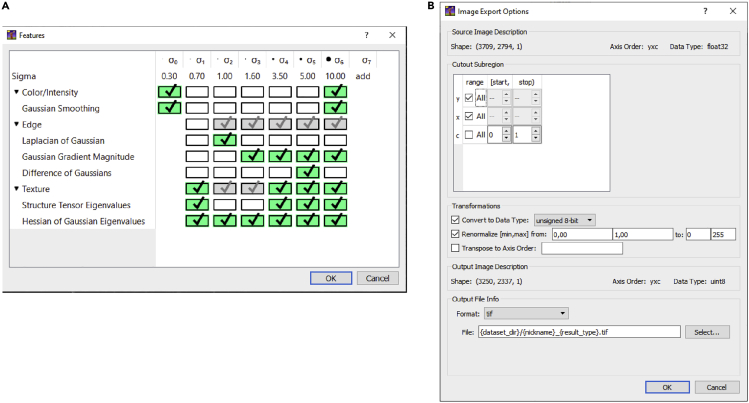
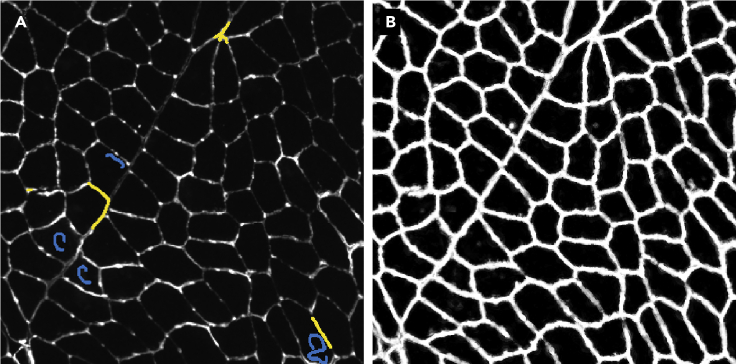
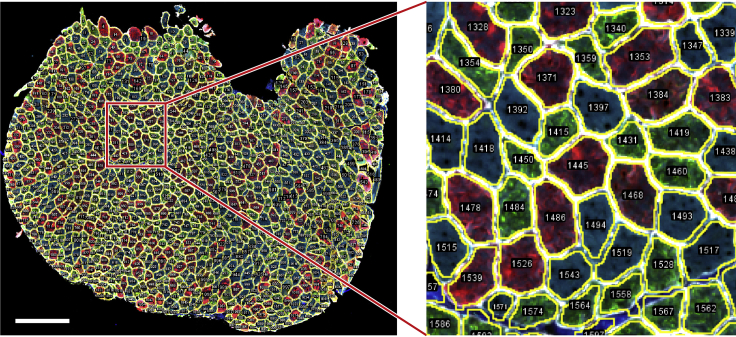
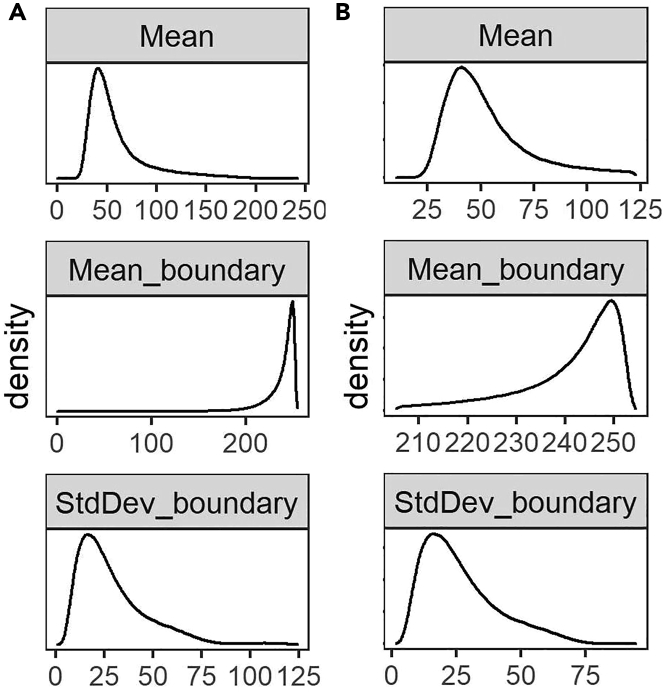
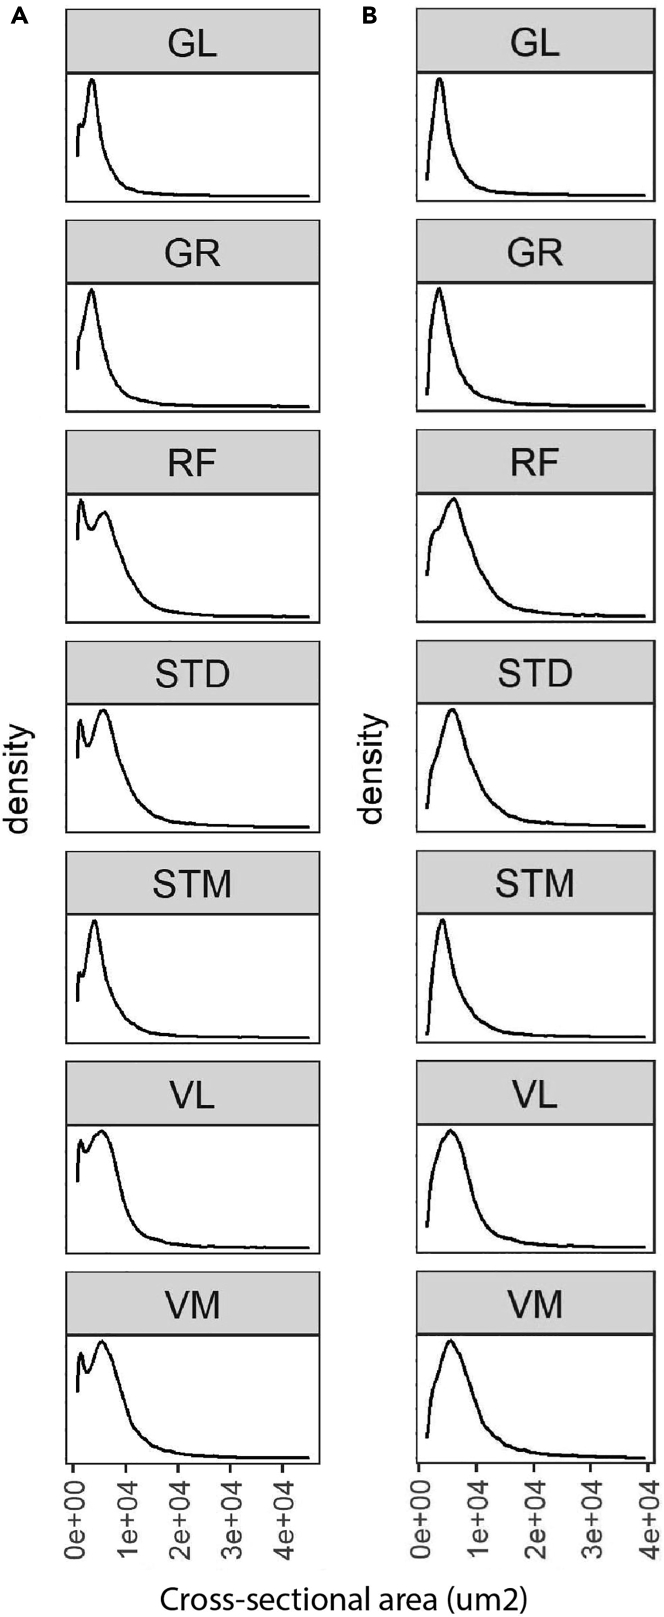
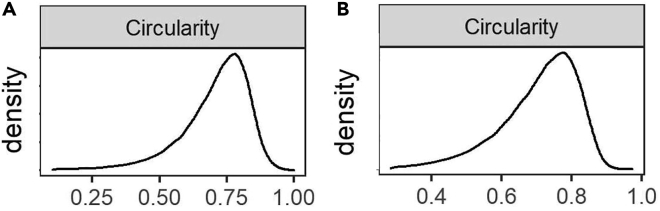
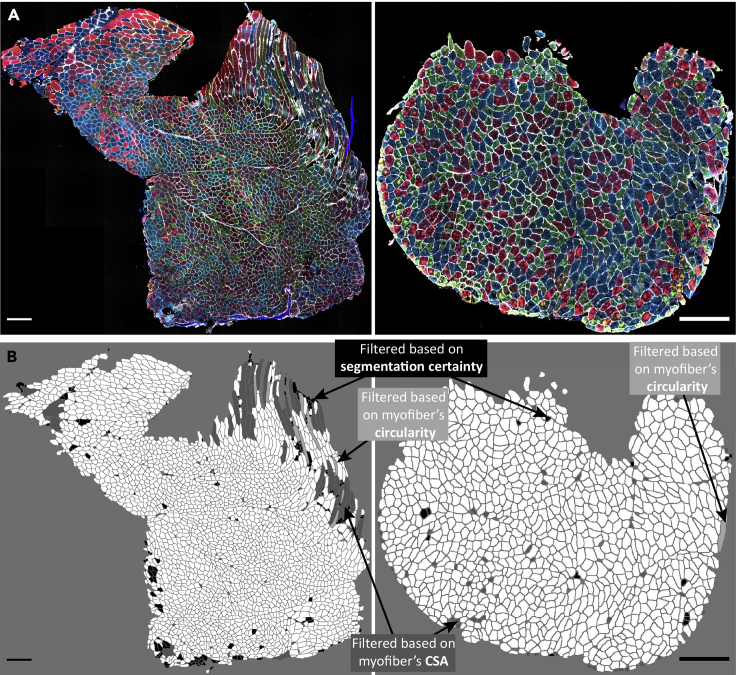
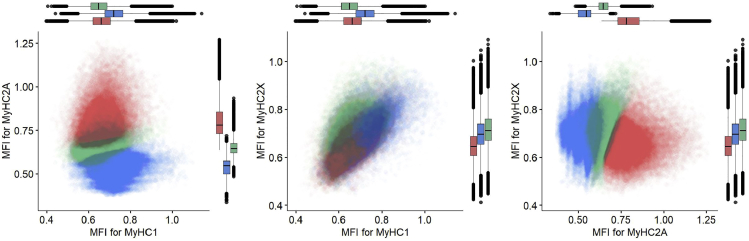
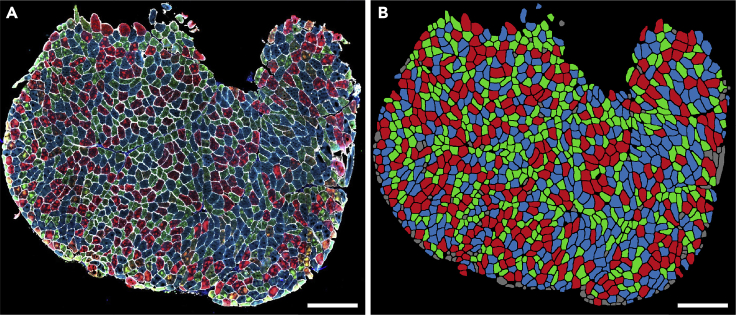
Skeletal muscles are composed of different myofiber types characterized by the expression of myosin heavy chain isoforms, which can be affected by physical activity, aging, and pathological conditions. Here, we present a step-by-step high-throughput semi-automated approach for performing myofiber type quantification of entire human or mouse muscle tissue sections, including immunofluorescence staining, image acquisition, processing, and quantification. For complete details on the use and execution of this protocol, please refer to Abbassi-Daloii et al. (2022).1.

Keywords: High-Throughput Screening; Microscopy.


Conflict of interest statement

Declaration of interests H.E.K. reports research support from Philips Healthcare and trial support from ImagingDMD. No personal fees are received, and all revenues go to the LUMC.

Figures

None
Graphical abstract
Figure 1
Figure 1
The spectra viewer for possible fluorophore combinations Each graph represents the excitation spectra (dashed line) and emission spectra (solid line) of four different fluorophores specified in the boxes. These fluorophores have a minimal spectrum overlap showing their combination can be used for multi-channel imaging. Note: In this protocol, we use Alexa Fluor® 488 and Alexa Fluor® 750 as secondary antibodies for the myofiber staining.
Figure 2
Figure 2
A representative image of muscle cryosection The green arrow shows an area with cross-sections of myofibers, while the red arrow represents an area with longitudinal sections of myofibers. These regions with longitudinal sections are automatically excluded from the analyses later in the protocol. Scale bar 500 μm.
Figure 3
Figure 3
A representative immunostaining image The left image shows the entire section, in the red box is a zoom-in image of the composite image and each myosin heavy chain isoform and laminin separately. Scale bar 500 μm.
Figure 4
Figure 4
Shading correction (A and B) A representative image before shading correction (A) and after shading correction (B). Scale bar 500 μm.
Figure 5
Figure 5
Tissue mask generation (A) An automated tissue mask (thin yellow line). (B) The adjusted mask excludes staining artifacts on the edges, out-of-focus regions, scratches, and dirt objects. Scale bar 500 μm.
Figure 6
Figure 6
Feature selection and export settings in Ilastik (A and B) The overview of features that should be selected (A) and the required settings for the Export Image Settings (B) for the pixel classification algorithm in Ilastik.
Figure 7
Figure 7
Training the classifier (A) The annotation of the pixels which belong to the ‘myofiber boundary’ (yellow) and ‘not myofiber boundary’ (blue). (B) result of the pixel classification showing the probability for each pixel belonging to the ‘myofiber boundary’ class (ranging from 0 in black, to 1 in white).
Figure 8
Figure 8
The ROI generation A representative image of myofiber ROI segmentation. Scale bar 500 μm.
Figure 9
Figure 9
The distribution of three measurements defined to assess segmentation certainty (A and B) The density plots of Mean, Mean_boundary, and StdDev_boundary across all the samples before (panel A) and after filtering (panel B).
Figure 10
Figure 10
The CSA distribution in each muscle (A and B) The CSA density plot before (A) and after (B) filtering. Here, we include ROIs with 10th percentile < CSA < 99th percentile. In this protocol, we used human samples collected from six leg muscles, gracilis (GR), semitendinosus (ST), rectus femoris (RF), vastus lateralis (VL), vastus medialis (VM), and gastrocnemius lateralis (GL) muscles. We also included biopsies from the middle (STD) and distal (STM) end of the semitendinosus muscle to investigate differences within one muscle. For this dataset, we tested different thresholds. Visualizing the myofibers excluded, we realized that if we exclude more than 1% on the right side, we would filter out ‘real’ myofibers (visual base). The small non-myofiber ROIs are not entirely excluded, but if we exclude more than 10% from the left (small ROIs), we would also filter out ‘real’ myofibers.
Figure 11
Figure 11
The circularity distribution in each muscle (A and B) The circularity density plot before (A) and after (B) filtering.
Figure 12
Figure 12
Visualization of myofiber filtering (A) Immunostained images of two muscle sections. (B) Visualization of excluded myofibers after filtering for segmentation certainty (black), CSA (dark gray), and circularity (light gray). Scale bar 500 μm.
Figure 13
Figure 13
Myofiber types clustering example Each dot represents a myofiber. In the dataset used for this protocol, we found three main clusters. Each myofiber cluster has a major MyHC isoform: MyHC2A is the major isoform in Cluster 1 (red), MyHC1 is the major isoform in cluster 2 (blue) and MyHC2X is the major isoform in cluster 3 (green). Boxplots show the MFI of the corresponding MyHC isoforms in three different clusters.
Figure 14
Figure 14
Visualization of myofiber clusters (A) Immunostained images of a muscle section. (B) Myofibers assigned to Cluster 1, Cluster 2, and Cluster 3 are depicted in red, blue, and green, respectively. Myofibers assigned to the small clusters or filtered in the filtering steps are shown in gray. Panel B was generated by visualization of the clustering result using the ImageJ macro “6.Visual_Check_Filtering.ijm”, followed by a colorization step using image editing software. Scale bar 500 μm.

References

    1. Abbassi-Daloii T., el Abdellaoui S., Voortman L.M., Veeger T., Cats D., Mei H., Meuffels D.E., van Arkel E., ’t Hoen P.A.C., Kan H.E., Raz V. A transcriptome atlas of leg muscles from healthy human volunteers reveals molecular and cellular signatures associated with muscle location. bioRxiv. 2022 doi: 10.1101/2022.06.01.494335. Preprint at. - DOI - PMC - PubMed
    1. Rao V.V., Mohanty A. Immunohistochemical identification of muscle fiber types in mice tibialis anterior sections. Bio. Protoc. 2019;9:e3400. doi: 10.21769/BioProtoc.3400. - DOI - PMC - PubMed
    1. Waisman A., Norris A.M., Elías Costa M., Kopinke D. Automatic and unbiased segmentation and quantification of myofibers in skeletal muscle. Sci. Rep. 2021;11:11793. doi: 10.1038/s41598-021-91191-6. - DOI - PMC - PubMed
    1. Kastenschmidt J.M., Ellefsen K.L., Mannaa A.H., Giebel J.J., Yahia R., Ayer R.E., Pham P., Rios R., Vetrone S.A., Mozaffar T., Villalta S.A. QuantiMus: a machine learning-based approach for high precision analysis of skeletal muscle morphology. Front. Physiol. 2019;10:1416. doi: 10.3389/fphys.2019.01416. - DOI - PMC - PubMed
    1. Bindellini D., Voortman L.M., Olie C.S., van Putten M., van den Akker E., Raz V. Discovering fiber type architecture over the entire muscle using data-driven analysis. Cytom. A. 2021;99:1240–1249. doi: 10.1002/cyto.a.24465. - DOI - PMC - PubMed

Publication types