. 2023 Mar 7;120(10):e2219439120.
doi: 10.1073/pnas.2219439120. Epub 2023 Feb 28.

Mouse models of human multiple myeloma subgroups

Affiliations

Mouse models of human multiple myeloma subgroups

Wiebke Winkler et al. Proc Natl Acad Sci U S A. .

Abstract

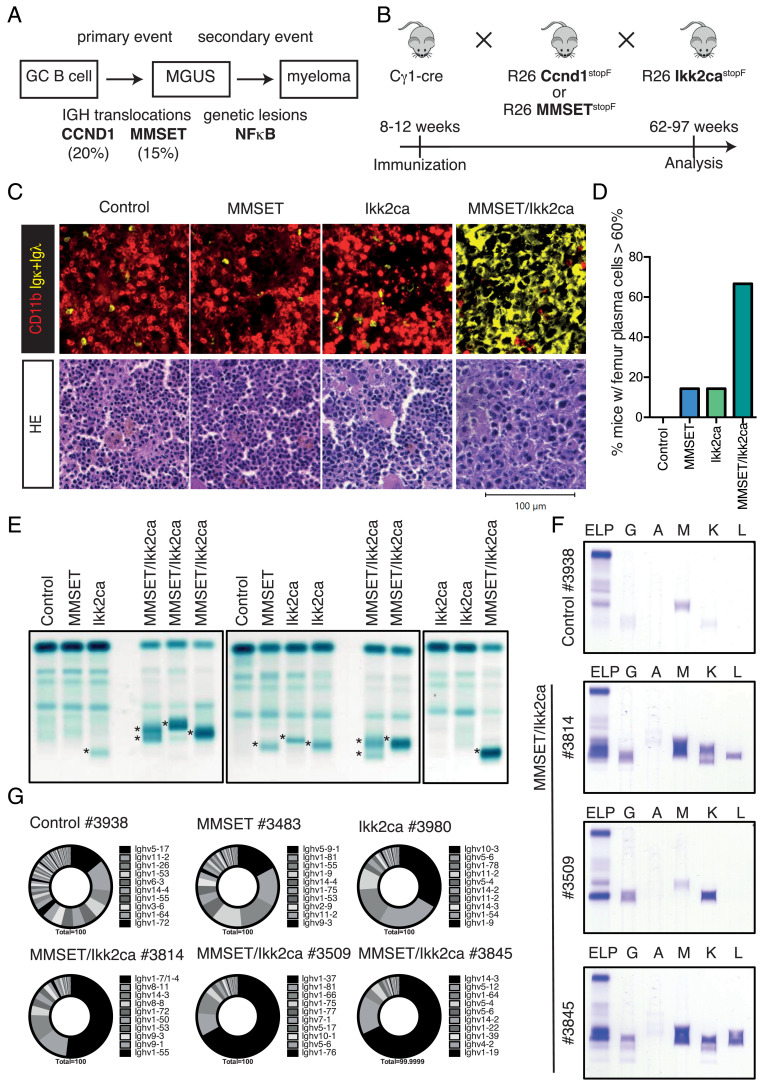
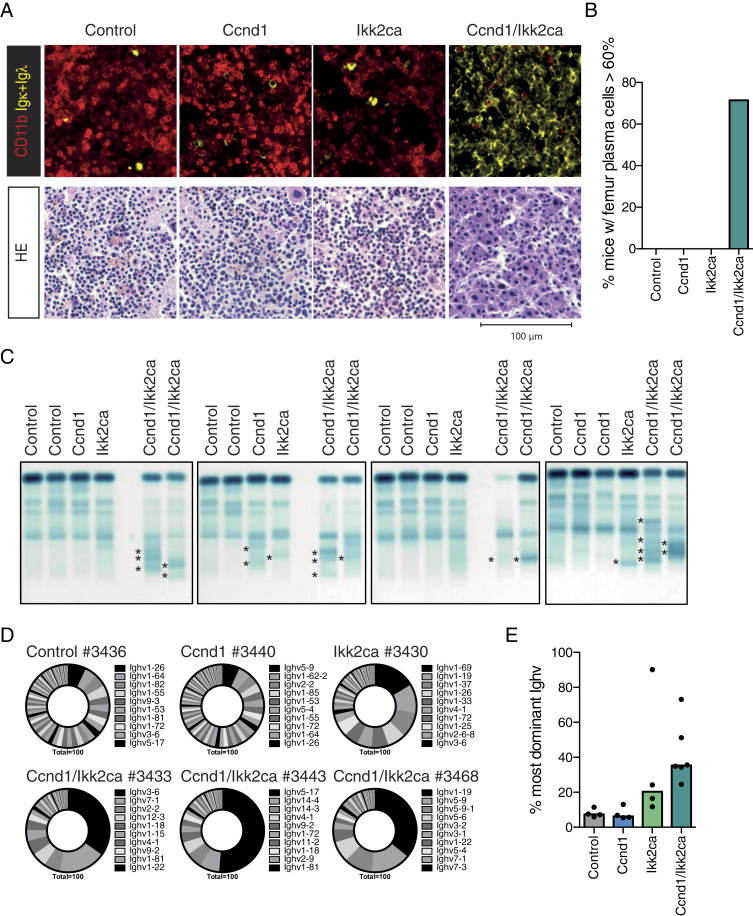
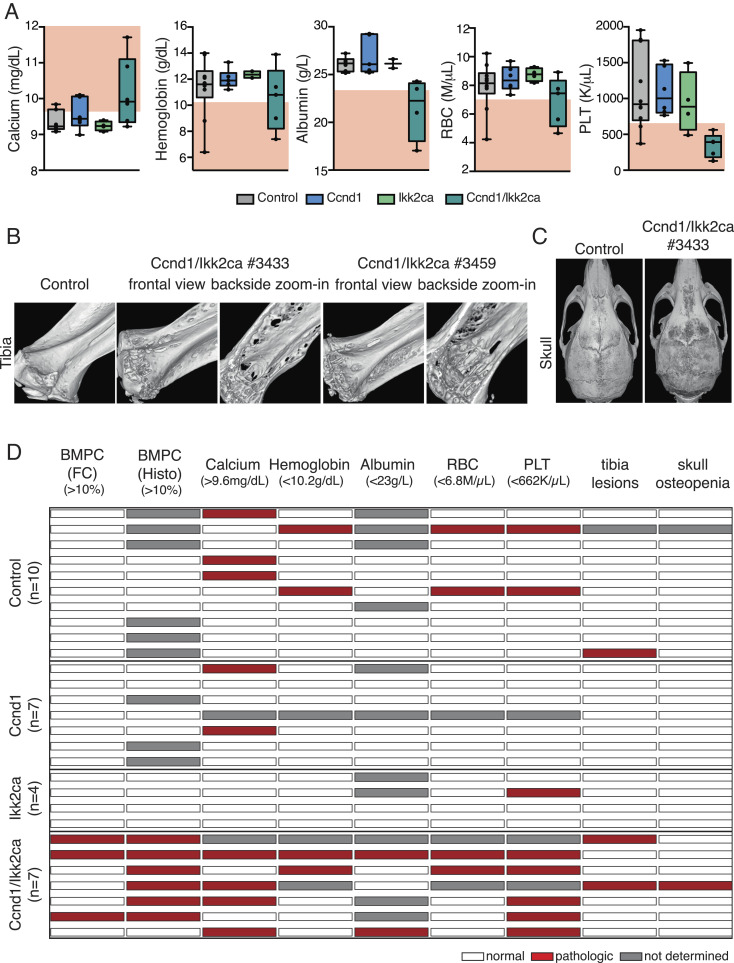
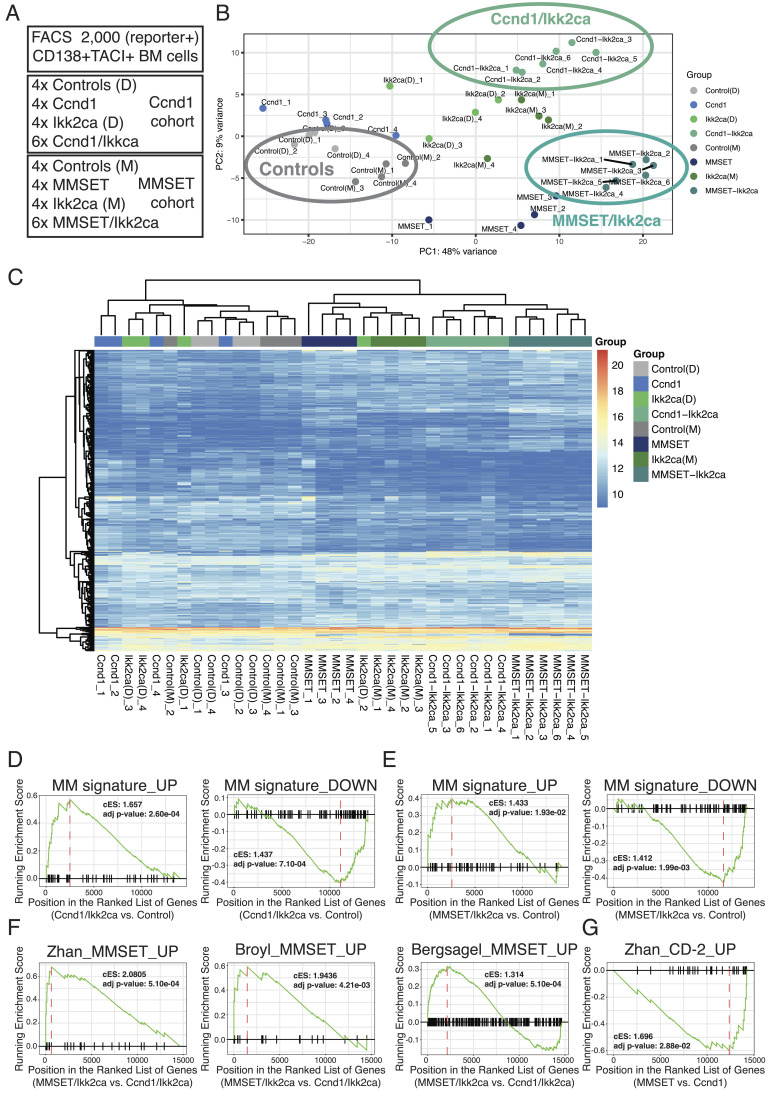
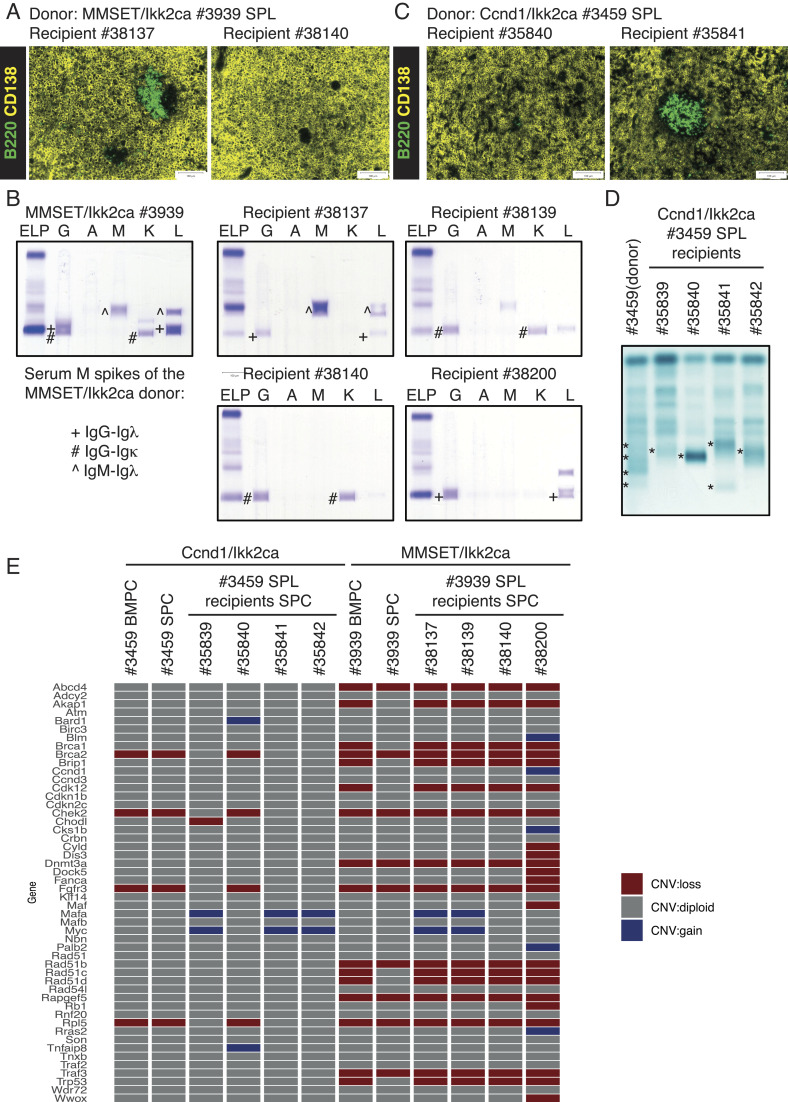
Multiple myeloma (MM), a tumor of germinal center (GC)-experienced plasma cells, comprises distinct genetic subgroups, such as the t(11;14)/CCND1 and the t(4;14)/MMSET subtype. We have generated genetically defined, subgroup-specific MM models by the GC B cell-specific coactivation of mouse Ccnd1 or MMSET with a constitutively active Ikk2 mutant, mimicking the secondary NF-κB activation frequently seen in human MM. Ccnd1/Ikk2ca and MMSET/Ikk2ca mice developed a pronounced, clonally restricted plasma cell outgrowth with age, accompanied by serum M spikes, bone marrow insufficiency, and bone lesions. The transgenic plasma cells could be propagated in vivo and showed distinct transcriptional profiles, resembling their human MM counterparts. Thus, we show that targeting the expression of genes involved in MM subgroup-specific chromosomal translocations into mouse GC B cells translates into distinct MM-like diseases that recapitulate key features of the human tumors, opening the way to a better understanding of the pathogenesis and therapeutic vulnerabilities of different MM subgroups.

Keywords: Cyclin D1/MMSET; chromosomal translocations; conditional mouse models; multiple myeloma; translocation subgroups.


Conflict of interest statement

The authors declare no competing interest.

Figures

Fig. 1.
Fig. 1.
Aged MMSET/Ikk2ca mice develop a clonally restricted plasma cell expansion. (A) Simplified scheme of multistep human MGUS-MM development. (B) Outline for the generation of MM subgroup-specific mouse cohorts. Control (i.e., Cγ1-cre only, floxed R26 alleles or Cγ1-cre; R26 BFPstopF mice), single-mutant (Ccnd1, MMSET, or Ikk2ca), and double-mutant (Ccnd1/Ikk2ca or MMSET/Ikk2ca) mice were immunized once with NP-CGG at 8 to 12 wk of age, monitored for tumor development and killed upon onset of disease-defining endpoints (between 62 and 97 wk of age). (CUpper panel: representative immunofluorescence images of femur sections stained with α-CD11b (red, myeloid cells) and α-Igκ/α-Igλ (yellow, plasma cells). Lower panel: representative HE-stained femur sections. (D) Graph depicts the percentage of mice that demonstrated ≥60% plasma cell infiltration within the femur section by pathologic assessment following HE staining; summary of SI Appendix, Table S1. (E) Representative serum protein electrophoresis (SPEP) of MMSET cohort mice; M spikes are marked with an asterisk. (F) SPEP coupled with immunofixation to determine the immunoglobulin isotype of the detected M proteins. (G) Ighv gene usage in sorted BM plasma cells of MMSET cohort mice. Pie charts show the fraction of individual Ighv genes among all annotated Ighv gene reads as determined by RNA-Seq. The 10 most dominantly expressed Ighv genes are listed (ordered clockwise).
Fig. 2.
Fig. 2.
The plasma cell outgrowth in aged MMSET/Ikk2ca mice is accompanied with MM-like pathologies. (A) Graphs depicting serum calcium, hemoglobin, serum albumin, red blood cell (RBC), and platelet (PLT) values of MMSET cohort mice. The pathologic range of either parameter (calcium > 9.6 mg/dL; hemoglobin < 10.2 g/dL; albumin* < 23 g/L; RBC < 6.8 M/µL; PLT < 662 K/µL) is marked in red (reference: Jackson Laboratory; 78 wk old C57BL/6J; *the lower limit for albumin had to be adjusted for our cohort to discern healthy and diseased mice for animals >78 wk). (B and C) Representative 3D images reconstructed from µCT scans of tibiae (B) and skulls (C). Tibiae are shown in frontal view (B; Left) and as zoomed-in image (B; Right) to demonstrate that lesions destroyed the cortex. (D) Heatmap summarizing the assessment of selected MM-associated parameters. Columns include from Left to Right: ≥10% of BM plasma cells (BMPC) measured by flow cytometry (FC); ≥10% BMPC in the femur biopsy (histology); serum calcium, hemoglobin, serum albumin, RBC, PLT, tibia lesions, and skull osteopenia. For blood parameters, the pathologic range is indicated in brackets (same reference values as before). Each row represents an individual mouse, ordered by genotype. White marks indicate that the parameter is within the normal range, red marks indicate that the parameter is within the defined pathologic range, and gray marks indicate that the parameter was not measured. For the µCT analysis, red marks indicate mice with ≥3 lesions within the tibiae and diffuse osteopenia of the skull.
Fig. 3.
Fig. 3.
Ccnd1/Ikk2ca mice show an oligoclonal plasma cell outgrowth with age. (AUpper panel: representative immunofluorescence images of femur sections stained with α-CD11b (red, myeloid cells) and α-Igκ/α-Igλ (yellow, plasma cells). Lower panel: representative HE-stained femur sections. (B) Graph shows the fraction of mice that demonstrated ≥60% plasma cell infiltration within the femur section by pathologic assessment following HE staining; summary of SI Appendix, Table S3. (C) Representative serum protein electrophoresis (SPEP) of Ccnd1 cohort mice; M spikes are marked with an asterisk. (D) Ighv gene usage in sorted CD138+TACI+ BM plasma cells of Ccnd1 cohort mice. Pie charts show the fraction of individual Ighv genes among all annotated Ighv gene reads as determined by RNA-Seq. The 10 most dominantly expressed Ighv genes are listed (ordered clockwise). (E) Graph illustrating the percentage of the most dominant Ighv gene per mouse of the indicated genotypes.
Fig. 4.
Fig. 4.
Ccnd1/Ikk2ca mice present with MM-associated pathologies. (A) Graphs depicting serum calcium, hemoglobin, serum albumin, red blood cell (RBC), and platelet (PLT) values of Ccnd1 cohort mice (as in Fig. 2A). (B and C) 3D images reconstructed from µCT scans of tibiae (B) and skulls (C). Tibiae are shown in frontal view (B, Left) and as zoomed-in image (B, Right) to demonstrate that lesions destroyed the cortical bone. (D) Heatmap summarizing the assessment of selected MM-associated parameters. Columns include from Left to Right: ≥10% of BM plasma cells (BMPC) measured by flow cytometry (FC); ≥10% BMPC in the femur biopsy (histology); serum calcium, hemoglobin, serum albumin, RBC, PLT, tibia lesions, and skull osteopenia. For blood parameters the pathologic range is indicated in brackets (as in Fig. 2D). Each row represents an individual mouse, ordered by genotype. White marks indicate that the parameter is within the normal range, red marks indicate that the parameter is within the defined pathologic range and gray marks indicate that the parameter was not measured. For the µCT analysis, red marks indicate mice with ≥3 lesions within the tibiae and diffuse osteopenia of the skull.
Fig. 5.
Fig. 5.
The transgenic mouse plasma cells express human MGUS/MM signature genes. (A) Overview of RNA-Seq samples. (B and C) Principal component analysis (B) and unsupervised hierarchical clustering (C) of control (Cγ1-cre or floxed R26 alleles), single-mutant (Ccnd1, MMSET, or Ikk2ca), and double-mutant (Ccnd1/Ikk2ca or MMSET/Ikk2ca) BM plasma cells using the top 500 genes showing the highest variability in expression across all samples. (DG) Graphical representations of gene set enrichment analysis results employing the tmod algorithm. (D and E) The x-axis shows the ranked gene list (ordered from most up- to most down-regulated) when comparing Ccnd1/Ikk2ca (D) or MMSET/Ikk2ca (E) to control BM plasma cells. The tested gene sets represent genes differentially up- (MM signature_UP) or down-regulated (MM signature_DOWN) in human MGUS/MM cells versus normal human plasma cells (40, 41). (F) The x-axis shows the ranked gene list (ordered from most up- to most down-regulated) when comparing MMSET/Ikk2ca versus Ccnd1/Ikk2ca BM plasma cells. The tested gene sets represent genes specifically up-regulated in the human t(4;14)/MMSET subgroup compared to the other MM subgroups (–17). (G) The x-axis shows the ranked gene list (ordered from most up- to most down-regulated) when comparing MMSET versus Ccnd1 BM plasma cells. The tested gene set represents genes specifically up-regulated in the human t(11;14)-associated CD-2 subgroup compared to the other MM subgroups (16).
Fig. 6.
Fig. 6.
The transgenic mouse plasma cells can be propagated in vivo and exhibit genetic aberrations that are associated with human MM. Total spleen cells of a MMSET/Ikk2ca (#3939) and a Ccnd1/Ikk2ca (#3459) donor mouse were transferred into sublethally irradiated (3 Gy) Rag2-Il2r-immunodeficient recipients, which were analyzed 30 to 34 wk after the transplantation. (A and C) Representative immunofluorescence images of two MMSET/Ikk2ca #3939 recipient spleens (A) and two Ccnd1/Ikk2ca #3459 recipient spleens (C) stained with α-B220 (green, B cells) and α-CD138 (yellow, plasma cells). (B) SPEP coupled to immunofixation of the MMSET/Ikk2ca donor #3939 and its four recipients to determine the immunoglobulin isotypes of the M proteins (corresponding heavy and light chains are marked by the same symbol; G—IgG, A—IgA, M—IgM, K—Igκ, L—Igλ). (D) SPEP of the Ccnd1/Ikk2ca donor #3459 and its corresponding four recipients; M spikes are marked (*). (E) Double-mutant (BFP+GFP+) plasma cells were sorted from all four Ccnd1/Ikk2ca #3459 and MMSET/Ikk2ca #3939 recipients’ spleens (SPC) as well as the donors’ spleen (SPC) and bone marrow (BMPC) and subjected to WES to determine copy number variations (CNVs) (reference: myeloid cells sorted from the donor mice BM). The graph depicts genes shown to be frequently affected by CNVs in human MM (42) and their copy number status (loss—red, gain—blue, diploid—gray) in the respective mouse plasma cells.

Similar articles

Cited by

References

    1. Landgren O., et al. , Monoclonal gammopathy of undetermined significance (MGUS) consistently precedes multiple myeloma: A prospective study. Blood 113, 5412–5417 (2009). - PMC - PubMed
    1. Rajkumar S. V., et al. , International myeloma working group updated criteria for the diagnosis of multiple myeloma. Lancet Oncol. 15, e538–e548 (2014). - PubMed
    1. Avet-Loiseau H., et al. , 14q32 translocations and monosomy 13 observed in monoclonal gammopathy of undetermined significance delineate a multistep process for the oncogenesis of multiple myeloma. Cancer Res. 59, 4546–4550 (1999). - PubMed
    1. Fonseca R., et al. , Genomic abnormalities in monoclonal gammopathy of undetermined significance. Blood 100, 1417–1424 (2002). - PubMed
    1. Kaufmann H., et al. , Both IGH translocations and chromosome 13q deletions are early events in monoclonal gammopathy of undetermined significance and do not evolve during transition to multiple myeloma. Leukemia 18, 1879–1882 (2004). - PubMed

Publication types