. 2023 Mar 7;120(10):e2214888120.
doi: 10.1073/pnas.2214888120. Epub 2023 Feb 28.

Metastasis from the tumor interior and necrotic core formation are regulated by breast cancer-derived angiopoietin-like 7

Affiliations

Metastasis from the tumor interior and necrotic core formation are regulated by breast cancer-derived angiopoietin-like 7

Ami Yamamoto et al. Proc Natl Acad Sci U S A. .

Abstract

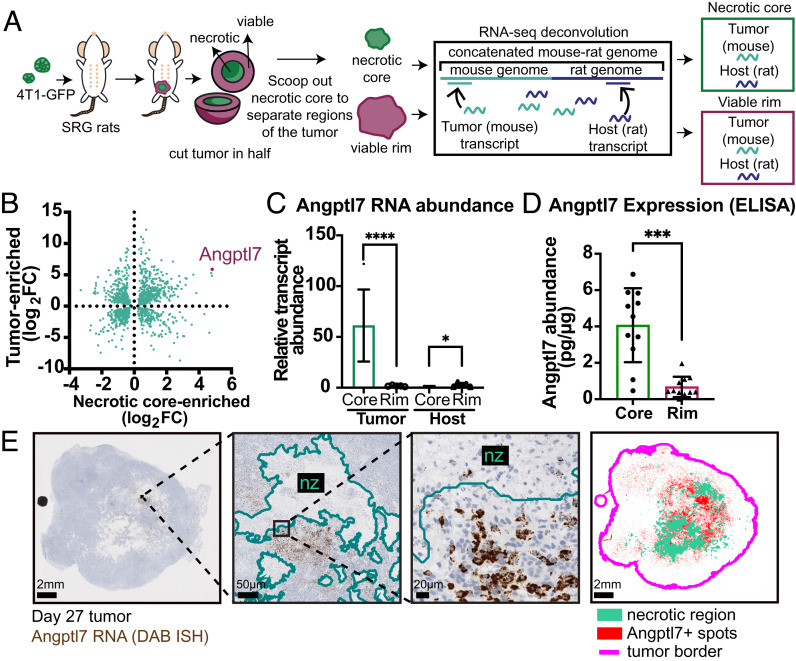
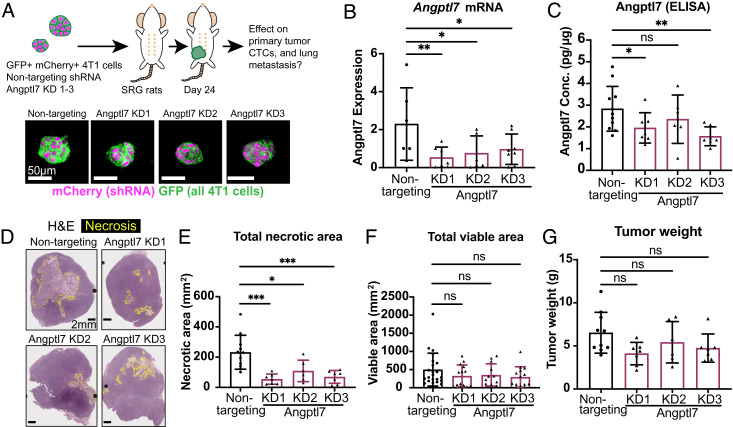
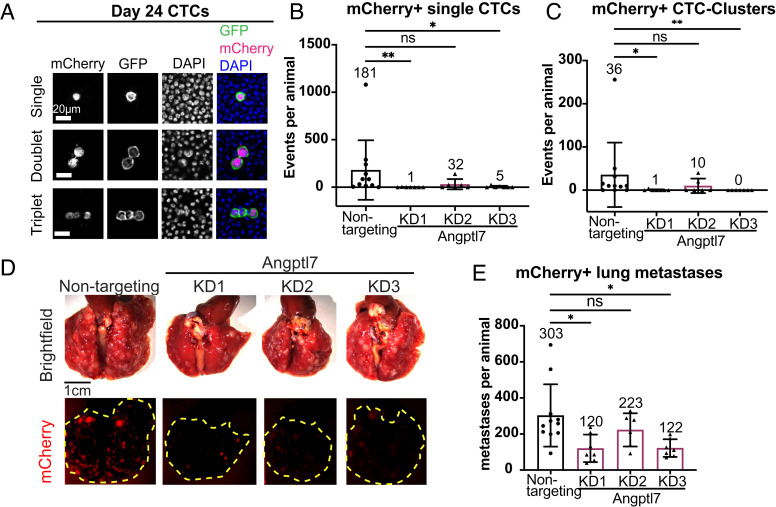
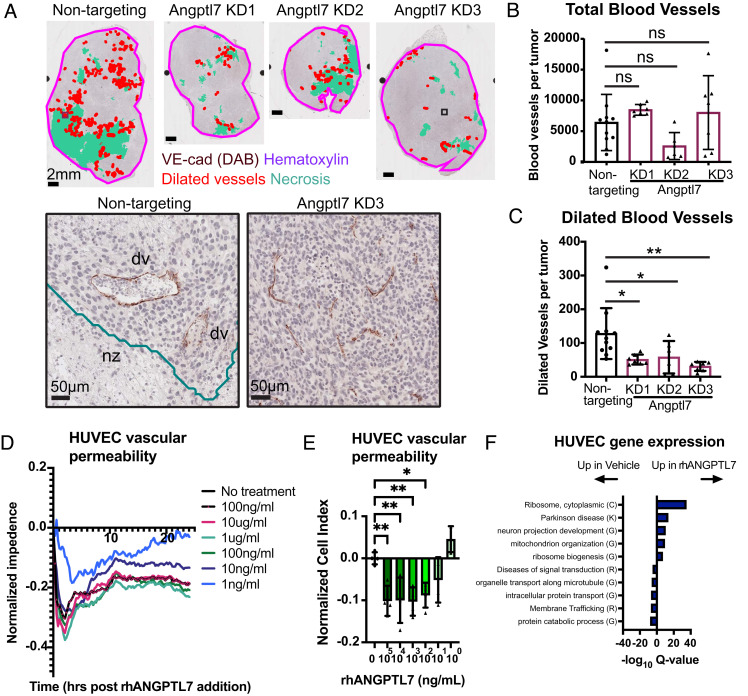
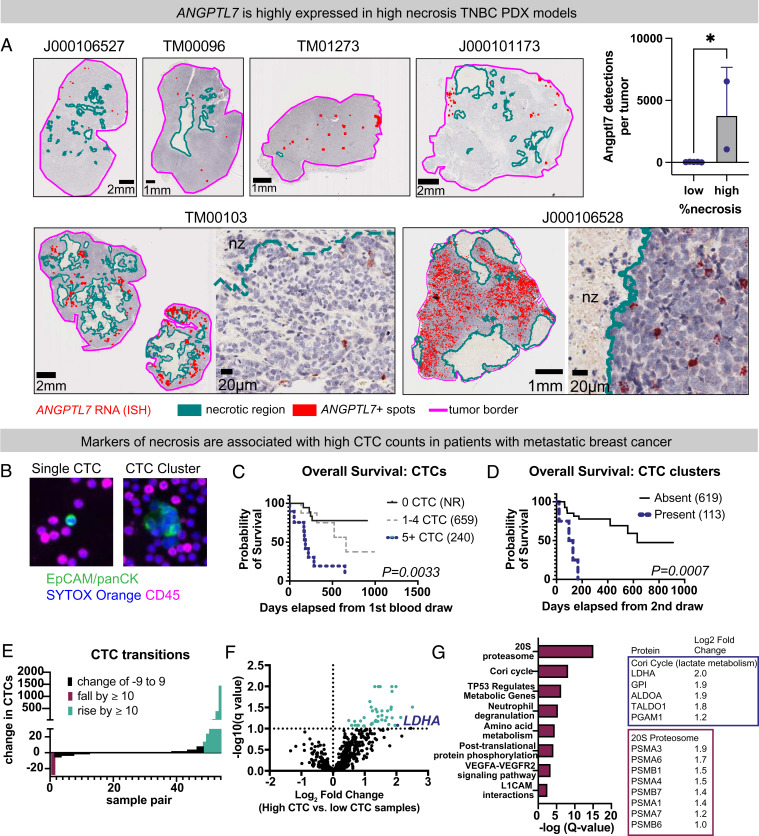
Necrosis in the tumor interior is a common feature of aggressive cancers that is associated with poor clinical prognosis and the development of metastasis. How the necrotic core promotes metastasis remains unclear. Here, we report that emergence of necrosis inside the tumor is correlated temporally with increased tumor dissemination in a rat breast cancer model and in human breast cancer patients. By performing spatially focused transcriptional profiling, we identified angiopoietin-like 7 (Angptl7) as a tumor-specific factor localized to the perinecrotic zone. Functional studies showed that Angptl7 loss normalizes central necrosis, perinecrotic dilated vessels, metastasis, and reduces circulating tumor cell counts to nearly zero. Mechanistically, Angptl7 promotes vascular permeability and supports vascular remodeling in the perinecrotic zone. Taken together, these findings show that breast tumors actively produce factors controlling central necrosis formation and metastatic dissemination from the tumor core.

Keywords: angiopoietin-like 7; breast cancer; circulating tumor cells; metastasis; necrotic core.


Conflict of interest statement

A.Y., Y.H., B.A.K., and K.J.C. are inventors on a pending patent application related to this work.

Figures

Fig. 1.
Fig. 1.
CTC transition is temporally associated with tumor necrosis, dilated vessels, and perinecrotic intravascular emboli. (A) Experimental schema. 4T1 mouse mammary tumor cells labeled with cytoplasmic GFP (4T1-GFP) were orthotopically transplanted into a single #4 mammary fat pad of SRG rats. Blood and tissues were harvested at day 13 (n = 7), 17 (n = 7), 22 (n = 8), and 27 (n = 8) posttransplantation. (B and C) Single CTC and CTC clusters per animal. Box plots shown with mean values labeled. (D) Representative hematoxylin and eosin (H&E) stains of day 13 to 27 rat tumors. (Left) Necrotic region indicated with yellow border. (Right,  Insets) of necrotic and nonnecrotic regions from a day 27 tumor. (E and F) Total necrotic area and total viable area were determined by H&E. Mean ± SD. (G) Representative day 13 to day 27 rat tumors stained for VE-cadherin (DAB) and counterstained with hematoxylin. (Left) low power views. Necrotic regions shown in turquoise, dilated vessels in red, and tumor border in magenta. (Right) example of a dilated and nondilated vessel. Dv = dilated vessel. Nz = necrotic zone. (H) Number of VE-cadherin+ dilated blood vessels. Mean ± SD. (I and J) Representative immunofluorescent images of GFP+ tumor emboli inside VE-cadherin+ blood vessel from thin (10 µm) and thick (30 µm) tumor sections. (I, Left) low power image of perinecrotic zone. Insets showing high magnification of tumor cell cluster (tcc) within a dilated vessel (dv) (I, Middle and Right). (J) Confocal images from z-stack showing tumor cell cluster (tcc) within dilated vessel (dv). Xy, xz, and yz cross-sections shown. Magenta: VE-cadherin; Red: 594 conjugated lectin; Blue: DAPI; Green: tumor cells expressing GFP (membrane GFP in I & cytoplasmic GFP in J. nz = necrosis. P-values for B, C, E, F, and H determined by one-way ANOVA.
Fig. 2.
Fig. 2.
Angptl7 is a tumor-derived, necrotic core-enriched transcript localized to the perinecrotic region of breast tumor. (A) Experimental schema. 4T1-GFP tumor cells were orthotopically transplanted into a single fat pad of SRG rats and collected between day 27 and day 30 (n = 5 animals). The harvested tumors were cut in half, and macrodissected to separate the necrotic core region from the nonnecrotic rim of the primary tumors. RNA was extracted and subjected to next-generation sequencing. Sequences were aligned to concatenated rat-mouse combined genome, and mouse and rat genes were deconvoluted from each other. (B) Mouse orthologs were identified for all rat genes and the relative RNA abundance per gene between tumor and host compartments was determined. The plot shows all genes with both differential enrichment for core:rim and for tumor:host with FDR ≤ 0.01. (C) Relative RNA abundance of Angptl7 based on RNA-seq. Average expression and q-value (FDR) from multiple comparisons indicated on the graph. (D) ELISA quantification of Angptl7 protein abundance of the necrotic core and nonnecrotic rim regions of 4T1 tumors. Student t test. Mean ± SD. (E) Representative image of Angptl7 RNA in situ hybridization (ISH) of day 27 4T1 tumors. (Left) raw Angptl7 RNA ISH (brown). (Right) Detection by QuPath. Red: detection of Angptl7+ cells, turquoise: necrotic region, pink: tumor border. *P <0.05, **P < 0.01, ***P < 0.001, and ****P < 0.0001.
Fig. 3.
Fig. 3.
Suppression of Angptl7 normalizes tumor necrosis. (A) Experimental schema. 4T1 tumor cells labeled with membrane GFP and transduced with Angplt7 shRNA or nontargeting control were orthotopically transplanted into a single mammary fat pad of SRG rats. shRNA contained an mCherry tag, so cells expressing shRNA have cytoplasmic mCherry label. Blood, tumor, and lungs were collected. Nontargeting control (n = 11), Angptl7 knockdown KD1 (n = 7), Angptl7 KD2 (n = 6), Angptl7 KD3 (n = 7). (B) In vivo knockdown confirmation by qPCR based on tumor core. (C) ELISA confirmation by in vivo knockdown. Lysates were made from tumor necrotic core from Angptl7 knockdown and nontargeting control tumor cell transplantation experiments. (D) Representative hematoxylin and eosin (H&E) staining of primary tumors for Angptl7 knock down tumors and nontargeting control. Yellow borders indicate the necrotic regions. (E and F) Total necrotic area and total viable area based on H&E staining of Angptl7 KD and nontargeting control tumor. (G) Tumor weight of Angptl7 KD and nontargeting control tumor. All graphs shown display mean ± SD. Mean values shown on graphs. P-values for B and C determined by Mann–Whitney test; for EG determined by ANOVA. *P <0.05, **P < 0.01, ***P < 0.001, and ****P < 0.0001.
Fig. 4.
Fig. 4.
Suppression of Angptl7 reduces CTC abundance and distant lung metastases. (A) Representative images of single CTCs and CTC clusters from nontargeting control. Cells are mCherry-positive if they express shRNAs. 4T1 cells are labeled by membrane GFP. DAPI marks nuclei. (B and C) mCherry-positive single CTC and CTC cluster abundance in Angptl7 knockdown and nontargeting control. (D) Representative images of lung metastases from Angptl7 knockdown or nontargeting control transplantation (4T1 cells). Cells expressing the shRNAs express mCherry. (E) mCherry-positive lung metastasis count for Angptl7 knockdown and nontargeting control. Mean ± SD. All graphs shown display mean ± SD. Mean values shown on graphs. P-values for B, C, and E determined by ANOVA. *P <0.05, **P < 0.01, ***P < 0.001, and ****P < 0.0001.
Fig. 5.
Fig. 5.
Angptl7 regulates blood vessel morphology and vascular permeability. (A) Representative images of dilated VE-cadherin+ blood vessels Angptl7 knockdown and nontargeting control tumors. Immunohistochemistry for VE-cadherin (DAB) (brown) counterstained with hematoxylin. Red: dilated vessels, turquoise: necrotic region, pink: tumor border. (Insets): vessel morphology in nontargeting control and Angptl7 knockdown. (B) Number of total VE-cadherin+ blood vessels in the Angptl7 knockdown and nontargeting control tumors. Mean ± SD. (C) Number of dilated VE-cadherin+ blood vessels in the Angptl7 knockdown and nontargeting control tumors. Mean ± SD. (D and E) Human endothelial cell (HUVEC) vascular permeability in response to ANGPTL7 recombinant protein (rhANGPTL7). Vascular permeability was measured as normalized impedance over time. n = 4 biological replicates. Shown is mean temporal response (D) and normalized cell index at 1 h (E). (F) Metascape analysis of gene enrichment. HUVEC cells were treated with rhANGPTL7 for 24 h. RNA-seq identified 741 up-regulated genes and 500 genes down-regulated with rhANGPTL7 treatment with P-value cutoff ≤ 0.01. Enrichments reported as -log Q-values. All P-values determined by one-way ANOVA. *P <0.05, **P < 0.01, ***P < 0.001, and ****P < 0.0001.
Fig. 6.
Fig. 6.
ANGPTL7 is expressed in high necrosis human triple-negative breast cancers and necrosis markers correlate with CTC dissemination in breast cancer patients. (A) ANGPTL7 RNA ISH performed on tumor sections from human breast PDX tumors transplanted into NSG mice. All tumor models were invasive ductal carcinomas and confirmed triple-negative for ER, PR, and HER2 on PDX tumor sections. Qupath detections shown. Turquoise: necrotic region, red: ANGPTL7-positive detections, pink: tumor border. (Insets) show raw ANGPTL7 RNA ISH in red. (Right) Bar graph comparing tumors with low necrosis (five sections from four models) and high necrosis (two sections from two models). High necrosis defined as >15% necrosis by area. P-value determined by unpaired t test. (B) Representative single CTC and CTC cluster from clinical vignette in SI Appendix, Fig. S6. EpCAM/pan-CK, epithelial cells; CD45, immune cells; SYTOX Orange, nucleic acid stain. (C) Overall survival according to CTC enumeration at baseline. Median overall survival reported in parentheses. NR = not reached. P-value determined by Mantel–Cox log-rank test. (D) Overall survival according to presence or absence of CTC-clusters. Landmark analysis from 2nd blood draw was performed. Median overall survival reported in parentheses. P-value determined by Mantel–Cox log-rank test. (E) Waterfall plot showing changes in CTC abundance between time points, sorted by magnitude. (F) Tandem-mass tag mass spectrometry of high vs. low-CTC samples. Volcano plot shows the 46 plasma proteins enriched in three high-CTC samples compared with 13 low CTC samples. Proteins with Q-values less than 10%. False discovery rate determined by two-stage set-up method by Benjamini, Krieger, and Yekutieli. (G) Metascape analysis of CTC-associated proteins reported by -log Q-value. (Right) Proteins with fold-enrichment that make up core enrichments for Cori cycle and 20S proteasome. *P <0.05, **P < 0.01, ***P < 0.001, and ****P < 0.0001.

References

    1. Ganesh K., Massagué J., Targeting metastatic cancer. Nat. Med. 27, 34–44 (2021). - PMC - PubMed
    1. Kang Y., Pantel K., Tumor cell dissemination: Emerging biological insights from animal models and cancer patients. Cancer Cell 23, 573–581 (2013). - PMC - PubMed
    1. Sznurkowska M. K., Aceto N., The gate to metastasis: Key players in cancer cell intravasation. FEBS J. 289, 4336–4354 (2022). - PMC - PubMed
    1. Lambert A. W., Pattabiraman D. R., Weinberg R. A., Emerging biological principles of metastasis. Cell 168, 670 (2017). - PMC - PubMed
    1. Friedl P., Wolf K., Tumour-cell invasion and migration: Diversity and escape mechanisms. Nat. Rev. Cancer 3, 362–374 (2003). - PubMed

Publication types