. 2023 Feb 28;21(2):e3001926.
doi: 10.1371/journal.pbio.3001926. eCollection 2023 Feb.

Non-muscle myosins control radial glial basal endfeet to mediate interneuron organization

Affiliations

Non-muscle myosins control radial glial basal endfeet to mediate interneuron organization

Brooke R D'Arcy et al. PLoS Biol. .

Abstract

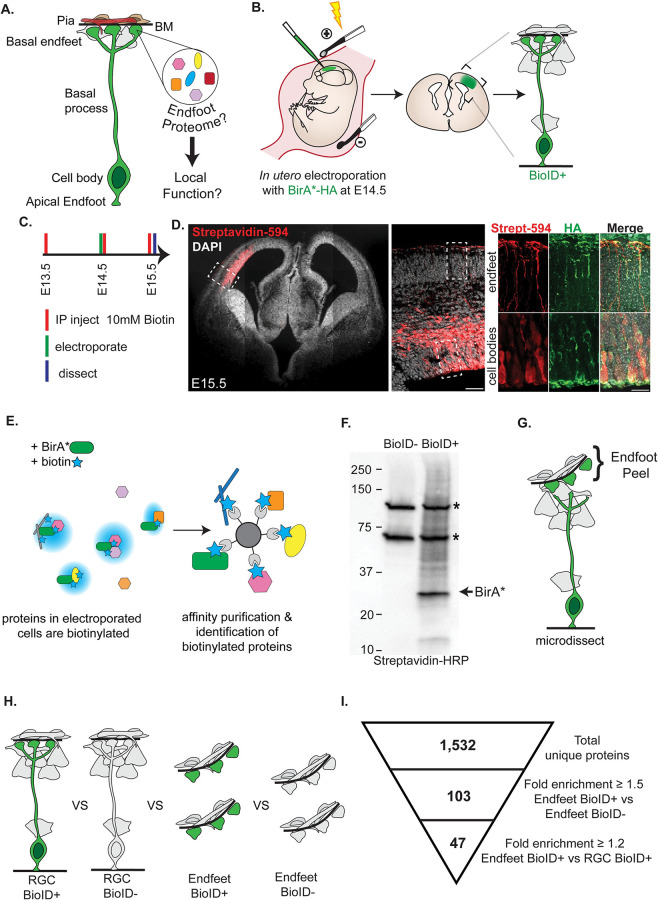
Radial glial cells (RGCs) are essential for the generation and organization of neurons in the cerebral cortex. RGCs have an elongated bipolar morphology with basal and apical endfeet that reside in distinct niches. Yet, how this subcellular compartmentalization of RGCs controls cortical development is largely unknown. Here, we employ in vivo proximity labeling, in the mouse, using unfused BirA to generate the first subcellular proteome of RGCs and uncover new principles governing local control of cortical development. We discover a cohort of proteins that are significantly enriched in RGC basal endfeet, with MYH9 and MYH10 among the most abundant. Myh9 and Myh10 transcripts also localize to endfeet with distinct temporal dynamics. Although they each encode isoforms of non-muscle myosin II heavy chain, Myh9 and Myh10 have drastically different requirements for RGC integrity. Myh9 loss from RGCs decreases branching complexity and causes endfoot protrusion through the basement membrane. In contrast, Myh10 controls endfoot adhesion, as mutants have unattached apical and basal endfeet. Finally, we show that Myh9- and Myh10-mediated regulation of RGC complexity and endfoot position non-cell autonomously controls interneuron number and organization in the marginal zone. Our study demonstrates the utility of in vivo proximity labeling for dissecting local control of complex systems and reveals new mechanisms for dictating RGC integrity and cortical architecture.


Conflict of interest statement

The authors have declared that no competing interests exist.

Figures

Fig 1
Fig 1. In vivo proximity labeling reveals proteins enriched in radial glial basal endfeet compared to the whole cell.
(A) Cartoon representation of RGC morphology (green) and BM (black), and pial niche composed of interneurons and Cajal–Retzius cells (grey), blood vessels (red), and fibroblasts (brown). (B) Cartoon schematic of RGC labeling by IUE. (C) Experimental timing of IP biotin injections, electroporation, and dissection. (D) (Left) Staining with Streptavidin-594 (red) showing biotin labeling in electroporated cells of an E15.5 brain. (Right) Colocalization of biotin (red) with HA tagged BirA* protein (green) in the cell bodies and endfeet of RCGs. (E) Cartoon of (Left) BirA* (green) labeling all proteins with biotin (blue) and (Right) affinity purification of biotinylated proteins with streptavidin beads. (F) Western blot probed with Streptavidin-HRP showing biotinylated proteins including BirA*. Asterisks denote endogenously biotinylated carboxylases. (G) Cartoon showing microdissection to physically separate RGC endfeet from cell bodies. (H) The 4 samples compared in our analysis (RGC BioID+, RGC BioID−, Endfeet BioID+, Endfeet BioID−). (I) Representation of criterion used to identify endfoot enriched proteins from the BioID data. n = 3 biological replicates per condition, 66–68 pooled endfoot preparations per replicate for endfoot samples, 6 cortices pooled per replicate for whole RGC samples. Scale bars (D): 500 μm, 50 μm, 20 μm (left to right). BM, basement membrane; IP, intraperitoneal; IUE, in utero electroporation; RGC, radial glial cell.
Fig 2
Fig 2. The endfoot proteome is enriched for ECM and cytoskeletal regulators, including NM IIA and B.
(A) STRING analysis of the 47 endfoot-enriched proteins. Dashed lines denote prominent protein classes. Cytoskeletal regulators indicated as blue circles. (B) GO analysis of the endfoot-enriched proteome showing all enriched categories with p ≤ 0.05. (C) Venn diagram comparing synapse proteome [36] (red) and endfoot proteome (green). (D) Venn diagram comparing synapse transcriptomes (yellow [37] and red [36]) and endfoot proteome (green). (E) Scatter plot depicting fold change vs. peptide count in the endfoot fraction for 47 endfoot-enriched proteins. Cytoskeletal regulators indicated as blue circles. (F) Bar graph showing protein fold change of endfeet vs. RGC for non-muscle myosin heavy and light chains, compared to average fold change of all proteins in endfeet (dashed line) and all endfoot enriched proteins (dotted line). (G) Cartoon representation of NM II structure, annotated with heavy and light chain isoforms identified in endfoot proteome. ELC, essential light chain, HC, heavy chain; RLC, regulatory light chain. (H) Cartoon representation of RGC and pial niche with box outlining the location of images in I and J. (I, J) Colocalization of MYH9 (red) (I) or MYH10 (red) (J) with endfeet (green) including orthogonal views. Endfeet marked by white dotted lines. Scale bar (I, J): 5 μm. n = 3 brains, 3 sections per brain (I, J). Data underlying graphs included in S1 Data. ECM, extracellular matrix; GO, Gene Ontology; NM II, non-muscle myosin II; RGC, radial glial cell.
Fig 3
Fig 3. Myh9 and Myh10 mRNAs localize to endfeet in complementary patterns that change across development.
(A, B) Colocalization of Myh9 smiFISH (white, A) or Myh10 smiFISH (white, B) with electroporated endfeet (green) at E15.5. (Left) Yellow arrows denote endfeet colocalized with smiFISH probes. Yellow box outlines area used for orthogonal views. (Right) Orthogonal views of colocalization. (C) Cartoon representation of RGC with boxes indicating cell body imaged in E and G and endfeet imaged in D and F. (D) Localization of Myh9 smiFISH puncta (white) in endfeet from E12.5 to E16.5. E14.5 to E16.5 endfeet (green) labeled using Nestin-EGFP mouse [46]. Note, EGFP does not clearly label endfeet at E12.5 and E13.5. Yellow dotted lines denote the border between the endfeet (below) and the pia (above). (E) Localization of Myh9 smiFISH puncta (white) in cell bodies from E12.5 to E16.5. Yellow dotted lines denote ventricular border. (F) Localization of Myh10 smiFISH puncta (white) in endfeet from E12.5 to E16.5. E14.5 to E16.5 endfeet (green) labeled using Nestin-EGFP mouse. Yellow dotted lines denote the border between the endfeet (below) and the pia (above). (G) Localization of Myh10 smiFISH puncta (white) in cell bodies from E12.5 to E16.5. Yellow dotted lines denote ventricular border. Samples observed for selection of representative images: n = 3 brains, 3 sections per brain (A, B). n = 2 to 4 brains, 3 sections per brain (D, E, F, G). Scale bars: 10 μm (A, B, D, E, F, G). Black asterisks denote background signal from the meninges (A, B, D, F). RGC, radial glial cell; smiFISH, single-molecule inexpensive fluorescent in situ hybridization.
Fig 4
Fig 4. Myh9 regulates basal endfoot complexity and organization relative to the BM.
(A) Cartoon schematic of (Top) mating scheme used to generate embryos and (Bottom) method for CFSE labeling of RGC morphology. (B) CFSE labeling of E16.5 RGCs including endfeet (green) for Myh9 Ctrl, cHet, and cKO brains (Top), with BM marked by laminin (red) (Bottom). Asterisk denotes background signal from vasculature. n = 5 Ctrl, 5 cHet, 4 cKO from 3 litters. (C) Cortical columns of E16.5 Myh9 Ctrl, cHet, cKO brains stained for SOX2 (red) and DAPI (blue). White dashed lines denote tissue borders. n = 9 Ctrl, 5 cHet, 6 cKO from 3 litters. (D) Quantification of cortical thickness. n = 9 Ctrl, 5 cHet, 7 cKO from 3 litters. (E) Quantification of the thickness of the SOX+ layer. n = 9 Ctrl, 5 cHet, 6 cKO. (F) Quantification of SOX2+ cell density as the fraction of total DAPI cells. n = 5 Ctrl, 2 cHet, 4 cKO. (G) Representative images of 3D reconstructed Ctrl and cKO RGCs labeled with GLAST-EGFP-CAAX by IUE. (Top) Fluorescent images of EGFP+ basal processes and endfeet. (Bottom) Line tracing of top images. (H) Schematic detailing endfoot number and branch order quantification criteria for panels I-K. (I) Quantification of total branch number per cell. (J) Quantification of number of branches per branch order. (K) Quantification of total endfoot number per cell. (L) (Top) Schematic detailing quantification criteria of endfoot position. Endfeet were classified as unattached (grey), attached (green), or protruded (black) relative to the BM (red) stained with laminin. (Bottom) Quantification of endfoot position represented as % of total endfeet analyzed. n = 65 cells from 5 brains from 3 litters for Ctrl and n = 34 cells from 3 brains from 2 litters for cKO (G-L) Error bars: SD (D, E, F), SEM. (I, J, K, L). One-way ANOVA with Tukey’s (D, E, F), Student unpaired, two-tailed t test (I, J, K) two-way ANOVA with Sidak’s multiple comparison test (L) ns p > 0.05, *p ≤ 0.05, **p ≤ 0.01, ***p ≤ 0.001, ****p ≤ 0.0001. Scale bars: (B) 10 μm; (C) 100 μm; (G) 5 μm. Data underlying graphs included in S2 Data. BM, basement membrane; CFSE, carboxyfluorescein succinimidyl ester; IUE, in utero electroporation; RGC, radial glial cell.
Fig 5
Fig 5. Myh10 is required for attachment of both basal and apical endfeet.
(A) Cartoon schematic of (Left) mating scheme used to generate embryos, (Center) method for CFSE labeling of RGC morphology, and (Right) purple boxes representing regions in B and C. (B) CFSE labeling of E16.5 RGCs (green) for Myh10 Ctrl, cHet, and cKO brains. White dotted line denotes border between endfeet and pia. n = 3 Ctrl, 3 cHet, 4 cKO from 2 litters. (C) Comparison of basal process morphology between E16.5 Myh10 Ctrl and cKO RGCs labeled with CFSE. n = 3 per genotype from 1 litter. (D) Endfoot position and attachment in Myh10 cKO and Ctrl E14.5 brains labeled with CFSE (green). Arrow heads denote detached endfeet. Dotted box marks region of interest for right panel of each genotype. White dotted line denotes border between endfeet and pia. n = 4 per genotype from 1 litter. (E) Ctrl and Myh10 cKO endfeet labeled with CFSE (green) at E15.5. White dotted line denotes border between endfeet and pia. n = 3 per genotype from 2 litters. (F) Cortical columns of E16.5 Myh10 Ctrl, cHet, and cKO brains, stained with SOX2 (green) and DAPI (blue). White dotted lines mark tissue borders. n = 3 Ctrl, 4 cHet, and 4 cKO from 2 litters. (G) Quantification of cortical thickness. (H) Quantification of SOX2+ cell density calculated as the fraction of total DAPI cells. (I) SOX2+ (grey) cell position across development from E13.5 to E16.5 in Myh10 cKO cortical columns. White dotted lines denote pial and ventricular boundaries. n = 3 E13.5, 3 E14.5, 4 E15.5, 6 E16.5. From 1 litter for E13.5 to E15.5 and 2 litters for E16.5. (J) MYH10 staining (red) of E13.5 to E16.5 Ctrl brains with imaging focused on apical endfeet at the ventricle. Arrow indicates MYH10+ staining in apical endfeet at the ventricular border of coronal sections. n = 3 per stage. (K) Cartoon depiction of en face imaging of apical endfeet at E14.5 shown in L. (L) En face imaging of apical endfeet in E14.5 Myh10 Ctrl and cKO cortices, labeled with anti β-catenin (green) and Phalloidin (red) to mark actin. n = 9 Ctrl and 7 cKO from 3 litters. Error bars: SD. (G, H) One-way ANOVA with Tukey’s (G, H) ns p > 0.05. Scale bar: (B, C, I) 50 μm; (D, E), 10 μm; (F) 100 μm; (J, L) 25 μm. Data underlying graphs included in S3 Data. CFSE, carboxyfluorescein succinimidyl ester; RGC, radial glial cell.
Fig 6
Fig 6. Detached endfeet, caused by loss of Myh10, impact cortical architecture.
(A) Cartoon schematic of an RGC (green) and the local niche where the endfeet reside made up of BM (black), fibroblasts (brown), vasculature (red), CR cells (grey), and interneurons (red). Box indicates MZ region of images in B, E, G. (B) Labeling of all nuclei with DAPI (blue) in E16.5 Myh10 Ctrl and cKO brains. Boundary between pia and MZ marked by yellow dashed line. White bar represents MZ thickness measurements in D. (C) Quantification of DAPI cells in the MZ. n = 5 Ctrl, 6 cKO from 2 litters. (D) Quantification of MZ thickness. Each data point represents the average of 3 measurements per section and 3 sections per brain. n = 6 per genotype from 2 litters. (E) Staining with Calretinin (white) to label CR cells and interneurons and DAPI (blue) to mark all nuclei in E16.5 Myh10 Ctrl and cKO brains. Yellow bar represents where Calretinin thickness was measured for F. (F) Quantification of Calretinin thickness. n = 3 per genotype from 1 litter (G) P73 staining (green) of CR cell nuclei and DAPI (blue). Asterisks denote vasculature. White dotted line marks boundary between pia and MZ. (H) Quantification of P73+ cells in MZ. n = 6 per genotype from 2 litters Error bars: SD. (C, D, F, H). Student unpaired, two-tailed t test (C, D, F, H). Data points color-coded by litter (C, D, F, H). ns p > 0.05, *p ≤ 0.05, **p ≤ 0.01, ***p ≤ 0.001, ****p ≤ 0.0001. Scale bar: (B, E, G), 50 μm. Data underlying graphs included in S4 Data. BM, basement membrane; CR cells, Cajal–Retzius cells; MZ, marginal zone; RGC, radial glial cell.
Fig 7
Fig 7. RGC morphology, regulated by Myh9 and Myh10, influences interneuron number and organization in the MZ.
(A) Staining with LHX6 (red) to label interneurons and DAPI (blue) to mark all nuclei. Myh10 Ctrl and cKO brains at E16.5. Asterisks denote vasculature. White dotted line marks boundary between pia and MZ. (B) Quantification of LHX6+ cells in the MZ. n = 9 per genotype from 4 litters. (C) Staining with LHX6+ (red) and DAPI (blue) in the MZ of Ctrl and Myh9 cKO E16.5 brains. (D) Quantification of the number of LHX6+ cells in the MZ of Ctrl and Myh9 cKO brains. n = 10 per genotype from 6 litters. (E) Comparison of LHX6+ (red) cells touching the BM in Ctrl and Myh9 cKO brains. BM labeled with laminin (white) and all nuclei with DAPI (blue). Yellow arrows indicate LHX6+ cells touching the BM. (F) Quantification of the fraction of LHX6+ cells in the MZ touching the BM compared to total LHX6+ cells in the MZ. n = 10 per genotype from 6 litters. (G) Comparison of LHX6+ (red) cells touching the BM in Ctrl and Myh10 cKO brains. BM labeled with COL1 (white) and all nuclei with DAPI (blue). Yellow arrows indicated LHX6+ cells touching the BM. (H) Quantification of the fraction of LHX6+ cells in the MZ touching the BM compared to total LHX6+ cells in the MZ. n = 3 per genotype from 1 litter. Error bars: SD. (B, D, F, H). Student unpaired, two-tailed t test (B, D, F, H). Data points color-coded by litter (B, D, F, H). ns p > 0.05, *p ≤ 0.05, **p ≤ 0.01, ***p ≤ 0.001, ****p ≤ 0.0001. Scale bar: (A, C) 50 μm; (E, G) 25 μm. Data underlying graphs included in S5 Data. BM, basement membrane; COL1, Collagen 1; MZ, marginal zone; RGC, radial glial cell.
Fig 8
Fig 8. Endfoot-enriched proteome highlights MYH9 and MYH10, which control RGC integrity and interneurons.
Cartoon summary illustrating the local proteome of RGC basal endfeet. The middle and right cartoons depict the impact of Myh9 and Myh10 on RGC (green) morphology and the organization of CR cells (grey) and interneurons (red). BM, basement membrane; CR cells, Cajal–Retzius cells; RGC, radial glial cell.

Comment in

References

    1. Noctor SC, Flint AC, Weissman TA, Dammerman RS, Kriegstein AR. Neurons derived from radial glial cells establish radial units in neocortex. Nature. 2001;409(6821):714–720. doi: 10.1038/35055553 - DOI - PubMed
    1. Malatesta P, Hartfuss E, Gotz M. Isolation of radial glial cells by fluorescent-activated cell sorting reveals a neuronal lineage. Development. 2000;127(24):5253–5263. doi: 10.1242/dev.127.24.5253 - DOI - PubMed
    1. Gadisseux JF, Kadhim HJ, van den Bosch de Aguilar P, Caviness VS, Evrard P. Neuron migration within the radial glial fiber system of the developing murine cerebrum: an electron microscopic autoradiographic analysis. Brain Res Dev Brain Res. 1990;52(1–2):39–56. - PubMed
    1. Lu X, Duan M, Song L, Zhang W, Hu X, Zhao S, et al. Morphological changes of radial glial cells during mouse embryonic development. Brain Res. 2015;1599:57–66. doi: 10.1016/j.brainres.2014.12.039 - DOI - PubMed
    1. Yokota Y, Eom TY, Stanco A, Kim WY, Rao S, Snider WD, et al. Cdc42 and Gsk3 modulate the dynamics of radial glial growth, inter-radial glial interactions and polarity in the developing cerebral cortex. Development. 2010;137(23):4101–4110. doi: 10.1242/dev.048637 - DOI - PMC - PubMed

Publication types