. 2023 Feb 28;14(1):1122.
doi: 10.1038/s41467-023-36769-6.

Genomic and immune landscape Of metastatic pheochromocytoma and paraganglioma

Affiliations

Genomic and immune landscape Of metastatic pheochromocytoma and paraganglioma

Bruna Calsina et al. Nat Commun. .

Abstract

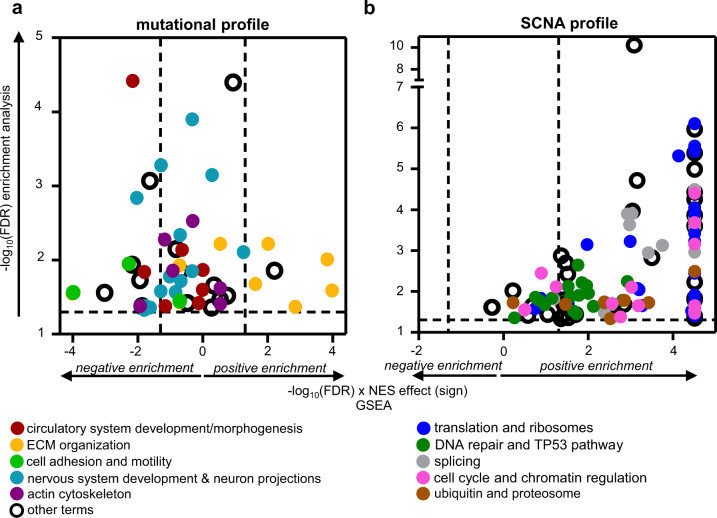
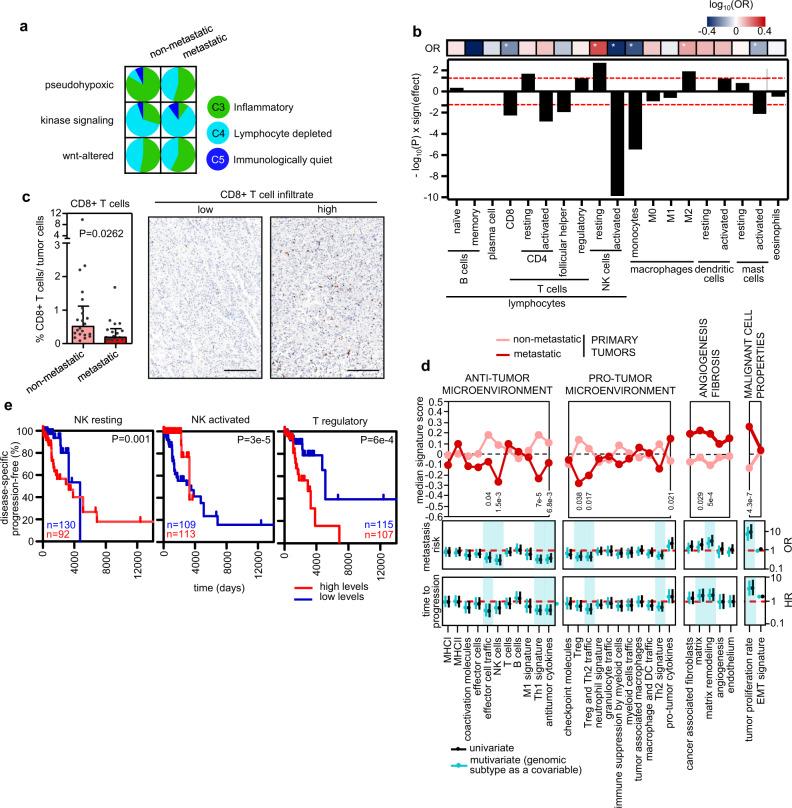
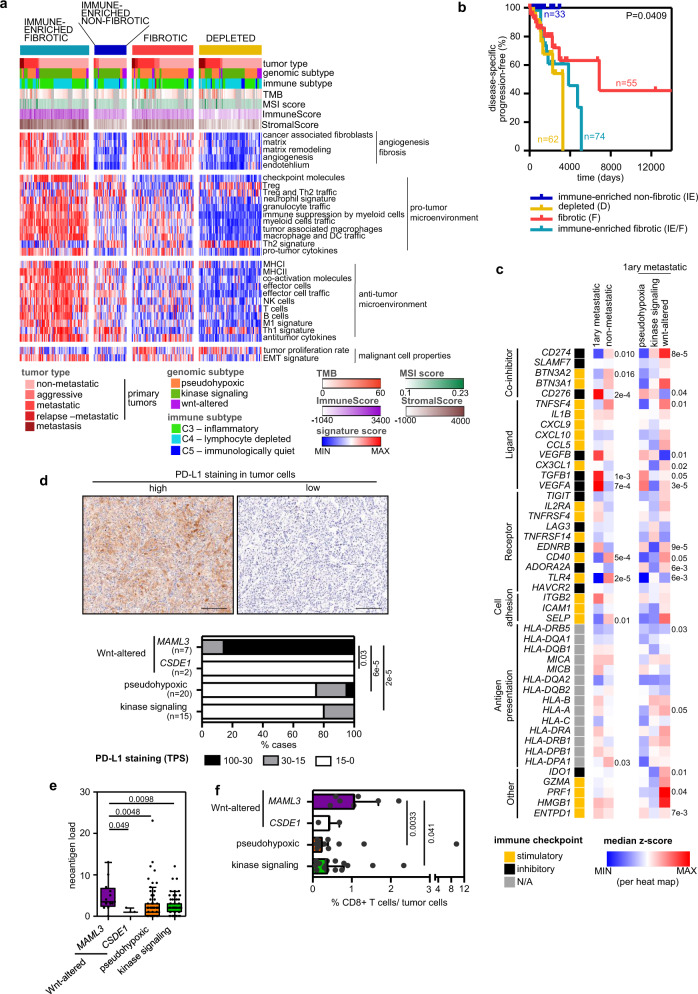
The mechanisms triggering metastasis in pheochromocytoma/paraganglioma are unknown, hindering therapeutic options for patients with metastatic tumors (mPPGL). Herein we show by genomic profiling of a large cohort of mPPGLs that high mutational load, microsatellite instability and somatic copy-number alteration burden are associated with ATRX/TERT alterations and are suitable prognostic markers. Transcriptomic analysis defines the signaling networks involved in the acquisition of metastatic competence and establishes a gene signature related to mPPGLs, highlighting CDK1 as an additional mPPGL marker. Immunogenomics accompanied by immunohistochemistry identifies a heterogeneous ecosystem at the tumor microenvironment level, linked to the genomic subtype and tumor behavior. Specifically, we define a general immunosuppressive microenvironment in mPPGLs, the exception being PD-L1 expressing MAML3-related tumors. Our study reveals canonical markers for risk of metastasis, and suggests the usefulness of including immune parameters in clinical management for PPGL prognostication and identification of patients who might benefit from immunotherapy.


Conflict of interest statement

G.M., is a founder, director and shareholder of Tailor Bio Ltd, a genomics company using copy number signatures for precision medicine. The rest of the authors declare no competing interests.

Figures

Fig. 1
Fig. 1. Series description and study workflow.
a Characteristics of the CNIO cohort used for WES and RNA-Seq analysis. Characteristics shown are: platform available (WES and RNA-Seq), preservation of material (FFPE or frozen), tumor type (non-metastatic, aggressive, metastatic, relapse or metastases), primary tumor and metastasis location, sex, age at diagnosis, genomic subtype and genotype. NA: information not available. b General overview of the study. See also Supplementary Table 1 and Supplementary Fig. 1.
Fig. 2
Fig. 2. Tumor mutational burden (TMB), microsatellite instability (MSI) and ATRX/TERT alterations in mPPGLs.
The data included correspond to 261 tumor-normal pairs from the CNIO and TCGA cohorts. a Overview of the number of variants, MSI score, and other clinical and genomic features of the whole series. Tumors have been ranked by TMB (calculated with category 5 variants). The legend in the bottom indicates the color code for each item. The filtering strategy for WES events is shown in Supplementary Fig. 2. b TMB and c MSI score (extracted with MANTIS) across PPGL tumors (n = 256). P-values were calculated with a two-sided Mann–Whitney–Wilcoxon (MWW) test and significant ones are shown in the figures. d Correlation between TMB and MSI score. Two-sided Pearson’s correlation coefficient is shown. e, f Progression-free survival analysis of patients according to primary tumors’ TMB and MSI score, respectively. Only primary tumors from non-metastatic and metastatic patients were analyzed. Higher TMB indicates tumors with values > than the third quartile (n = 37); lower TMB for the remainder cases (n = 175). Higher MSI score indicates cases with MSI score >0.15 (n = 40); lower MSI for the remainder cases (n = 172). Kaplan–Meier plots of time to progression (time between the first PPGL diagnosis and the first documented metastasis) are shown together with P-values calculated using a log-rank test. Median progression time (± standard error) of each group is depicted in the corresponding color. Patients without evidence of metastases were censored at the date of the last follow-up. gi TMB variation according to tumor volume (cm3) (n = 28), % Ki67 positive cells (n = 16) and MKI67 mRNA expression (n = 191). Volumes and % Ki67 cells data, when available, were extracted from the pathological anatomy reports received with each specimen. High MKI67 mRNA expression indicates expression levels above the 3rd quartile value of the whole cohort and low MKI67 mRNA expression when levels were beneath the 3rd quartile value. j TMB variation according to the age of the patient at surgery (n = 225). For (h)–(k) a two-sided MWW was applied to test for differences, and, except for (j), only primary tumors (non-metastatic, aggressive and metastatic) were considered. k Frequency of ATRX/TERT-alterations within genomic subtypes. Two-sided Freeman–Halton test was used to test for differences between genomic subtypes. Metastatic tumors include primary tumors and metastases; if paired primary-metastasis is available, only one tumor per patient is represented. l TMB and m MSI score in ATRX/TERT-wild-type (WT) and in ATRX/TERT-altered tumors (n = 256). Two-sided MWW was used to test for differences. For all box-plots in this figure: the median value is marked, and Tukey whiskers are represented. See also Supplementary Fig. 3 and Supplementary Table 2. Source data are provided as a Source Data file.
Fig. 3
Fig. 3. Somatic copy number alterations (SCNA) profile in mPPGLs.
The data included is from 234 tumor-normal pairs from the CNIO and TCGA cohorts. a Overview of the arm-level SCNA, and clinical, molecular and technical features of the whole series. Tumors have been ranked by SCNA burden (number of SCNA events). The legend in the bottom indicates the color code for each item. Top panel: % of samples with arm-level CNA in metastatic and non-metastatic primary tumors. Significant (Fisher test; FDR < 0.1) regions between both groups are annotated. b SCNA burden (number of SCNA events) across PPGLs (n = 232). P values shown were calculated with a two-sided MWW test. c SCNA in ATRX/TERT-wild-type (WT) and in ATRX/TERT-altered tumors (n = 232). Two-sided MWW was used to test for differences. d Progression-free survival analysis of patients according to the presence of whole chromosome 5 gains (n = 17) or no whole chromosome gains (n = 177) in primary tumors. Only primary tumors from non-metastatic and metastatic patients included. Kaplan-Meier plot of time to progression (time between the first PPGL diagnosis and the first documented metastasis) and the P-value calculated using a log-rank test is exposed. Patients without evidence of metastases were censored at the date of the last follow-up. For all box-plots in this figure: the median value is marked, and Tukey whiskers are represented. See also Supplementary Fig. 4. Source data are provided as a Source Data file.
Fig. 4
Fig. 4. mPPGL transcriptomic profile.
a Gene signature associated with mPPGL. mRNA expression levels of the 26 differential expressed selected genes, tumor behavior, genomic subtype and genotype are depicted in rows; primary tumors appear in columns (n = 230). Univariate (black) and multivariate (blue) logistic and Cox regression analysis of metastasis risk (b) and TTP (c), respectively. Gene expression was dichotomized as follows: for downregulated genes in mPPGLs, median expression was used as threshold (0 – below the median expression level; 1 – above the median expression level); for up-regulated genes in mPPGLs, high expression levels > than the 3rd quartile (0 – below the 3rd quartile threshold value; 1 – above the 3rd quartile threshold value). Multivariate analysis included as covariate genomic subtype. Only data from primary tumors from non-metastatic and metastatic patients were included. d Box plot of CDK1 expression of primary tumors included in this study united to those from an independent cohort (n = 417). Expression from both cohorts was z-score transformed (centered at the mean of non-metastatic group for each cohort). The P-value corresponds to a two-sided MWW test. e Progression-free survival analysis of patients according to CDK1 expression. Kaplan–Meier plot of time to progression (time between the first PPGL diagnosis and the first documented metastasis) is shown together with the P-value calculated using a log-rank test. High levels (above the 3rd quartile value of the whole cohort) are represented in red (n = 71) and low expression (below the 3rd quartile) in blue (n = 172). Patients without evidence of metastases were censored at the date of the last follow-up. f Representative images (right) and quantification (left) of CDK1 IHC staining in a subset of n = 41 PPGLs. Three PPGLs classified as aggressive were not included in this analysis. Scale bar in images = 100 μm. Unpaired two-sided t test was used to test differences between groups. g Signaling networks underlying mPPGLs. Plots show normalized enrichment score (NES) of significantly enriched gene sets (FDR < 0.05, GSEA) from MSigDB, grouped according to relevant biological processes. Each dot represents a gene set and is highlighted in the specific color for each process. h Close-up of gene sets gathered in immune response annotation and differentiation between interferon signaling, T cells/activation differentiation and anti-tumor related cytokines. For all box-plots in this figure: the median value is marked, and Tukey whiskers are represented. See also Supplementary Figs. 5, 6. Source data are provided as a Source Data file.
Fig. 5
Fig. 5. Functional enrichment analysis of mutated (a) and CN-altered (b) genes in mPPGLs.
Functional enrichment analysis of mutated (a) and CN-altered (b) genes in mPPGLs. y-axis indicates the −log10(FDR) of each gene set identified in the functional enrichment analysis performed using the list of 323 genes mutated in the metastatic primary tumors (a) or the 911 genes with differing SCNA between metastatic and non-metastatic primary tumors (b). Only those gene sets with fold-change enrichment (FCe) > 1.8 and FDR < 0.05 by Fisher’s Exact test were considered. x-axis indicates −log10(FDR) × NES sign from the GSEA analysis performed using the gene sets recognized in the functional enrichment analysis and the RNA-Seq series of metastatic versus non-metastatic primary tumors. The gene sets related to each functional annotation are shown in different colors as depicted in the legend. Dashed lines indicate the cut-off values for significance. The extended version of the figure, in which each gene set name is annotated, is depicted in Supplementary Figs. 8, 9. Source data are provided as a Source Data file.
Fig. 6
Fig. 6. Immune landscape in PPGLs.
a Classification of immune subtypes within tumor tissue types and genomic subtype. The proportion (%) of samples of each immune subtype per tumor type and genomic subtype is shown. Aggressive tumors were excluded from pie charts due to the low number of samples available. b Plot showing the −log10(P) resulting from a two-sided MWW analysis to define differences between metastatic primary versus non-metastatic tumors in the different immune cell classes estimated with CIBERSORTx. The ‘sign(effect)’ indicates the direction of the fold-change between the proportions in both groups. Cell types with >85% of the samples with ‘0 s’ were excluded from the analysis. Columns that surpass the red dashed line have P < 0.05. The top row summarizes univariate logistic regression analysis comparing immune cell proportions and metastatic risk. The color of the cell is relative to the −log10(OR), and * indicates P < 0.05. c Percentage of CD8+ T cells infiltrated among tumor cells detected by immunohistochemistry (left) in a subset of n = 39 PPGLs with different clinical behavior. Three PPGLs classified as aggressive were not included in this analysis, and for two cases IHC were not assessable. Median ± IQR is shown. Two-sided MWW was applied to test for differences. Representative images (right) of CD8 IHC. Scale bar in images = 200 μm. d Top panel: median enrichment score of the different Fges in metastatic and non-metastatic primary tumors. Two-sided MWW was applied to test for differences between metastatic (n = 55) and non-metastatic (n = 176) primary tumors; significant P values are shown. Univariate (black) and multivariate (blue) logistic and Cox regression analysis of metastasis risk (middle panel) and TTP (bottom panel), respectively. Enrichment scores were used as a continuous variable. Multivariate analysis included genomic subtype as covariate. Only data from primary tumors from non-metastatic and metastatic patients were included. Significant associations in Fges scores after multivariate analysis are shaded in blue. e Kaplan–Meier plots of time to progression in patients according to different immune cell type levels found in primary tumors. Only primary tumors from non-metastatic and metastatic patients included. High levels (above the median level of the whole group) are represented in red (n = 92, n = 113, and n = 107, respectively for NK resting, NK activated and T regulatory) and low expression (below the median level) in blue (n = 130, n = 109 and n = 115, respectively for NK resting, NK activated and T regulatory). P-values shown inside the plots were calculated using a log-rank test. Patients without evidence of metastases were censored at the date of the last follow-up. See Supplementary Fig. 10 for the extended version. Source data are provided as a Source Data file.
Fig. 7
Fig. 7. Immunogenomics as a theranostic tool in the immunotherapy contexture.
a Heatmap of the 267 PPGL tumors profiled by RNA-Seq and classified into the four distinct TME subtypes described Bagaev et al. based on unsupervised k-means clustering of the 29 Fge enrichment scores. Genomic and clinical features are exhibited as depicted in the legend. b Kaplan–Meier plot of time to progression in patients according to the primary tumor TME subtype (n = 33 for IE, n = 55 for F, n = 74 for IE/F and n = 62 for D). Only primary tumors from non-metastatic and metastatic patients included. P-value was calculated using a log-rank test. Patients without evidence of metastases were censored at the date of the last follow-up. c Expression (median normalized z-score expression) of main immunoregulators (IMs) according to the clinical behavior and genomic subtype. Two-sided MWW and two-sided Krustal-Wallis tests were applied to test for differences between metastatic (n = 55) and non-metastatic (n = 176) primary tumors and between the different genomic subtypes (pseudohypoxic, n = 33; kinase signaling, n = 16; Wnt-altered, n = 6) within metastatic primary tumors, respectively; both tests were applied on the normalized data. Significant P-values are shown. d Representative images (top) and quantification (bottom) of PD-L1 IHC staining in a subset of n = 44 PPGLs. Quantification is represented for each genomic subtype. Two-sided Freeman–Halton test was used to test for differences between groups. Only MAML3 class exhibited statistically significant differences compared to the other groups. Scale bar in images = 150 μm. e Neoantigen load across genomic subtypes in primary tumors (n = 170). Only tumors with WES and RNA-Seq data available were included in the analysis; WT Wwnt-altered tumors have not been represented. The median value is marked and Tukey whiskers are represented. P-values shown in the figure correspond to two-sided MWW test. Only MAML3 class exhibited statistically significant differences compared to the other groups. f Percentages of CD8+ T cells infiltrated among the tumor cells detected by immunohistochemistry in a subset of n = 42 PPGLs with different genomic subtypes. For two cases, IHC was not assessable. Median ± IQR is shown. MWW was applied to test for differences between groups. See also Supplementary Figs. 11–13. Source data are provided as a Source Data file.

References

    1. Dahia PLM. Pheochromocytomas and paragangliomas, genetically diverse and minimalist, all at once! Cancer Cell. 2017;31:159–161. doi: 10.1016/j.ccell.2017.01.009. - DOI - PubMed
    1. Hescot, S. et al. Prognosis of malignant pheochromocytoma and paraganglioma (MAPP-PronO study): a European network for the study of adrenal tumors retrospective study. J. Clin. Endocrinol. Metab. 104, 2367–2374 (2019). - PubMed
    1. Nölting S, et al. Personalized management of pheochromocytoma and paraganglioma. Endocr. Rev. 2021 doi: 10.1210/endrev/bnab019. - DOI - PMC - PubMed
    1. Fassnacht, M. et al. Adrenocortical carcinomas and malignant phaeochromocytomas: ESMO–EURACAN Clinical Practice Guidelines for diagnosis, treatment and follow-up††Approved by the ESMO Guidelines Committee: June 2020. This publication supersedes the previously published versio. Ann. Oncol. 31, 1476–1490 (2020). - PubMed
    1. Fishbein L, et al. Comprehensive molecular characterization of pheochromocytoma and paraganglioma. Cancer Cell. 2017;31:181–193. doi: 10.1016/j.ccell.2017.01.001. - DOI - PMC - PubMed

Publication types