. 2023 Feb 28;14(1):1129.
doi: 10.1038/s41467-023-36665-z.

Identification of a physiologic vasculogenic fibroblast state to achieve tissue repair

Affiliations

Identification of a physiologic vasculogenic fibroblast state to achieve tissue repair

Durba Pal et al. Nat Commun. .

Abstract

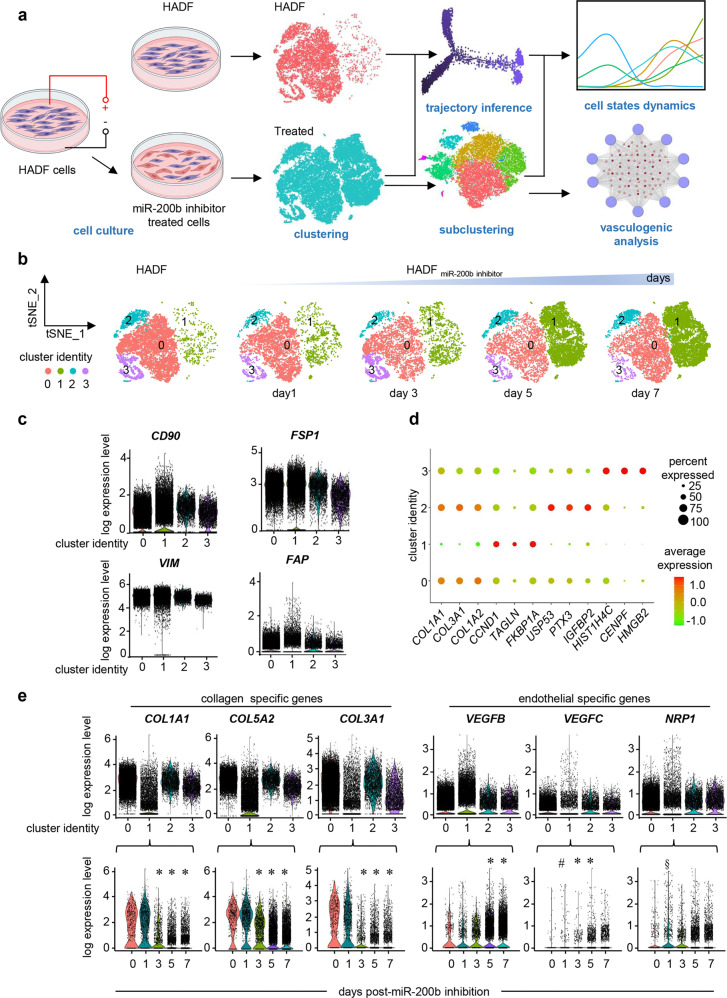
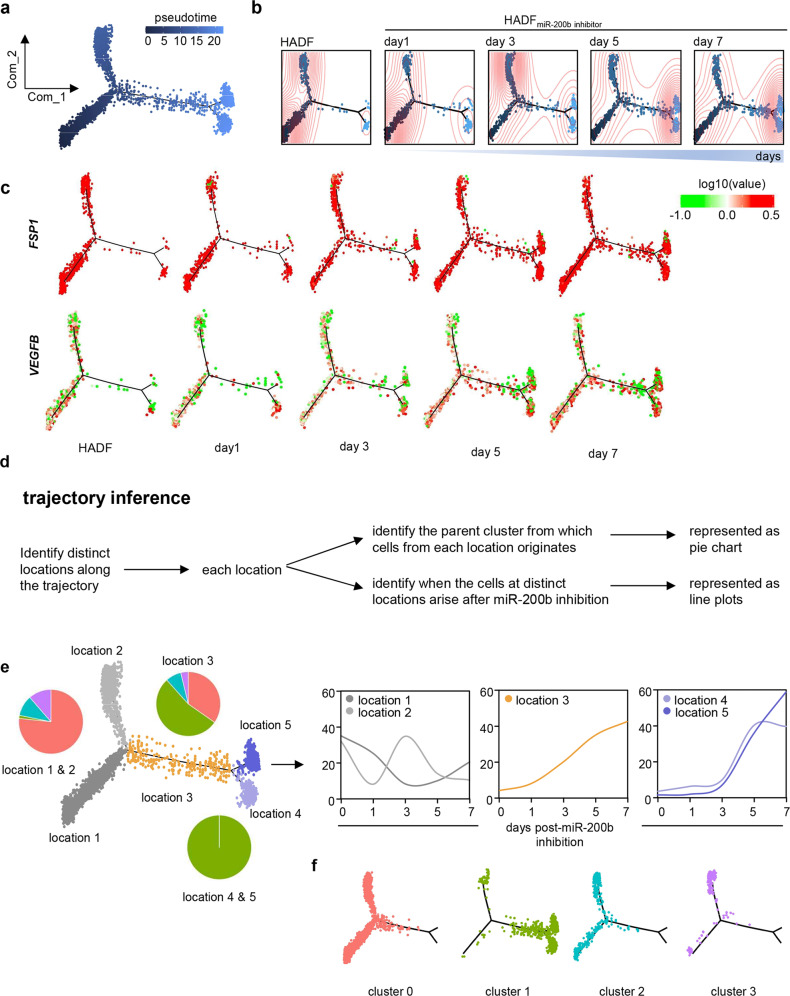
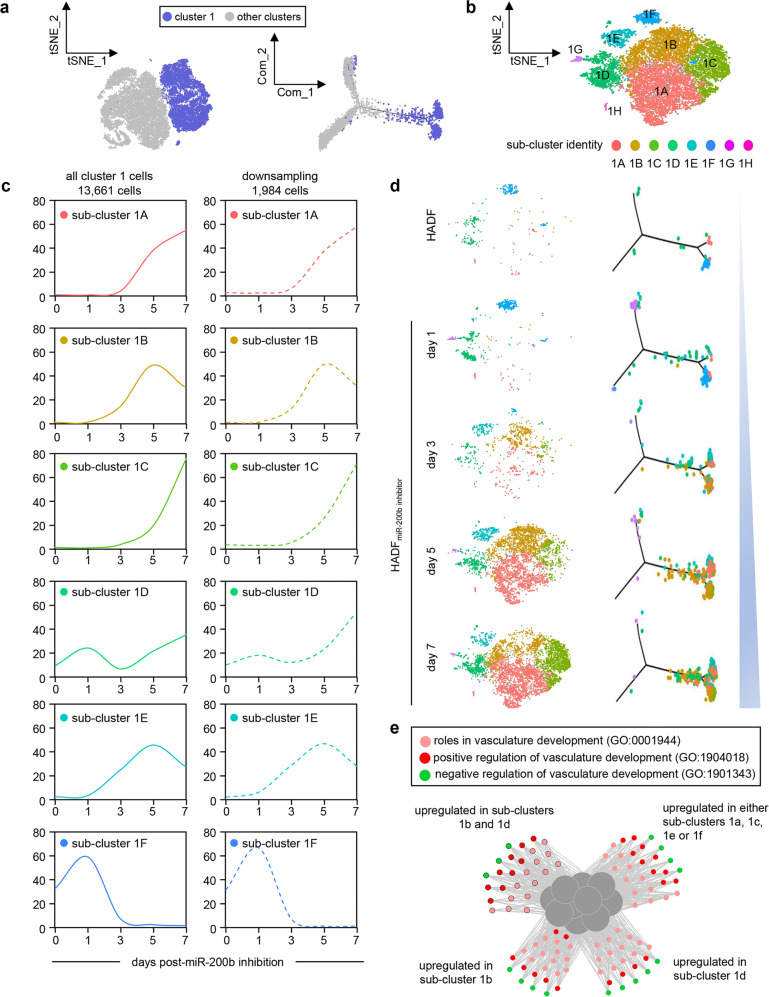
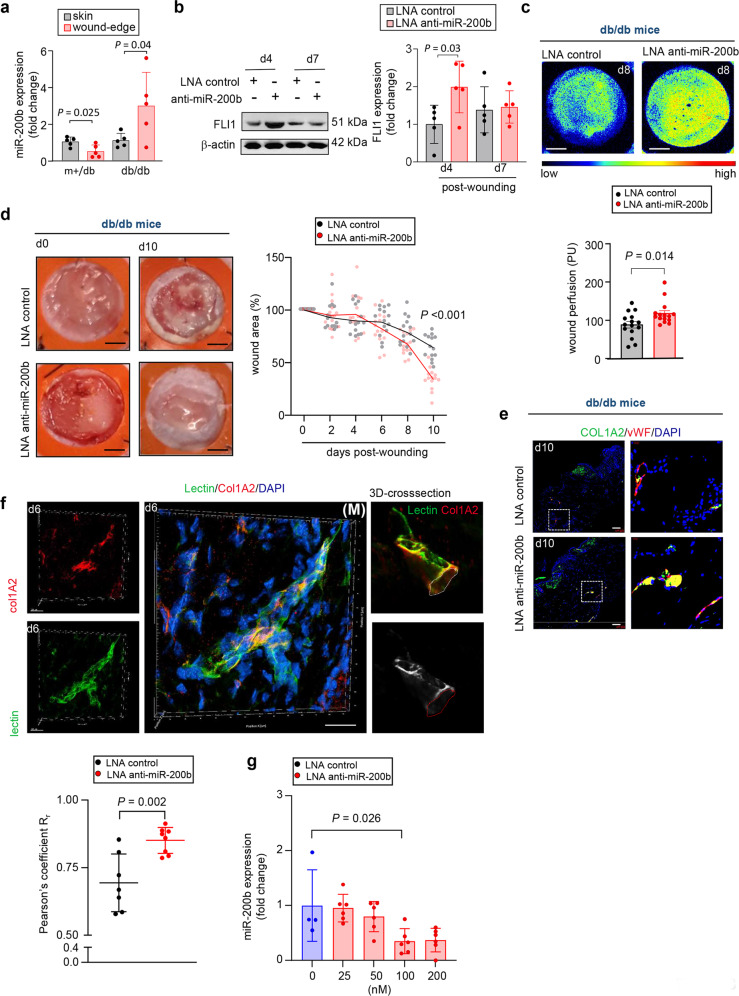
Tissue injury to skin diminishes miR-200b in dermal fibroblasts. Fibroblasts are widely reported to directly reprogram into endothelial-like cells and we hypothesized that miR-200b inhibition may cause such changes. We transfected human dermal fibroblasts with anti-miR-200b oligonucleotide, then using single cell RNA sequencing, identified emergence of a vasculogenic subset with a distinct fibroblast transcriptome and demonstrated blood vessel forming function in vivo. Anti-miR-200b delivery to murine injury sites likewise enhanced tissue perfusion, wound closure, and vasculogenic fibroblast contribution to perfused vessels in a FLI1 dependent manner. Vasculogenic fibroblast subset emergence was blunted in delayed healing wounds of diabetic animals but, topical tissue nanotransfection of a single anti-miR-200b oligonucleotide was sufficient to restore FLI1 expression, vasculogenic fibroblast emergence, tissue perfusion, and wound healing. Augmenting a physiologic tissue injury adaptive response mechanism that produces a vasculogenic fibroblast state change opens new avenues for therapeutic tissue vascularization of ischemic wounds.


Conflict of interest statement

The authors declare no competing interests.

Figures

Fig. 1
Fig. 1. Single-cell RNA sequencing analysis reveals temporal gain of a vasculogenic cluster post miR-200b inhibition.
a Schematic diagram of nanoelectroporation delivery of miR-200b inhibitor in human adult dermal fibroblasts (HADF) and workflow for obtaining and analyzing scRNA-seq data from fibroblasts (HADF cells). b t-SNE plots for HADF cells at different time interval (days 1, 3, 5, and 7) post anti-miR-200b transfection with cells colored according to 4 main clusters. The initial dataset contained 40,212 cells out of which 36,308 cells met quality control measures and were chosen for further downstream analysis. Unsupervised clustering identified 4 cell clusters (clusters 0–3). See Supplementary Fig. 2 c and d for control inhibitor treated HADF cells. c Violin plots expression of fibroblast markers (CD90, FSP1, Vimentin, Fibroblast activation protein alpha 1) in different clusters of fibroblasts. Cluster 1 progressively lost characteristic fibroblast gene expression. d Dot plot of representative genes for identification of the four cellular clusters in HADF cells post-miR-200b inhibition. e Violin plots showing lower expression of collagen genes (COL1A1, COL5A2, COL3A1) and higher expression of VEGF family genes (VEGFB, VEGFC, NRP1) in cluster 1 (upper panel) and their expression within cluster 1 cells over time post anti-miR-200b transfection (lower panel). *P < 0.001; #P < 0.048; §P < 0.005. Data in e was analyzed by one-way analysis of variance with the post-hoc Bonferroni multiple comparison test. Fig 1a created with BioRender.com.
Fig. 2
Fig. 2. Anti-sense oligonucleotide inhibition of miR-200b in dermal fibroblasts induces vasculogenic state.
a Quantitative gene expression of key representative transcripts from the cDNA prepared and used for single cell RNA sequencing at day 7 post-miR-200b inhibition. Data are mean ± S.D (n = 5–6). b Immunofluorescence of eNOS expression in HADF transfected with control or miR-200b inhibitor at d7 post in vitro TNT. Scale, 200 µm. Data are mean ± S.D (n = 6–8). c Immunocytochemistry of acLDL uptake in HADF transfected with control or miR-200b inhibitor at d7 post in vitro TNT. Scale, 200 µm. Data are mean ± S.D (n = 8–10). d Representative images showing in vitro Matrigel tube formation by vasculogenic fibroblasts and its analysis. HMEC were used as positive control. Scale, 200 µm. Results represent mean ± S.D (n = 10). e Schematic diagram showing the experimental design for in vivo collagen gel assay. f Immunofluorescence confocal image of in vivo collagen gel assay showing lectin perfused vessels of HADF origin treated with miR 200b inhibitor at day 28. Such perfused vessels were absent in control groups where HADF were treated with only control inhibitor. Scale, 50 µm. Data in ac were analyzed by two-tailed unpaired Student’s t test. Data in d was analyzed by one-way analysis of variance with the post-hoc Bonferroni multiple comparison test. Fig 2e created with BioRender.com.
Fig. 3
Fig. 3. Single-cell trajectory analysis identify fibroblast subpopulation state change.
a Single cell trajectory analysis shows distribution of HADF cells presented in Fig. 1B. b Pseudotime analyses reveal putative trajectories of HADF acquired before and after inhibition of miR-200b at different time points. Pseudotime ordering on fibroblasts arranged them into two major trajectories, followed by one intermediate branch ending into a bifurcation seen in the vasculogenic fibroblasts. Untreated cells (HADF) were mainly distributed in the left side of the trajectory, while the number of cells increases over time post anti-miR-200b treatment in the intermediate and right side. Red circles represent the cells density estimation. c Relative expression level of FSP1 and VEGFB along the trajectory showing that the terminal states maintain expression of FSP1, but the anti-miR-200b transfected cells have higher expression of VEGFB. d Schematic representation of the trajectory analysis over different time points. e Left panel: Cells were identified to be at 5 locations along the trajectory. Location 1 and 2 which have more cells from the untreated sample contain cells mainly coming from main cluster 0 (f). Locations 4 and 5 which have more cells from the anti-miR-200b treated samples contain cells mainly coming from main cluster 1 (f). The intermediate location (location 3) contains cells mainly coming from main clusters 0 and 1 (f). Right panel: line plots representing the percentage of the originating sample in each location showing that cells at location 3 started rising after day 1 post anti-miR-200b treatment and the cells at 2 terminal locations (4 and 5) are increasing after day 3 post anti-miR-200b treatment. f The newly formed cluster is scattered along the intermediate part of the trajectory and along the 2 terminal branches. Cells are color coded based on the originating cluster. Statistical methods are provided in detail in Methods.
Fig. 4
Fig. 4. Subclustering of identified cluster 1 of vasculogenic fibroblasts cells showing cells entering into new states over time post miR-200b inhibition.
a tSNE and psuedotime plots showing identification and selection of cells from cluster 1 colored with violet, while other cells are gray. b t-SNE plot showing 8 subclusters identified within vasculogenic cluster 1 cells (from 1A to 1G). c Line plots showing the percentage of each subcluster at different time points (parent HADF cells and post anti-miR-200b treated cells at day 1, 3, 5 and 7. Left panel represents line plots from all cluster 1 cells. Right panel represents line plots from the subset of cells that were used for the trajectory inference. d t-SNE plots for cluster 1 subclusters for each sample. Subcluster 1 F that was present at the destination location in parent HADF cells and at day 1 post anti-miR-200b treatment faded and was displaced by predominant new subclusters 1B, 1C and 1D at days 3, 5, and 7 post-ASO treatment. e Network of the top GO biological processes (with adjusted p < 0.05; Bonferroni correction) enriched for the differentially expressed genes (logFC + −0.1; adjusted p < 0.05). The center gray circles denote vasculature development, blood vessel development, circulatory system development, blood vessel morphogenesis, tube morphogenesis, angiogenesis, tube development, anatomical structure formation involved in morphogenesis, anatomical structure morphogenesis, regulation of angiogenesis. Genes in the left upper corner with black border were found to be upregulated in subclusters 1B and 1D. Genes in the bottom left and right corners were found to be upregulated in either subcluster 1B or 1D, respectively. Genes in the right upper corner were found to be upregulated in subclusters 1A, 1C, 1E, and 1F. Statistical methods are provided in detail in Methods.
Fig. 5
Fig. 5. In vivo vasculogenic fate change of dermal fibroblasts by wound induced suppression of miR-200b.
a Schematic diagram showing hind-limb ischemia and tissue nanotransfection technology in C57BL/6 mice. b, c Representative day 14 laser speckle image (b) and quantification (c) of hind limb perfusion at different time points post-surgery in C57BL/6 mice treated with either control LNA or LNA-anti-miR200b by tissue nanotransfection. The lines represent the mean, and the dots represent the individual value (n = 11). d, e Representative ultrasound and flow velocity images (d) and quantification of flow velocity (e) of feeder vessels supplying blood to hind limb in C57BL/6 mice treated with either control LNA or LNA-anti-miR200b post-hindlimb surgery (n = 11). f Schematic diagram of hind-limb (HL) surgery experiment in miR-200b-429fl/flCol1a2creER mice. g, h Hind-limb perfusion (g) and representative images (h) of corn oil (control) and tamoxifen treated miR-200b-429fl/flCol1a2creER mice at different time points post-surgery (n = 4). i Immunofluorescence confocal image of day 14 wound-edge tissue in miR-200b-429fl/flCol1a2creER mice stained for COL1A2 and vWF. The right panel shows the 3D-rendering of the inset in tamoxifen treated day 14 miR-200b- 429fl/flCol1a2creER mice. Scale, 100 µm. j Colocalization of COL1A2 and vWF was determined by Pearson correlation (r). Data expressed as mean ± S.D (n = 8). k The COL1A2 and vWF colocalized vascular elements were quantified in tamoxifen treated miR-200b-429fl/flCol1a2creER mice and plotted graphically. Data expressed as mean ± S.D (n = 8). Data in c, e, g, j, k were analyzed by two-tailed unpaired Student’s t test. Fig 5a, f were created with BioRender.com.
Fig. 6
Fig. 6. Topical LNA-anti-miR-200b induces emergence of vasculogenic fibroblasts in cutaneous wounds.
a, b Immunofluorescence confocal image of day 7 wounds in Fsp1-Cre tdTomato mice treated with LNA control and LNA anti-miR 200b inhibitor showing lectin perfused Fsp1 positive vessels. Scale, 20 µm. The images showing the colocalization of lectin and Fsp1 in the 3D cross-sectional view rendered by Zen software (n = 6–7). c miR-200b expression in wound-edge tissue of Fsp1-Cre tdTomato mice treated with LNA control and LNA anti-miR 200b inhibitor at day 56 (n = 6–7). d Heat map showing gene expression in laser captured samples in Fsp1-Cre tdTomato mice treated with LNA control and LNA anti-miR 200b inhibitor at day 7 and day 56 (d7, n = 4; d56, n = 5) The red asterisks indicate the gene that were upregulated at day 7 and day 56. The red arrow indicates gene that were upregulated both in day 7 and day 56. *p < 0.05. Data expressed as mean ± S.D. Data in ad were analyzed by two-tailed unpaired Student’s t test.
Fig. 7
Fig. 7. Topical LNA-anti-miR-200b induces emergence of vasculogenic fibroblasts in cutaneous wounds.
a, b miR-200b (left) and FLI1 (right) expression in human wound-edge tissue (a) and LCM captured COL1A2+ elements (b) from non-diabetic and diabetic subjects. Data expressed as mean ± S.D (n = 6). The line inside the box represents the mean in Fig. 7a (right). c Representative in situ staining of miR-200b (top) with higher (bottom) magnification and quantification in human wound-edge tissue of non-diabetic and diabetic subjects. Scale, 200 µm (n = 6). In the graph, each dot corresponds to one quantified ROI, except the blue and red dots, which correspond to the mean of each human subjects. At least 4 ROI per section. d Representative immunohistochemistry of FLI1 represented in lower (top) and higher (bottom) magnification in human wound-edge tissue of non-diabetic and diabetic subjects. Scale, 200 µm. e Schematic procedure to acquire highly multiplexed IMC from diabetic and non-diabetic wound-edge tissue. f Distribution of signal in a spatial context. The intensity of each antibody were displayed alone. DNA was used and positive control. Scale bar, 20 μm (n = 4). g The intensity of COL1A2 in both non-diabetic and dibetic human wound-edge was found to be comparable (n = 4). h The colocalization on COL1A2 with other vasculogenic fibroblasts markers were analysed in image J using color thresholding and extracted as white dots on the image. The number represents the Pearson’s correlation coefficeint quantified in image J using Coloc2 plugin. Data expressed as mean ± S.D. Data in a, b, c, g, and h were analyzed by two-tailed unpaired Student’s t test. Fig 7e created with BioRender.com.
Fig. 8
Fig. 8. Topical anti-sense oligonucleotide inhibition of miR-200b at wound-edge improves diabetic wound healing.
a miR-200b expression in skin and wound-edge tissue of non-diabetic (db/+) and diabetic (db/db) mice. Data expressed as mean ± S.D (n = 5). b Western blot analysis and densitometric quantification of FLI1 expression at wound-edge tissue of db/db mice. β-actin serves as a loading control. Data expressed as mean ± S.D (n = 5). c Representative cutaneous blood perfusion images and quantification at day 8 wound-edge tissue of db/db mice treated with either LNA-control or LNA-anti-miR-200b inhibitor. Scale, 2 mm (n = 15). d Digital photograph of db/db mice wound-edge tissue at day 0 and day 10 treated with either LNA-control or LNA-anti-miR-200b inhibitor. Scale, 2 mm. Digital planimetry of the wound area was quantified using ImageJ software and plotted graphically. The line represents the mean wound area (n = 14). e Immunofluorescence confocal image of day 10 wound-edge tissue in db/db mice stained for COL1A2 and vWF. Colocalization of COL1A2 and vWF was determined by Pearson correlation (r). Results represent mean ± S.D (n = 7,8). f Immunofluorescence confocal image of day 6 wounds in db/db mice treated with LNA-anti-miR-200b inhibitor showing lectin perfused Col1A2 positive vessles. Scale, 20 µm. The left panels show individual channels. The middle panel shows the 3D-reconstruction image of the perfused vessels. The right panels showing the colocalization of lectin and Col1A2 in the 3D cross-sectional view rendered by IMARIS (Bitplane) software (M), indicate movies for that frame in the supplement (Movie S1). g miR-200b expression at day 5 wound-edge tissue of diabetic (db/db) mice using different doses of LNA-anti-miR-200b. Data expressed as mean ± S.D (n = 4–6). Data in ad, f were analyzed by two-tailed unpaired Student’s t test. Data in g was analyzed by one-way analysis of variance with the post-hoc Bonferroni multiple comparison test.

References

    1. Mascharak S, et al. Preventing Engrailed-1 activation in fibroblasts yields wound regeneration without scarring. Science. 2021;372:eaba2374. doi: 10.1126/science.aba2374. - DOI - PMC - PubMed
    1. Tuleta I, Frangogiannis NG. Diabetic fibrosis. Biochim Biophys. Acta Mol. Basis Dis. 2021;1867:166044. doi: 10.1016/j.bbadis.2020.166044. - DOI - PMC - PubMed
    1. Shaw TJ, Rognoni E. Dissecting fibroblast heterogeneity in health and fibrotic disease. Curr. Rheumatol. Rep. 2020;22:33. doi: 10.1007/s11926-020-00903-w. - DOI - PMC - PubMed
    1. Leavitt T, et al. Scarless wound healing: finding the right cells and signals. Cell Tissue Res. 2016;365:483–493. doi: 10.1007/s00441-016-2424-8. - DOI - PMC - PubMed
    1. Deng CC, et al. Single-cell RNA-seq reveals fibroblast heterogeneity and increased mesenchymal fibroblasts in human fibrotic skin diseases. Nat. Commun. 2021;12:3709. doi: 10.1038/s41467-021-24110-y. - DOI - PMC - PubMed

Publication types