. 2023 Feb 28;14(1):1132.
doi: 10.1038/s41467-023-36638-2.

Fine mapping spatiotemporal mechanisms of genetic variants underlying cardiac traits and disease

Collaborators, Affiliations

Fine mapping spatiotemporal mechanisms of genetic variants underlying cardiac traits and disease

Matteo D'Antonio et al. Nat Commun. .

Erratum in

Abstract

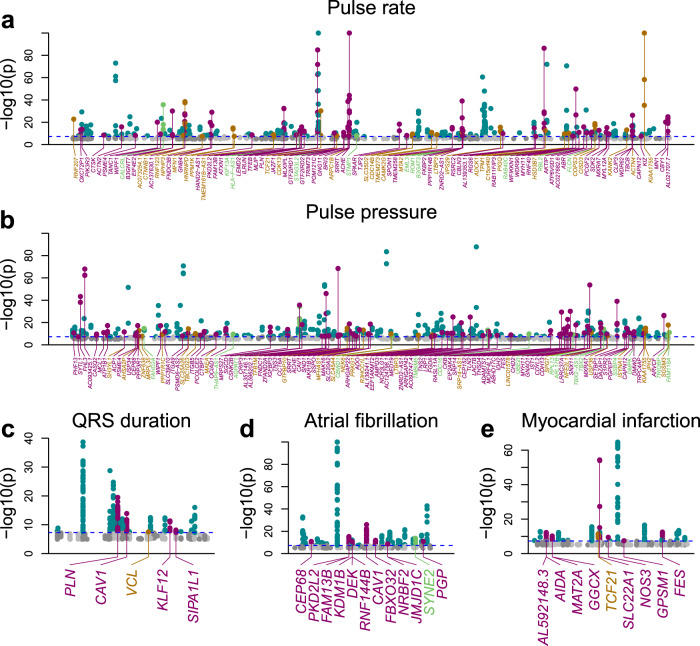
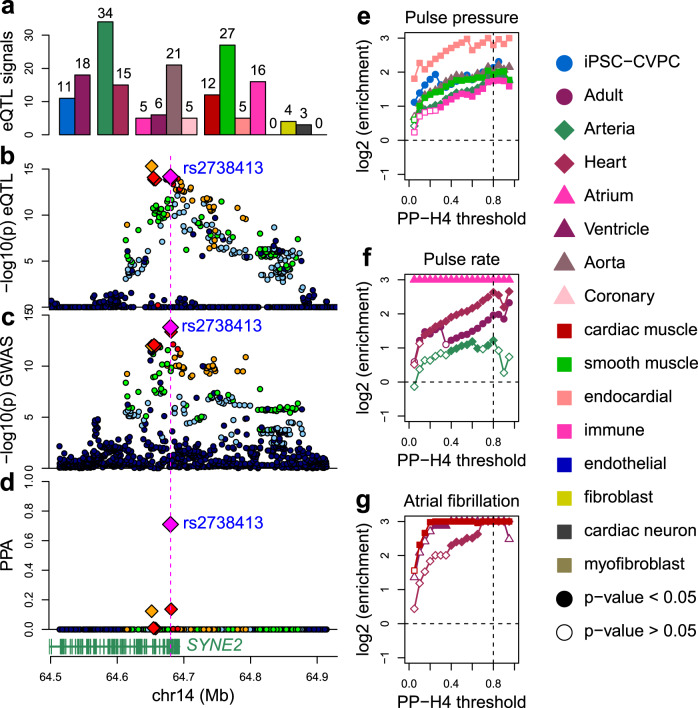
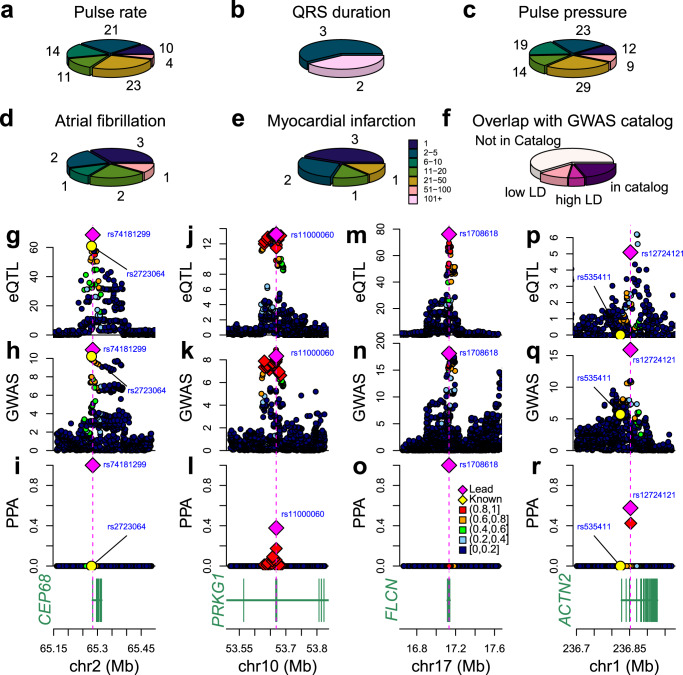
The causal variants and genes underlying thousands of cardiac GWAS signals have yet to be identified. Here, we leverage spatiotemporal information on 966 RNA-seq cardiac samples and perform an expression quantitative trait locus (eQTL) analysis detecting eQTLs considering both eGenes and eIsoforms. We identify 2,578 eQTLs associated with a specific developmental stage-, tissue- and/or cell type. Colocalization between eQTL and GWAS signals of five cardiac traits identified variants with high posterior probabilities for being causal in 210 GWAS loci. Pulse pressure GWAS loci are enriched for colocalization with fetal- and smooth muscle- eQTLs; pulse rate with adult- and cardiac muscle- eQTLs; and atrial fibrillation with cardiac muscle- eQTLs. Fine mapping identifies 79 credible sets with five or fewer SNPs, of which 15 were associated with spatiotemporal eQTLs. Our study shows that many cardiac GWAS variants impact traits and disease in a developmental stage-, tissue- and/or cell type-specific fashion.


Conflict of interest statement

The authors declare no competing interests.

Figures

Fig. 1
Fig. 1. Gene and isoform eQTLs.
a Barplot showing the number of eQTLs for eGenes (left) and eIsoforms (right). Colors represent the number of eGenes with primary and conditional eQTLs (up to five conditional signals). b Barplot showing the distribution of PPA for each of the five colocalization hypotheses. All the colocalizations associated with hypothesis 0, 1, and 2 were likely underpowered, thus they were labeled as “not resolved (NR)”. The 1421 eIsoforms whose associated gene did not have an eQTL were labeled as “no eGene”. c, d Examples of (c) eQTL signal for an eGene (B4GALT7) that colocalizes with PPA = 1 with the eQTL signal of one associated eIsoform and (d) eQTL signal for an eGene (RNH1) that does not colocalize with the eQTL signal of one associated eIsoform. In each plot, X axis represents the −log10 (eQTL p-value) for the associations between the genotype of each tested variant and gene expression, whereas the Y axis shows the −log10 (eQTL p-value) for the associations between the genotype of each tested variant and isoform use. e Enrichment of eGenes compared with eIsoforms for overlapping intergenic regions, introns, promoters, UTRs, splice donor sites, splice acceptor sites (short = the first 5 nucleotides upstream of the splice site; long = the first 100 bp) and exons. P-values were calculated using Fisher’s exact test. Points (blue = enriched for eGenes; red = enriched for eIsoforms; gray = not significant) represent log2 enrichment and horizontal lines represent 95% confidence intervals calculated using the fisher.test function in R. f, g Median normalized read depth signal of ADAM15 gene expression levels in iPSC-CVPCs. Different colors represent the genotypes of the lead eVariant for isoform ENST00000271836.10_1 (rs11589479, G > A). The blue rectangle in (f) is enlarged in (g). rs11589479 overlaps the splice donor site for exon 19 and its position is shown as a vertical dashed line in (g). The plots show that the exon whose splice site is affected by rs11589479 becomes expressed at lower levels when the variant is heterozygous or homozygous alternative, as it disrupts the splice site.
Fig. 2
Fig. 2. Stage, organ, tissue, and cell type eQTLs.
a, b Barplots showing the number of a eGenes and b eIsoforms associated with: cardiac stage (iPSC-CVPC or adult); organ (arteria or heart); tissue (atrial appendage, left ventricle, aorta or coronary artery); and cell type. Non-hatched bar sections represent eQTLs that are associated with the indicated stage, organ, tissue or cell type, and hatched sections represent specific eQTLs. ce Examples of three association types between eQTLs and cardiac stage. For each eGene, boxplots (n = 966 samples) describe the normalized expression in iPSC-CVPCs (blue) and all other samples (i.e., adult cardiac samples; gray), grouped by genotype. The panels show examples of: c an eGene whose eQTL is shared across both cardiac stages; d an iPSC-CVPC-specific eQTL: the association between genotype and gene expression is only present in iPSC-CVPCs; and e iPSC-CVPC-associated eQTL: while the genotype is associated with gene expression in both iPSC-CVPCs and the adult samples, the eQTL is significantly stronger in iPSC-CVPCs. All five possible association types are shown in Supplementary Fig. 1. The boxplots were built as follows: upper and lower edges represent the 25th and 75th percentiles and the middle line the median, vertical bars represent the distance from the 25th (or 75th) percentile minus (or plus) 1.5 times the interquartile range. fh Examples of associations between eQTLs and cell types. For each eGene, boxplots (n = 966 samples) describe the normalized expression divided into four quartiles according to their cardiac muscle proportion (yellow = low; purple = high), grouped by genotype. The panels show examples of: f an eGene whose eQTL is shared across cell types; g a cardiac muscle-specific eQTL: the association between genotype and gene expression is only present in the top quartiles; and h cardiac muscle-associated eQTL: while the genotype is associated with gene expression in all quartiles, the eQTL is significantly stronger in the top quartiles. All five possible association types are shown in Supplementary Fig. 3.
Fig. 3
Fig. 3. eQTL signals associated with multiple genes.
a Enrichment of eGenes that share the same eQTL signal with other eGenes or eIsoforms for having stage-, organ-, tissue- and cell type- eQTLs measured by linear regression analysis (n = 2778). Dots represent effect size and segments represent standard errors. Effect sizes, standard errors and p-values were measured using the lm function in R. b eGenes that share the same eQTL signals are enriched for being associated with same stage, organ, tissue, or cell type calculated using a permutation test. Dots represent Z-scores. ch eQTL signals shared between a gene and its associated antisense RNA: ce PAX8 and PAX8-AS1; fh IRF1 and IRF1-AS1. c, f scatterplots showing the –log10 (eQTL p-value) for the gene (X axis; c: PAX8; f: IRF1) and for the antisense RNA (Y axis; c: PAX8-AS1; f: IRF1-AS1). d, e, g, h eQTL signal for the gene (in blue, panels d and g) and for the antisense RNA (in green, panels e and h).
Fig. 4
Fig. 4. Manhattan plots showing the GWAS signals that colocalize with eQTLs.
ae Manhattan plots showing the GWAS signals for five cardiac traits. Among all genome-wide significant SNPs, the GWAS signals that colocalize with eQTLs for eGenes are highlighted in purple, with eQTLs for eIsoforms (light brown), with eQTL signals for both eGenes and eIsoforms (green), and those that do not colocalize with eQTLs are shown in turquoise. Horizontal dashed blue line represents the genome-wide significance threshold (GWAS p = 5 × 10−8).
Fig. 5
Fig. 5. Colocalization between spatiotemporal eQTLs and cardiac GWAS.
a Barplots showing the number of spatiotemporal eQTL signals that colocalize with cardiac GWAS signals. We observed 51 eGenes and 21 eIsoforms that were associated with one or more spatiotemporal categories colocalize with GWAS traits. Colors represent cardiac stage, organ, tissue, and cell type as described in the legend on the right. bd Plots showing (b) −log10(p-value) for cardiac muscle- eQTL signal for SYNE2, c the GWAS signal for atrial fibrillation and d the PPA of each variant in the colocalization. The lead variant (i.e., the variant with highest PPA of being causal for both the eQTL and GWAS signals) is shown as a magenta diamond: all non-lead variants with PPA > 0.01 are shown as smaller red diamonds. The variant with the strongest p-value in the eQTL signal is shown as an orange diamond. eg Line plots showing the enrichment of stage-, organ-, tissue- and cell-type- eQTLs in various GWAS traits: e pulse pressure; f pulse rate; and g atrial fibrillation (ICD10 code: I48). Enrichment is plotted as the log (odds ratio) (Y axis) over all PP-H4 thresholds (0.05 to 0.95, in 0.05 increments) of the eQTL signal colocalizing (0 = not colocalizing; 1 = completely colocalizing) with the GWAS signal (X axis). Only contexts with FDR-corrected p-value <0.01 at PP-H4 = 0.8 are shown. All associations for the five traits are shown in Supplementary Figs. 10, 11, and 12.
Fig. 6
Fig. 6. Fine mapping of stage and cell type- eQTLs colocalizing with cardiac traits.
ae Pie charts showing for each cardiac trait the distribution of SNPs in 99% credible sets. The colors indicate the number of SNPs and the numbers around the perimeter indicate the number of credible sets. f Pie chart showing the overlap between the lead SNP at each GWAS signal in the five cardiac traits and the index SNP for the GWAS signal in the GWAS catalog for the same trait. SNPs in high LD have R2 > 0.8 and SNPs in low LD have 0.2 ≤ R2 ≤ 0.8. go Plots showing −log10(p-value) eQTL signals (top row; panels g, j, m, p), the GWAS signals (middle row; panels h, k, n, q) and the PPA of each variant in the colocalization (bottom row; panels i, l, o, r) at four loci: (gi) CEP68 expression and atrial fibrillation; jl PRKG1 (isoform ENST00000643582.1_1) expression and pulse pressure; mo FLCN expression and pulse rate; and pr ACTN2 expression and pulse rate.

References

    1. Buniello A, et al. The NHGRI-EBI GWAS Catalog of published genome-wide association studies, targeted arrays and summary statistics 2019. Nucleic Acids Res. 2019;47:D1005–D1012. - PMC - PubMed
    1. Roselli C, et al. Multi-ethnic genome-wide association study for atrial fibrillation. Nat. Genet. 2018;50:1225–1233. - PMC - PubMed
    1. van Setten J, et al. PR interval genome-wide association meta-analysis identifies 50 loci associated with atrial and atrioventricular electrical activity. Nat. Commun. 2018;9:2904. - PMC - PubMed
    1. Nielsen JB, et al. Biobank-driven genomic discovery yields new insight into atrial fibrillation biology. Nat. Genet. 2018;50:1234–1239. - PMC - PubMed
    1. Loots GG, et al. Identification of a coordinate regulator of interleukins 4, 13, and 5 by cross-species sequence comparisons. Science. 2000;288:136–140. - PubMed

Publication types