. 2023 Mar;55(3):520-531.
doi: 10.1038/s12276-023-00947-9. Epub 2023 Mar 1.

TGFBI remodels adipose metabolism by regulating the Notch-1 signaling pathway

Affiliations

TGFBI remodels adipose metabolism by regulating the Notch-1 signaling pathway

Seul Gi Lee et al. Exp Mol Med. 2023 Mar.

Abstract

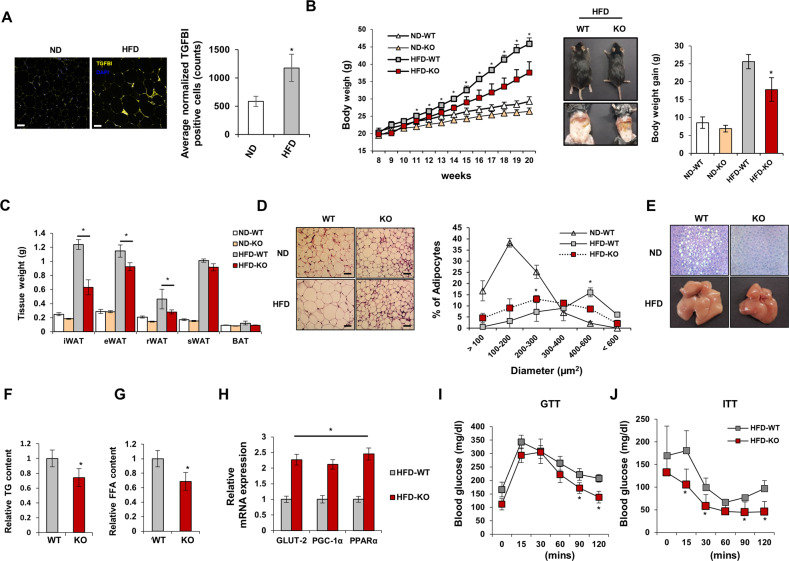
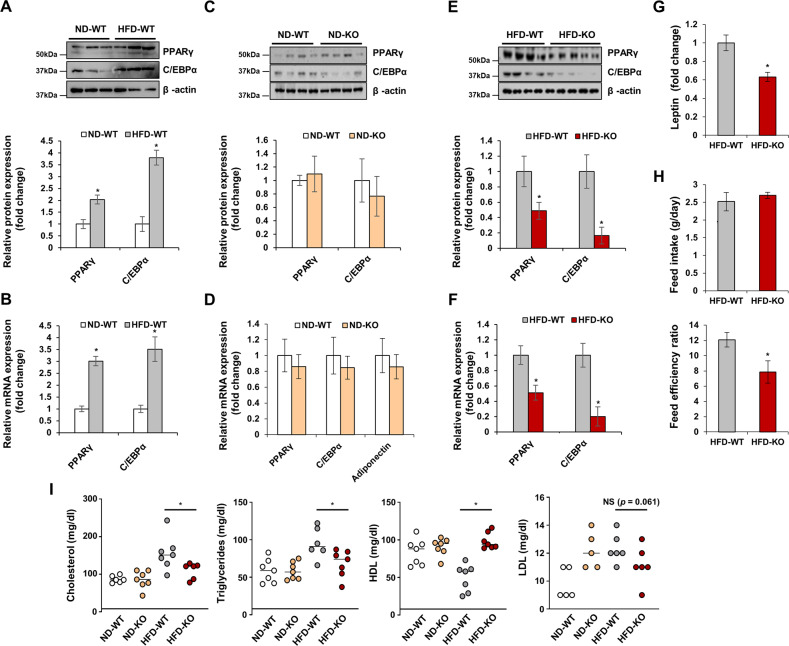
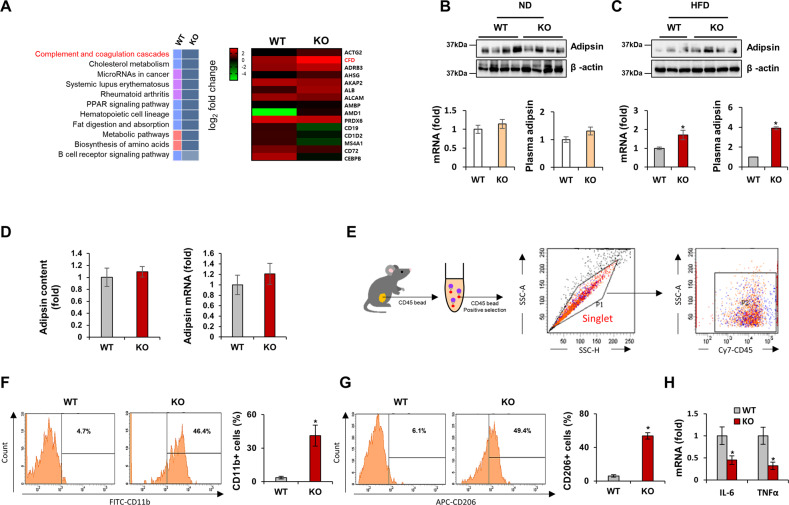
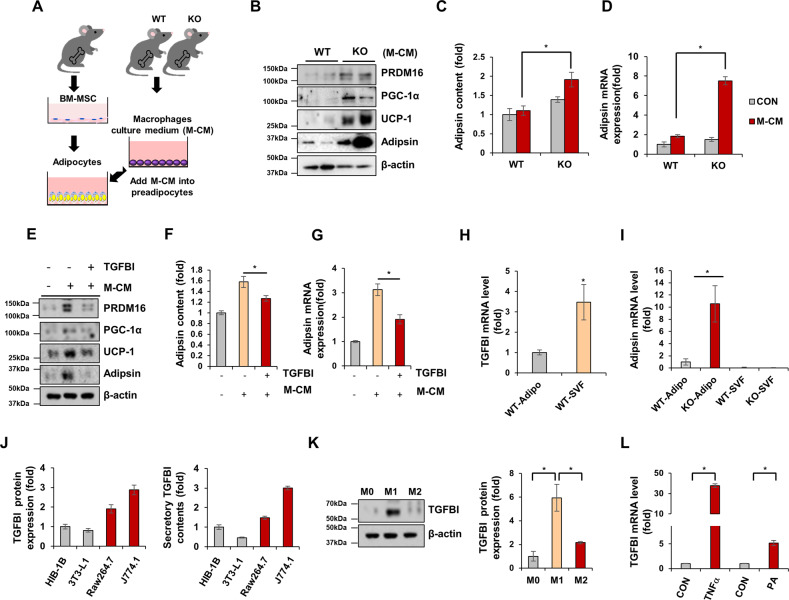
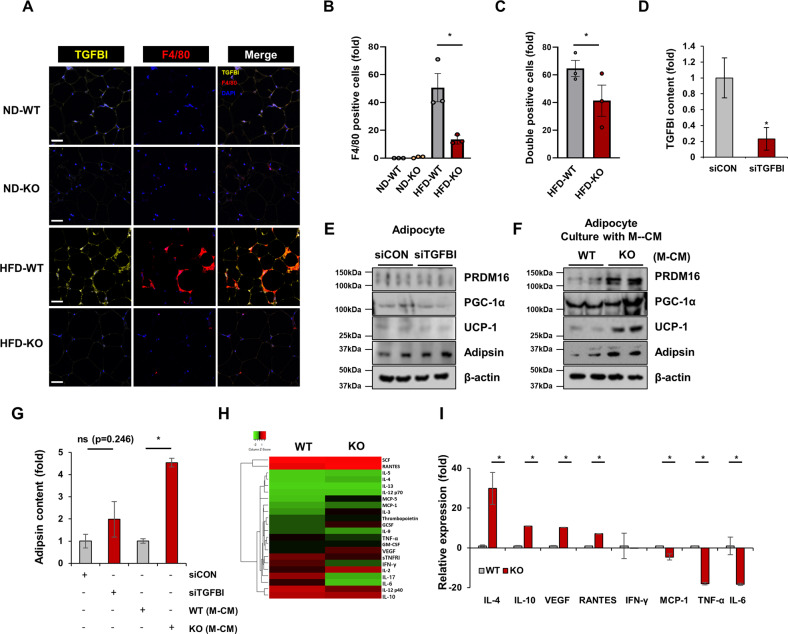
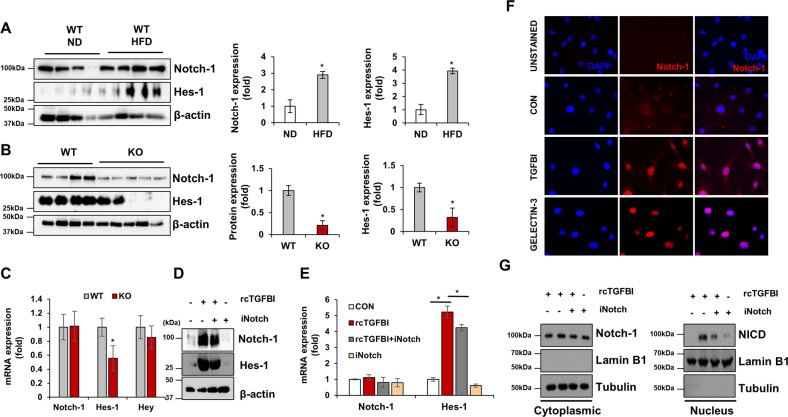
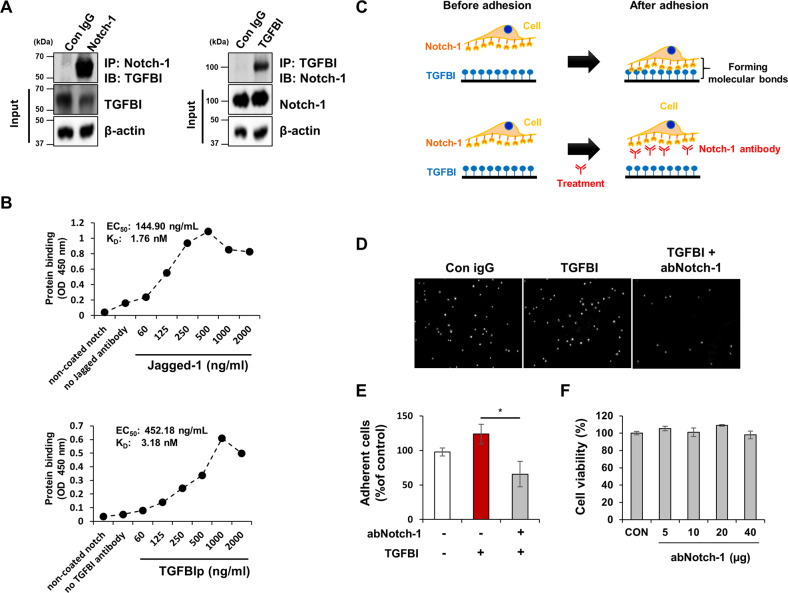
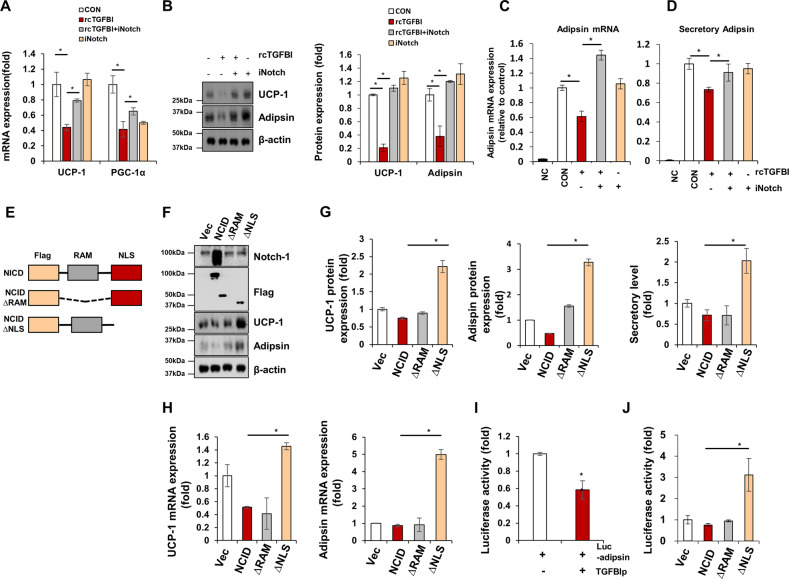
Extracellular matrix proteins are associated with metabolically healthy adipose tissue and regulate inflammation, fibrosis, angiogenesis, and subsequent metabolic deterioration. In this study, we demonstrated that transforming growth factor-beta (TGFBI), an extracellular matrix (ECM) component, plays an important role in adipose metabolism and browning during high-fat diet-induced obesity. TGFBI KO mice were resistant to adipose tissue hypertrophy, liver steatosis, and insulin resistance. Furthermore, adipose tissue from TGFBI KO mice contained a large population of CD11b+ and CD206+ M2 macrophages, which possibly control adipokine secretion through paracrine mechanisms. Mechanistically, we showed that inhibiting TGFBI-stimulated release of adipsin by Notch-1-dependent signaling resulted in adipocyte browning. TGFBI was physiologically bound to Notch-1 and stimulated its activation in adipocytes. Our findings revealed a novel protective effect of TGFBI deficiency in obesity that is realized via the activation of the Notch-1 signaling pathway.


Conflict of interest statement

The authors declare no competing interests.

Figures

Fig. 1
Fig. 1. TGFBI-deficient mice are resistant to high-fat diet-induced obesity.
A TGFBI was stained in iWAT from ND-fed or HFD-fed mice and quantified (right). Scale bar, 40 µm. B WT and KO mice (8 weeks old) were fed a high-fat diet (HFD) or normal diet (ND) for 12 weeks, and body weight was recorded every week (left). On the final day of the experiment, representative photos were taken of the HFD-fed WT and KO mice (middle). The gain in body weight was calculated using the following formula: final weight (20 weeks old) – initial weight (8 weeks old). C Indicated organ weights from the above mice. D Representative H&E staining of iWAT obtained from the ND- or HFD-fed WT and KO mice. Scale bar, 50 µm. (left). Diameter distribution of adipocytes in the indicated adipose tissues (right). E Representative H&E staining of livers from the 20-week-old HFD-fed WT and KO mice. The bottom panel shows representative livers from the above mice. F-G TG and FFA content from the HFD-fed WT and KO mice. H Relative mRNA expression of the indicated genes in the livers of the HFD-fed WT and KO mice. I-J GTT and ITT results. Error bars represent the ± SEM. *p < 0.05 by two-sided t test.
Fig. 2
Fig. 2. HFD-fed TGFBI-deficient mice show reduced expression of adipogenic genes.
A-F Protein and mRNA expression of the indicated genes in iWAT obtained from ND-fed (A-B) or HFD-fed (C-D) WT and KO mice. The expression levels were normalized to those of β-actin. G Relative plasma leptin levels of the HFD-fed WT and KO mice. H Feed intake was calculated using the following formula: total feed intake (entire experimental period)/days (entire experimental period, 83 days). The feed efficiency ratio was calculated using the following formula: body weight gain (g)/amount of feed provided (g) × 100. i Plasma cholesterol, TG, HDL (high-density lipoprotein), and LDL (low-density lipoprotein) were determined in the ND-fed or HFD-fed WT and KO mice. Error bars represent the mean ± SEM. *p < 0.05 by two-sided t test.
Fig. 3
Fig. 3. TGFBI KO mice show increased adipsin expression and macrophage infiltration in adipose tissue.
A Gene set enrichment (left) and expression heatmap (right) in iWAT obtained from 20-week-old HFD-fed WT and KO mice. B-C Adipsin expression levels were verified by performing western blot analysis (upper), qRT‒PCR (bottom, left), and ELISAs (bottom, right) in iWAT obtained from the ND-fed (B) and HFD-fed (C) WT and KO mice. D Secretory (left) and mRNA expression of adipsin (right) in differentiated BM-MSCs isolated from the WT and KO mice. E Cy7-CD45-positive cells were isolated from iWAT of the WT and TGFBI KO mice and identified by FACS. F-G FITC-CD11b- (F) and APC-CD206-positive (G) cells were verified and quantified (right). H Relative mRNA levels of the indicated genes in iWAT obtained from the above mice. Error bars represent the ± SEM. *p < 0.05 by two-sided t test.
Fig. 4
Fig. 4. TGFBI-deficient macrophages induced increased adipsin and browning-related protein expression on adipocytes in a paracrine manner.
A Schematic of the experimental design. BM-MSCs were isolated from WT mice and induced to differentiate with M-CM obtained from WT or KO mice. B Expression of the indicated proteins in differentiated BM-MSCs cultured with WT or KO macrophages. C-D Secretory and mRNA expression of adipsin in the above cells. E-G BM-MSCs were either unstimulated or treated with 10 µg recombinant TGFBI under coculture conditions with TGFBI KO macrophages. Expression of the indicated proteins (E) and secretory (F) and mRNA (G) levels of adipsin in the above cells. H–I Adipocytes and SVFs were isolated from iWAT obtained from WT and KO mice. The mRNA expression of TGFBI (H) and adipsin (I) was measured in the indicated fractions. J TGFBI expression in differentiated HIB-1B and 3T3-L1 adipocytes and Raw264.7 and J774.1 macrophages (M1 phenotype) was assessed by western blot analysis (left) and ELISAs (right). K Human THP-1 macrophages were treated with 10 ng/mL LPS and 20 ng/mL IFN-γ or 20 ng/mL IL-4 and 20 ng/mL IL-13 for polarization into M1 and M2 macrophages, respectively. TGFBI expression was verified and quantified (right panel). L THP-1 macrophages were treated with rhTNFα (20 ng/mL) and palmitic acid (200 µM). TGFBI mRNA expression was verified. Error bars represent the ± SEM. *p < 0.05 by two-sided t test.
Fig. 5
Fig. 5. TGFBI KO BM-DMs secrete unique cytokines.
A-C TGFBI, F4/80, and DAPI were multistained in iWAT from ND-fed or HFD-fed WT and KO mice. F4/80 single-positive (B) or F4/80 and TGFBI double-positive (C) cells were counted in whole tissue from three individual mice per experimental group. D-F 3T3-L1 preadipocytes were transfected with lentivirus encoding either TGFBI or control siRNA. After infection, the cells were induced to differentiate into mature adipocytes, and the expression of the indicated proteins was verified using western blot analysis (D). Parental 3T3-L1 adipocytes were cocultured with either WT or TGFBI KO BM-DMs (F). The indicated proteins were assessed using western blotting (F) and ELISAs (G). H-I Expression heatmap showing changes in cytokines secreted by BM-DMs in the WT and TGFBI KO mice (n = 3). The expression level of each cytokine is shown in a green (low expression) and red (high expression) color scheme. Error bars represent ± SEM. *p < 0.05 by two-sided t test.
Fig. 6
Fig. 6. TGFBI regulates the activation of Notch-1 in adipocytes.
A Notch-1 and Hes-1 protein expression in iWAT obtained from ND- and HFD-fed WT mice. B, C Protein and mRNA expression of the indicated genes in iWAT obtained from the HFD-fed WT and KO mice. D-E The 3T3-L1 adipocyte line was treated with SHAM1 (Notch-1 inhibitor) in the presence or absence of recombinant TGFBI. F Localization of Notch-1 in 3T3-L1 cells treated with either recombinant TGFBI or galectin-3. G Indicated protein expression in the cytoplasm (left) and nucleus (right).
Fig. 7
Fig. 7. TGFBI physiologically interacts with Notch-1.
A IP analysis of the interaction of Notch-1 and TGFBI. B Non-cell-based binding assay. Recombinant Notch-1 protein was precoated and allowed to bind to TGFBI or Jagged-1 at the indicated concentrations. C Schematic of the experimental design for the cell adhesion assay. D-E Pretreatment of 3T3-L1 adipocytes with either control IgG or Notch-1-specific antibody (abNotch-1) was performed, and the cells were allowed to adhere to recombinant TGFBI-coated plates. F Cytotoxicity of abNotch-1 at the indicated concentrations was tested using an MTT assay. Error bars represent the ± SEM. *p < 0.05 by two-sided t test.
Fig. 8
Fig. 8. Notch-1 represses adipsin promoter activity and browning-related protein expression.
The 3T3-L1 adipocyte line was treated with Notch-1 inhibitor throughout the differentiation period in the presence or absence of recombinant TGFBI. A,B mRNA and protein expression of the indicated genes. C, D Adipsin mRNA and secretory levels of each indicated group. E The 3T3-L1 adipocytes were transfected with the indicated WT and mutant Notch-1 (RAM and NLS). F-H Protein (F-G) and mRNA (H) expression of the indicated genes in transfected cells. I HEK293 cells were transfected with an Adipsin-Luc vector (−430 bp) in the presence or absence of recombinant TGFBI. J HEK293 cells were cotransfected with the indicated Notch-1 construct and Adipsin-Luc vector. Error bars represent the ± SEM. *p < 0.05 by two-sided t test.

References

    1. Kaila B, Raman M. Obesity: A Review of Pathogenesis and Management Strategies. Can. J. Gastroenterol. 2008;22:61–68. doi: 10.1155/2008/609039. - DOI - PMC - PubMed
    1. Peirson L, et al. Treatment for overweight and obesity in adult populations: a systematic review and meta-analysis. CMAJ Open. 2014;2:E306–E317. doi: 10.9778/cmajo.20140012. - DOI - PMC - PubMed
    1. Han TS, Lean ME. A clinical perspective of obesity, metabolic syndrome and cardiovascular disease. JRSM Cardiovasc. Dis. 2016;5:204800401663337. doi: 10.1177/2048004016633371. - DOI - PMC - PubMed
    1. Guilherme A, Virbasius JV, Puri V, Czech MP. Adipocyte dysfunctions linking obesity to insulin resistance and type 2 diabetes. Nat. Rev. Mol. Cell Biol. 2008;9:367–377. doi: 10.1038/nrm2391. - DOI - PMC - PubMed
    1. Scherer PE. Adipose Tissue. Diabetes. 2006;55:1537–1545. doi: 10.2337/db06-0263. - DOI - PubMed

Publication types

Substances