. 2023 Feb 28;24(1):91.
doi: 10.1186/s12864-023-09188-6.

Brain fatty acid and transcriptome profiles of pig fed diets with different levels of soybean oil

Affiliations

Brain fatty acid and transcriptome profiles of pig fed diets with different levels of soybean oil

Bruna Pereira da Silva et al. BMC Genomics. .

Abstract

Background: The high similarity in anatomical and neurophysiological processes between pigs and humans make pigs an excellent model for metabolic diseases and neurological disorders. Lipids are essential for brain structure and function, and the polyunsaturated fatty acids (PUFA) have anti-inflammatory and positive effects against cognitive dysfunction in neurodegenerative diseases. Nutrigenomics studies involving pigs and fatty acids (FA) may help us in better understanding important biological processes. In this study, the main goal was to evaluate the effect of different levels of dietary soybean oil on the lipid profile and transcriptome in pigs' brain tissue.

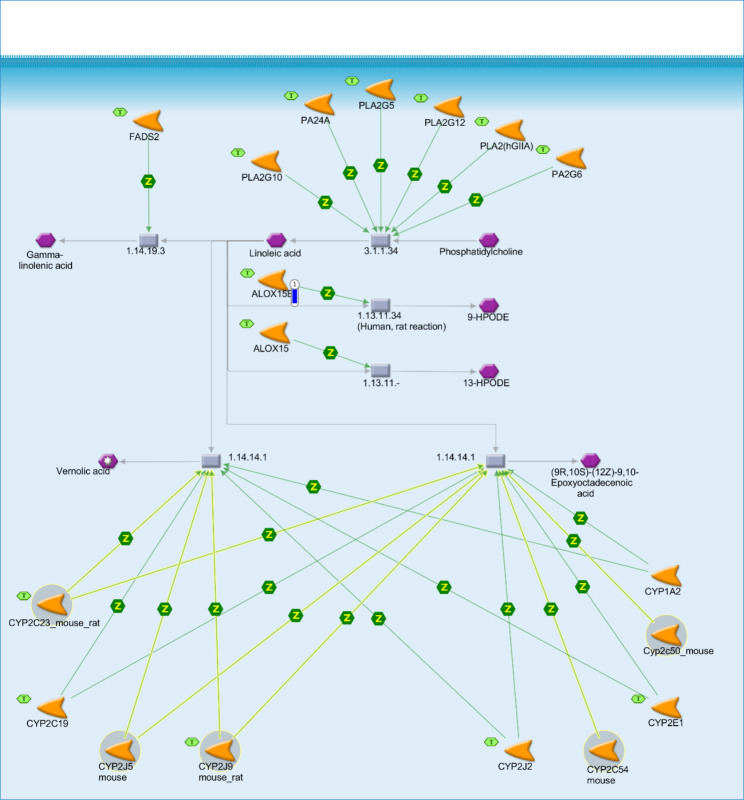
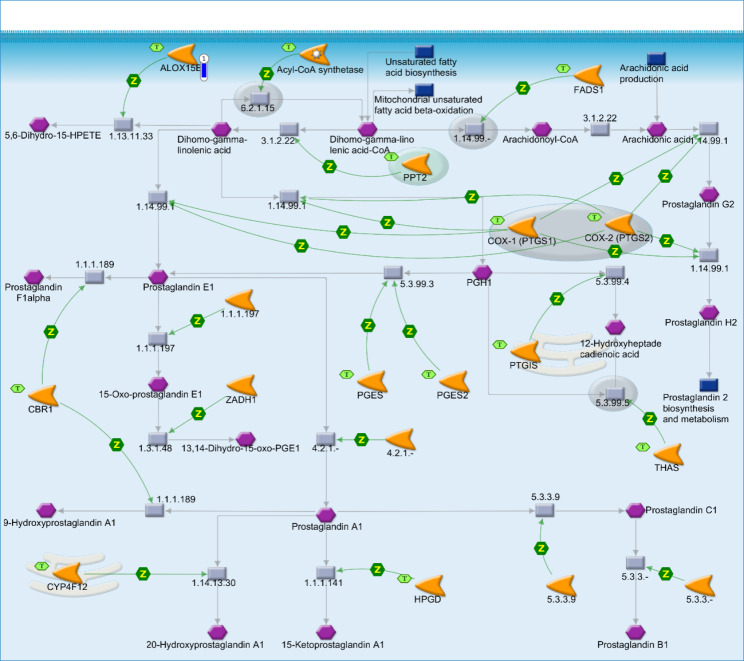
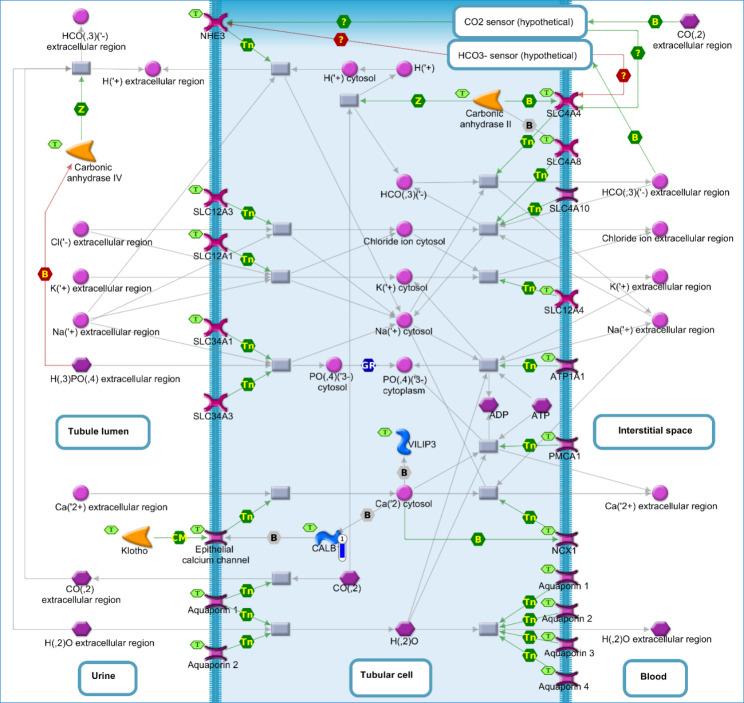
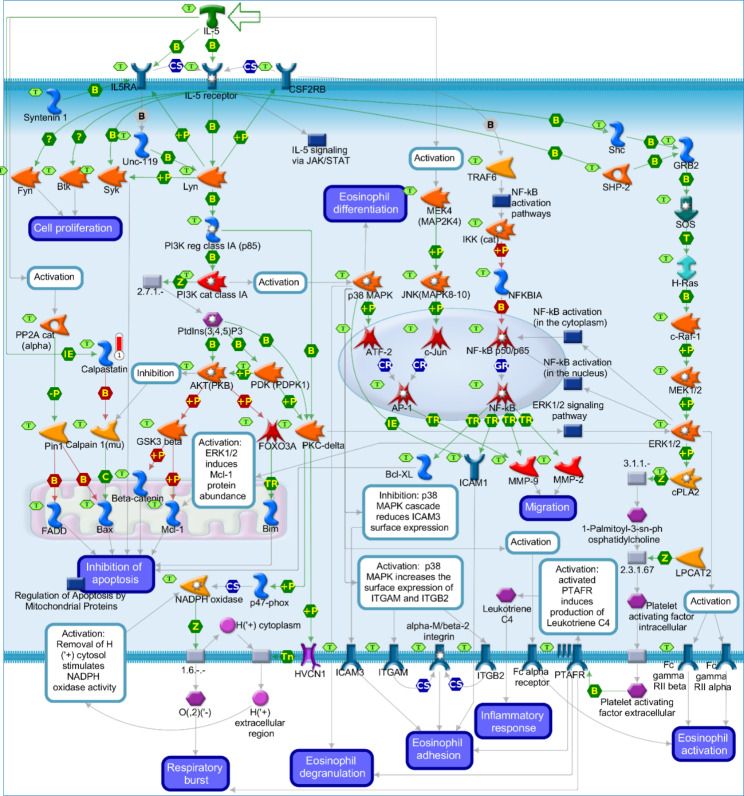
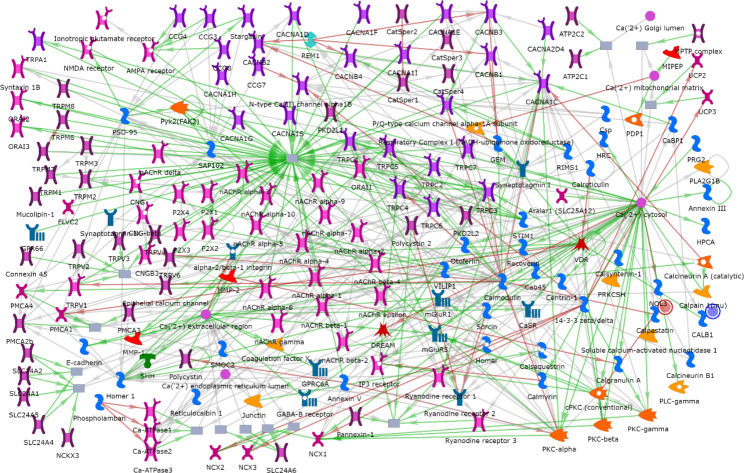
Results: Thirty-six male Large White pigs were used in a 98-day study using two experimental diets corn-soybean meal diet containing 1.5% soybean oil (SOY1.5) and corn-soybean meal diet containing 3.0% soybean oil (SOY3.0). No differences were found for the brain total lipid content and FA profile between the different levels of soybean oil. For differential expression analysis, using the DESeq2 statistical package, a total of 34 differentially expressed genes (DEG, FDR-corrected p-value < 0.05) were identified. Of these 34 DEG, 25 are known-genes, of which 11 were up-regulated (log2 fold change ranging from + 0.25 to + 2.93) and 14 were down-regulated (log2 fold change ranging from - 3.43 to -0.36) for the SOY1.5 group compared to SOY3.0. For the functional enrichment analysis performed using MetaCore with the 34 DEG, four pathway maps were identified (p-value < 0.05), related to the ALOX15B (log2 fold change - 1.489), CALB1 (log2 fold change - 3.431) and CAST (log2 fold change + 0.421) genes. A "calcium transport" network (p-value = 2.303e-2), related to the CAST and CALB1 genes, was also identified.

Conclusion: The results found in this study contribute to understanding the pathways and networks associated with processes involved in intracellular calcium, lipid metabolism, and oxidative processes in the brain tissue. Moreover, these results may help a better comprehension of the modulating effects of soybean oil and its FA composition on processes and diseases affecting the brain tissue.

Keywords: Calcium transport; Immune response; Lipid metabolism; Oxidative processes; Pigs; Soybean oil.


Conflict of interest statement

The authors declare that the research was conducted in the absence of any commercial or financial relationships that could be construed as a potential conflict of interest.

Figures

Fig. 1
Fig. 1
Linoleic acid metabolism in brain tissue of pigs fed diets containing different levels of soybean oil (SOY1.51 vs. SOY3.02). 1SOY1.5: corn-soybean meal diet containing 1.5% soybean oil. 2SOY1.5: corn-soybean meal diet containing 3.0% soybean oil. The experimental data is represented by the thermometer-like figure on the map. The downward thermometer (blue) indicates down-regulation of the ALOX15B DEG (log2 fold change − 1.489) in the SOY1.5 group compared to SOY3.0. Network objects are represented by individual symbols. The green “T” icon shows which object is associated with the brain tissue. Interactions between objects are represented by arrows, mechanisms, and logical relationships. Further explanations are provided at https://portal.genego.com/legends/MetaCoreQuickReferenceGuide.pdf.
Fig. 2
Fig. 2
Prostaglandin-1 biosynthesis and metabolism in brain tissue of pigs fed diets containing different levels of soybean oil (SOY1.51 vs. SOY3.02). 1SOY1.5: corn-soybean meal diet containing 1.5% soybean oil. 2SOY1.5: corn-soybean meal diet containing 3.0% soybean oil. The experimental data is represented by the thermometer-like figure on the map. The downward thermometer (blue) indicates down-regulation of the ALOX15B DEG (log2 fold change − 1.489) in the SOY1.5 group compared to SOY3.0. Network objects are represented by individual symbols. The green “T” icon shows which object is associated with the brain tissue. Interactions between objects are represented by arrows, mechanisms, and logical relationships. Further explanations are provided at https://portal.genego.com/legends/MetaCoreQuickReferenceGuide.pdf.
Fig. 3
Fig. 3
Renal secretion of inorganic electrolytes in brain tissue of pigs fed diets containing different levels of soybean oil (SOY1.51 vs. SOY3.02). 1SOY1.5: corn-soybean meal diet containing 1.5% soybean oil. 2SOY1.5: corn-soybean meal diet containing 3.0% soybean oil. The experimental data is represented by the thermometer-like figure on the map. The downward thermometer (blue) indicates down-regulation of the CALB1 DEG (log2 fold change − 3.431) in the SOY1.5 group compared to SOY3.0. Network objects are represented by individual symbols. The green “T” icon shows which object is associated with the brain tissue. Interactions between objects are represented by arrows, mechanisms, and logical relationships. Further explanations are provided at https://portal.genego.com/legends/MetaCoreQuickReferenceGuide.pdf.
Fig. 4
Fig. 4
Immune response_IL-5_signaling in brain tissue of pigs fed diets containing different levels of soybean oil (SOY1.51 vs. SOY3.02). 1SOY1.5: corn-soybean meal diet containing 1.5% soybean oil. 2SOY1.5: corn-soybean meal diet containing 3.0% soybean oil. The experimental data is represented by the thermometer-like figure on the map. The upward thermometer (red) indicates up-regulation of the CAST DEG (log2 fold change + 0.421) in the SOY1.5 group compared to SOY3.0. Network objects are represented by individual symbols. The green “T” icon shows which object is associated with the brain tissue. Interactions between objects are represented by arrows, mechanisms, and logical relationships. Further explanations are provided at https://portal.genego.com/legends/MetaCoreQuickReferenceGuide.pdf.
Fig. 5
Fig. 5
Calcium transport in brain tissue of pigs fed diets containing different levels of soybean oil (SOY1.51 vs. SOY3.02). 1SOY1.5: corn-soybean meal diet containing 1.5% soybean oil. 2SOY1.5: corn-soybean meal diet containing 3.0% soybean oil. The experimental data are represented by the intensity of the blue and red circles on the network. The blue circle indicates down-regulation of the CALB1 DEG, and the red circle indicates up-regulation of the CAST DEG SOY1.5 group compared to SOY3.0. Green arrows indicate positive interactions, red arrows indicate negative interactions, and gray arrows indicate unspecified interactions. Further explanations are provided at https://portal.genego.com/legends/MetaCoreQuickReferenceGuide.pdf.

References

    1. OECD-FAO. OECD-FAO Agricultural Outlook 2021–2030. OECD; 2021.
    1. Pan Z, Yao Y, Yin H, Cai Z, Wang Y, Bai L, et al. Pig genome functional annotation enhances the biological interpretation of complex traits and human disease. Nat Commun. 2021;12:5848. doi: 10.1038/s41467-021-26153-7. - DOI - PMC - PubMed
    1. Lind NM, Moustgaard A, Jelsing J, Vajta G, Cumming P, Hansen AK. The use of pigs in neuroscience: modeling brain disorders. Neurosci Biobehav Rev. 2007;31:728–51. doi: 10.1016/j.neubiorev.2007.02.003. - DOI - PubMed
    1. Lunney JK. Advances in Swine Biomedical Model Genomics. Int J Biol Sci. 2007;3:179–84. doi: 10.7150/ijbs.3.179. - DOI - PMC - PubMed
    1. Dawson H, Chen C, Wang T, Urban J. Comparative Nutrigenomics Analysis of the Pig, Mouse and Human (P15-004-19).Curr Dev Nutr. 2019;3.

LinkOut - more resources