. 2023 Feb 28;11(1):31.
doi: 10.1186/s40478-023-01530-z.

Monocyte-derived cells invade brain parenchyma and amyloid plaques in human Alzheimer's disease hippocampus

Affiliations

Monocyte-derived cells invade brain parenchyma and amyloid plaques in human Alzheimer's disease hippocampus

Clara Muñoz-Castro et al. Acta Neuropathol Commun. .

Abstract

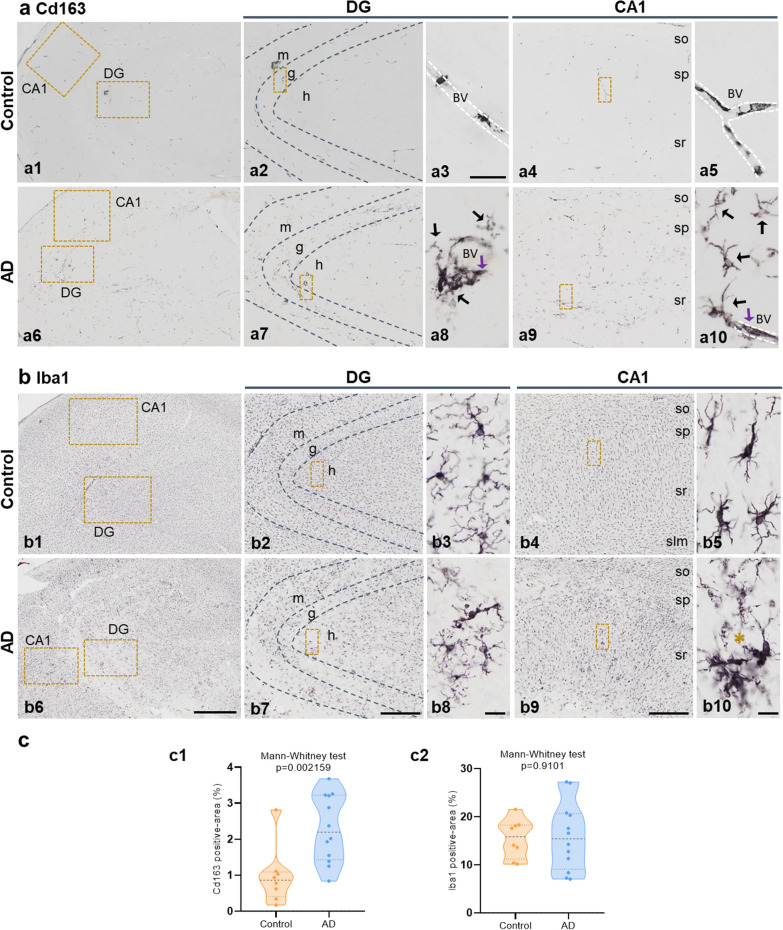
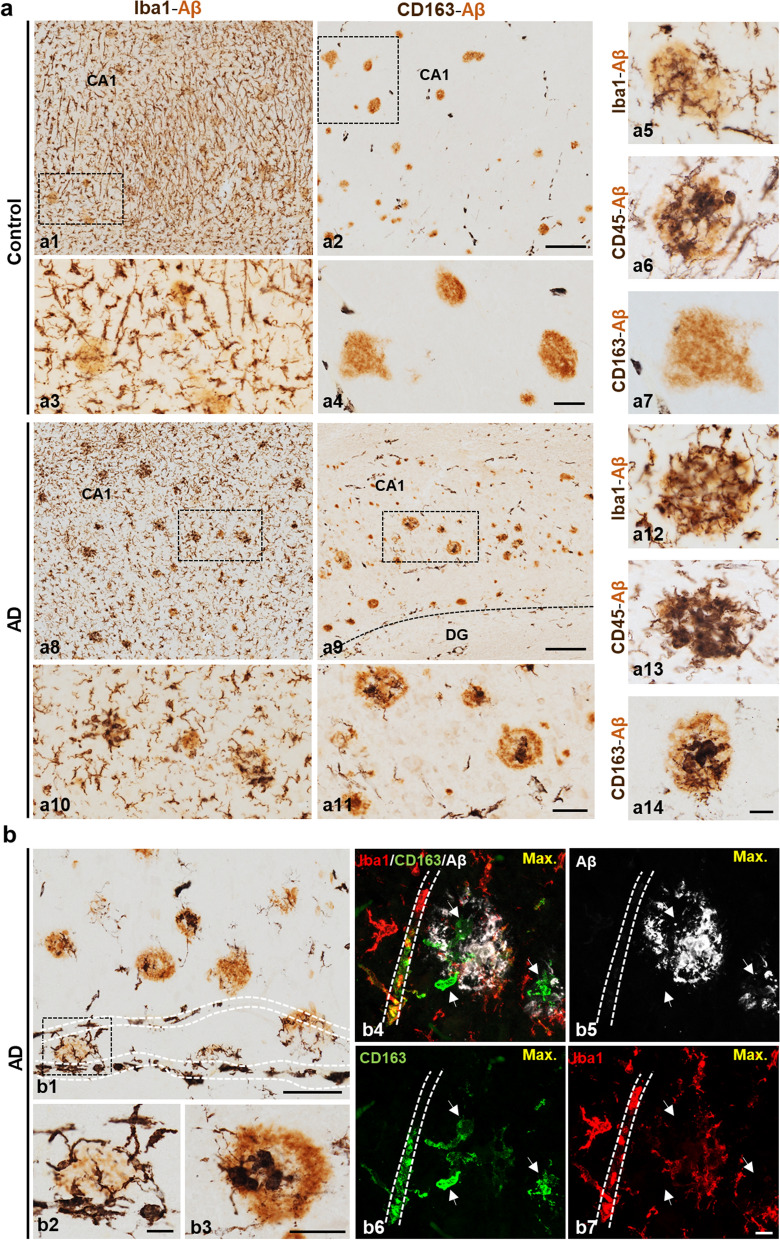
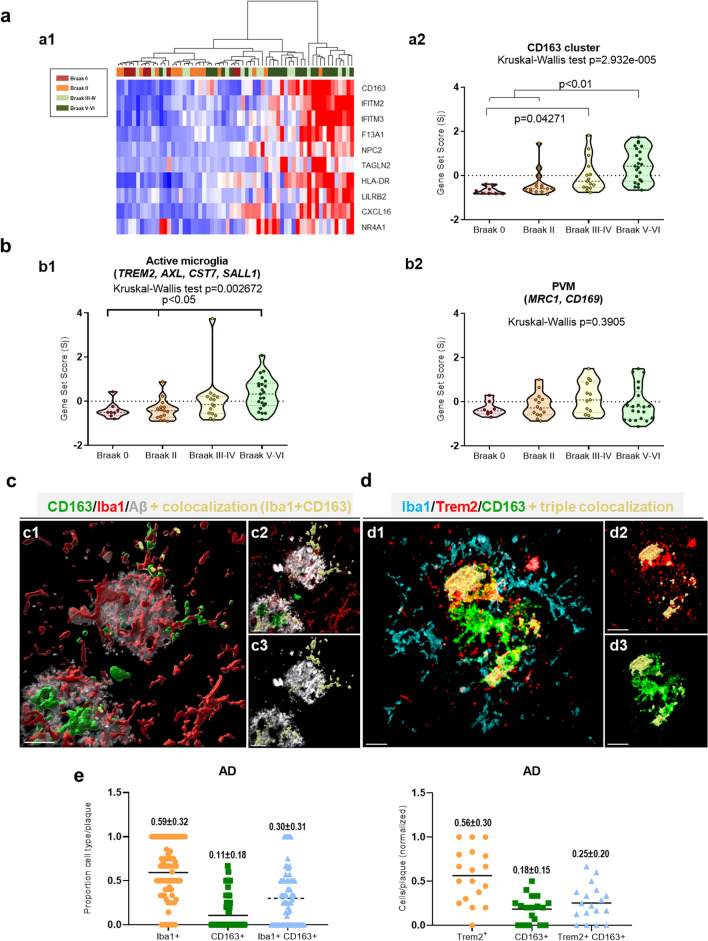
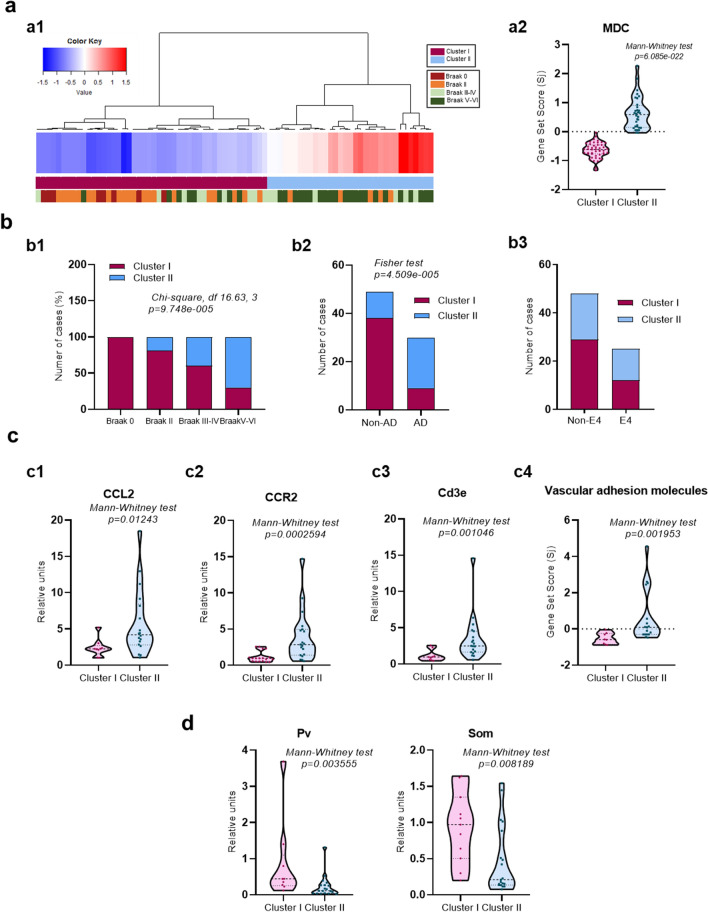
Microglia are brain-resident myeloid cells and play a major role in the innate immune responses of the CNS and the pathogenesis of Alzheimer's disease (AD). However, the contribution of nonparenchymal or brain-infiltrated myeloid cells to disease progression remains to be demonstrated. Here, we show that monocyte-derived cells (MDC) invade brain parenchyma in advanced stages of AD continuum using transcriptional analysis and immunohistochemical characterization in post-mortem human hippocampus. Our findings demonstrated that a high proportion (60%) of demented Braak V-VI individuals was associated with up-regulation of genes rarely expressed by microglial cells and abundant in monocytes, among which stands the membrane-bound scavenger receptor for haptoglobin/hemoglobin complexes or Cd163. These Cd163-positive MDC invaded the hippocampal parenchyma, acquired a microglial-like morphology, and were located in close proximity to blood vessels. Moreover, and most interesting, these invading monocytes infiltrated the nearby amyloid plaques contributing to plaque-associated myeloid cell heterogeneity. However, in aged-matched control individuals with hippocampal amyloid pathology, no signs of MDC brain infiltration or plaque invasion were found. The previously reported microglial degeneration/dysfunction in AD hippocampus could be a key pathological factor inducing MDC recruitment. Our data suggest a clear association between MDC infiltration and endothelial activation which in turn may contribute to damage of the blood brain barrier integrity. The recruitment of monocytes could be a consequence rather than the cause of the severity of the disease. Whether monocyte infiltration is beneficial or detrimental to AD pathology remains to be fully elucidated. These findings open the opportunity to design targeted therapies, not only for microglia but also for the peripheral immune cell population to modulate amyloid pathology and provide a better understanding of the immunological mechanisms underlying the progression of AD.

Keywords: Alzheimer’s disease; Amyloid plaques; Brain infiltration; Human hippocampus; Microglia; Myeloid cells.


Conflict of interest statement

The authors declare that there is no conflict of interest.

Figures

Fig. 1
Fig. 1
Expression analysis of microglial/myeloid genes in human post-mortem hippocampal samples from Braak 0 to Braak V–VI (AD cases). The expression of the different microglial/myeloid genes was tested in human hippocampal samples classified by Braak stages, from Braak 0 (no pathology) to Braak VI (see Additional file 1: Fig. S1 for individual data). Braak stage dependent changes in expression were first analyzed using Spearman correlation analysis (a) and by Braak II vs Braak V–VI direct comparison using Mann Whitney test (b). c to e represented the Braak stage-dependent variation of the gene set score of the three different clusters identified using data shown in b (Additional file 1: Fig. S1): homeostatic microglia (c), active microglia (d) and Cd163 cluster (e). (f) Expression of “classic” microglial markers (IBA1, CD11B and TREM2). The data were shown as violin plots including the individual cases. Significance, indicated in the figure, was tested using the Kruskal–Wallis test followed by the Dunn test
Fig. 2
Fig. 2
Presence of Cd163-positive cells in the hippocampal parenchyma of AD hippocampus. (a) Immunostaining for CD163 in Braak II (age-matched controls, a1–5) and Braak V–VI (AD patients, a6–10) hippocampus. Cd163-positive cells from Braak II individuals (a1) were limited to blood vessels in both DG (a2, boxed area a3) and CA1 (a4, boxed area a5) areas. AD samples (a6) showed Cd163 cells not only associated with blood vessels (purple arrows in a8 and a10), but also distributed throughout the hippocampal parenchyma (black arrows in a8 and a10). (b) Immunolabeling for Iba1 in the hippocampus of control (b1–5) and AD (b6–10) individuals. Iba1-microglial cells from Braak II cases (b1) exhibited a homogenous distribution (b2 and b4, boxed areas b3 and b5) compared to AD hippocampus (b6) which included degeneration (b7, boxed area b8) and clustering (b9, boxed area b10). (c) Quantitative analysis of the parenchymal area (percentage) covered by Cd163 (c1) and Iba1 (c2) positive cells in control (n = 8) and AD (n = 12) samples. The results are shown as violin plots including the individual cases (dots). Mann–Whitney U test comparison between control and AD groups. BV: blood vessels; CA1: cornu ammonis; DG: dentate gyrus; g: granular layer; h: hilus; m: molecular layer; so: stratum oriens; sp: stratum pyramidale; sr: stratum radiatum; slm: stratum lacunosum-moleculare.* Asterisk indicates Abeta plaque. Scale bars: a1, a6, b1 and b6, 1 mm; a2, a4, a7, a9, b2, b4, b7 and b9, 500 μm; a3, 50 μm; a5, a8, a10, b3, b5, b8 and b10, 20 μm
Fig. 3
Fig. 3
Only Abeta plaques from AD hippocampus are infiltrated with Cd163-positive cells. (a) Representative images of Braak II CERAD B (a1–14; control) and Braak V–VI CERAD C (a8–14; AD) cases immunostained for Abeta deposits (OC antibody, light brown) and different myeloid markers (Iba1, Cd163 and Cd45, dark brown). Plaques from the same region of Braak II samples, reactive for microglial markers Iba1 (a1, boxed area a3; higher magnification in a5) and Cd45 (a6), were negative for Cd163 cells (a2, boxed area a4; higher magnification in a7). On the contrary, Abeta deposits from AD hippocampus were infiltrated with Cd163-positive cells (a9, boxed area a11; higher magnification in a14) in addition to Iba1 (a8, boxed area a10) and Cd45 (a13) association. (b) Representative images of Braak V–VI samples showing Cd163-infiltrating Abeta plaques (b2–5) in close association with blood vessels (dashed line in b1 and b4-b7). The sections were double immunostained using OC (light brown color) and Cd163 (dark brown color) antibodies (b1–3) for bright field microscopy, or triple immunostained for Abeta (OC, white, b4), Cd163 (green, b5), Iba1 (red, b6) and the combination (b7) for confocal microscopy. CA1: cornu ammonis; DG: dentate gyrus. Scale bars: a1, a2, a8 and a9, 200 μm; b1, 100 μm; a3, a4, a10, a11, b2 and b4, 50 μm; a5, a6, a7, a12, a13, a14, b3 and b5, 20 μm
Fig. 4
Fig. 4
A specific subset of Cd163-cells does not express classical microglial markers. (a) Heatmap (a1) and gen-set-score (a2) of the expression of ten selected myeloid derived cell (MDC) specific genes (Cd163-cluster), quantified by Array Microfluidic Cards, in human hippocampus. (a1) Color key code represents Z-score distribution, from −1.5 (blue) to 1.5 (red). Subjects were ordered in an unsupervised manner using hierarchical clustering (Ward´s linkage method, Manhattan distance). At the top of the heatmap, a color bar represents each subject Braak stage (Braak 0, n = 8, Braak II, n = 15; Braak III-IV, n = 15, and Braak V–VI, n = 23). (a2) Braak dependent variations of the gene set score of Cd163-cluster. Note the clear up-regulation of these specific MDC genes mainly in Braak V–VI subjects. (b) Graphs represented active microglia (b1) and perivascular macrophages (b2). The expression of all different genes was assayed in parallel using fluidic cards. Data were shown as violin plots including individual samples. Significance, indicated in the figure, was tested using the Kruskal–Wallis test followed by the Dunn test. (c) Imaris-generated 3D surfaces images (c1) reveal different plaque-associated myeloid cells in the triple Cd163/Iba1/Abeta immunofluorescence (c2), showing the co-localization (yellow color, c3) between Iba1 and Cd163 in the nearness of two Ab plaques (white color). (d) Confocal microscopy of triple Iba1/Trem2/Cd163 immunofluorescence (d1), showing the corresponding Imaris-generated 3D reconstruction of the co-localization channel (yellow color) between the three markers analyzed (d2, d3). (e) Graphs showed the quantitative analysis of the different microglial/myeloid cells per Abeta plaque observed in c and d. Each point represented the proportion of the different cell population vs the total number of cells per plaque in AD cases (n = 3–7 BraakV–VI samples and 18–73 plaques for Iba1/Cd163/ or Trem2/Cd163 experiments, respectively). Scale bars: c1, c2 and c3, 30 μm; d1, d2 and d3, 10 μm
Fig. 5
Fig. 5
Parenchymal Cd163-positive cells are concentrated in the vicinity of blood vessels in AD hippocampus. (a) Double immunolabeling for Cd163 (dark brown) and, laminin or Abeta (light brown) (a1–4 and a5–6, respectively) in AD (Braak V–VI) hippocampus. Cd163-positive cells accumulated under the pia/hippocampal fissure where laminin-positive vessels were located (a1, panoramic view; boxed area, a2-a3). Higher magnification images in a3-a4 show Cd163-cells with a ramified morphology (black arrows). Double Cd163/Abeta immunostaining of the same AD hippocampus (a5, panoramic view; boxed area a6) exhibited an apparent flow direction (dashed black arrows) of Cd163-cells from blood vessels towards parenchymal Abeta plaques (red arrows). Quantitative analysis of the enriched (vessel +) and not-enriched (vessel-) laminin-positive area covered by Cd163 (percentage) is represented in a7. The results are shown individually (dots) from n = 9 Braak V–VI. Mann–Whitney U test comparison between groups. (b) Drawing illustrating the experimental settings (b1) to test whether microglial/myeloid cells were preferentially associated with blood vessels. As shown, the different vessels (n = 63) from AD samples (n = 9), were outlined, and three concentric circles of the same area (a fixed radius = 85 μm) were delineated surrounding each vessel. The corresponding Cd163, Iba1 and Abeta loadings were then calculated in each corresponding halo. Quantitative data indicating the loading (percentage of area) corresponding to the Cd163 (b2), Iba1 (b3) or Abeta (b4) were shown as individual matched data. The significance, shown in the figure, was tested using the Friedman test followed by the Dunn test. CA1: cornu ammonis; DG: dentate gyrus; Sub: subiculum; BV: blood vessel. Scale bars: a1 and a5, 1 mm; a3 and a6, 100 μm; a2, 50 μm; a4, 20 μm
Fig. 6
Fig. 6
CD163-cells infiltration was associated with AD pathology and vascular endothelial activation. (a) Hierarchical clustering (Ward´s linkage method, Manhattan distance) analysis (a1) and gene set score (violin plots, a2) of Cd163 cluster, evaluated in the entire human cohort (n = 77 samples, comprising Braak stages 0 to VI stages). As shown, a minimal structure of two main clusters (cluster-I and cluster-II) was observed. The expression of Cd163-genes was significantly higher in cluster-II. (b) Using this minimal classification, we evaluated whether cluster-II was enriched in advanced Braak stages (b1), dementia (b2) or the ApoE4 genotype (b3). As shown, cluster II was enriched in BraakV–VI samples (Chi-square p < 0.0001) and, consequently, significantly associated (Fisher test p = 4.509e−005) with demented cases. No differences were observed with the ApoE4 genotype. (c) Since Cd163 infiltration (cluster II) was predominantly associated with Braak V–VI cases we next evaluated in this particular population the possible association with CCL2 (c1), CCR2 (c2) and CD3E (c3). As expected, we observed significant increased (Mann Whitney test; p < 0.05) in cluster II for all three genes tested. Furthermore, a similar analysis was performed testing the expression of vascular adhesion genes (c4). As shown, there was also a significant (Mann Whitney test, p < 0.05) increased levels in cluster II. (d) We also observed a significantly reduced expression of the GABAergic markers parvalbumin (PV) and somatostatin (SOM) in cluster II Braak V–VI individuals

References

    1. Baruch K, Deczkowska A, Rosenzweig N, Tsitsou-Kampeli A, Sharif AM, Matcovitch-Natan O, Kertser A, David E, Amit I, Schwartz M. PD-1 immune checkpoint blockade reduces pathology and improves memory in mouse models of Alzheimer’s disease. Nat Med. 2016;22:135–137. doi: 10.1038/NM.4022. - DOI - PubMed
    1. Bennett ML, Bennett FC. The influence of environment and origin on brain resident macrophages and implications for therapy. Nat Neurosci. 2020;23:157–166. doi: 10.1038/S41593-019-0545-6. - DOI - PubMed
    1. Bogie JFJ, Stinissen P, Hendriks JJA. Macrophage subsets and microglia in multiple sclerosis. Acta Neuropathol. 2014;128:191–213. doi: 10.1007/S00401-014-1310-2. - DOI - PubMed
    1. Bonilla DL, Bhattacharya A, Sha Y, Xu Y, Xiang Q, Kan A, Jagannath C, Komatsu M, Eissa NT. Autophagy regulates phagocytosis by modulating the expression of scavenger receptors. Immunity. 2013;39:537–547. doi: 10.1016/J.IMMUNI.2013.08.026. - DOI - PMC - PubMed
    1. Böttcher C, Schlickeiser S, Sneeboer MAM, Kunkel D, Knop A, Paza E, Fidzinski P, Kraus L, Snijders GJL, Kahn RS, Schulz AR, Mei HE, Hol EM, Siegmund B, Glauben R, Spruth EJ, de Witte LD, Priller J. Human microglia regional heterogeneity and phenotypes determined by multiplexed single-cell mass cytometry. Nat Neurosci. 2019;22:78–90. doi: 10.1038/S41593-018-0290-2. - DOI - PubMed

Substances