. 2023 Feb 28;21(1):70.
doi: 10.1186/s12951-023-01828-z.

Comparative study of extracellular vesicles derived from mesenchymal stem cells and brain endothelial cells attenuating blood-brain barrier permeability via regulating Caveolin-1-dependent ZO-1 and Claudin-5 endocytosis in acute ischemic stroke

Affiliations

Comparative study of extracellular vesicles derived from mesenchymal stem cells and brain endothelial cells attenuating blood-brain barrier permeability via regulating Caveolin-1-dependent ZO-1 and Claudin-5 endocytosis in acute ischemic stroke

Yiyang Li et al. J Nanobiotechnology. .

Abstract

Background: Blood-brain barrier (BBB) disruption is a major adverse event after ischemic stroke (IS). Caveolin-1 (Cav-1), a scaffolding protein, played multiple roles in BBB permeability after IS, while the pros and cons of Cav-1 on BBB permeability remain controversial. Numerous studies revealed that extracellular vesicles (EVs), especially stem cells derived EVs, exerted therapeutic efficacy on IS; however, the mechanisms of BBB permeability needed to be clearly illustrated. Herein, we compared the protective efficacy on BBB integrity between bone marrow mesenchymal stem cells derived extracellular vesicles (BMSC-EVs) and EVs from brain endothelial cells (BEC-EVs) after acute IS and investigated whether the mechanism was associated with EVs antagonizing Cav-1-dependent tight junction proteins endocytosis.

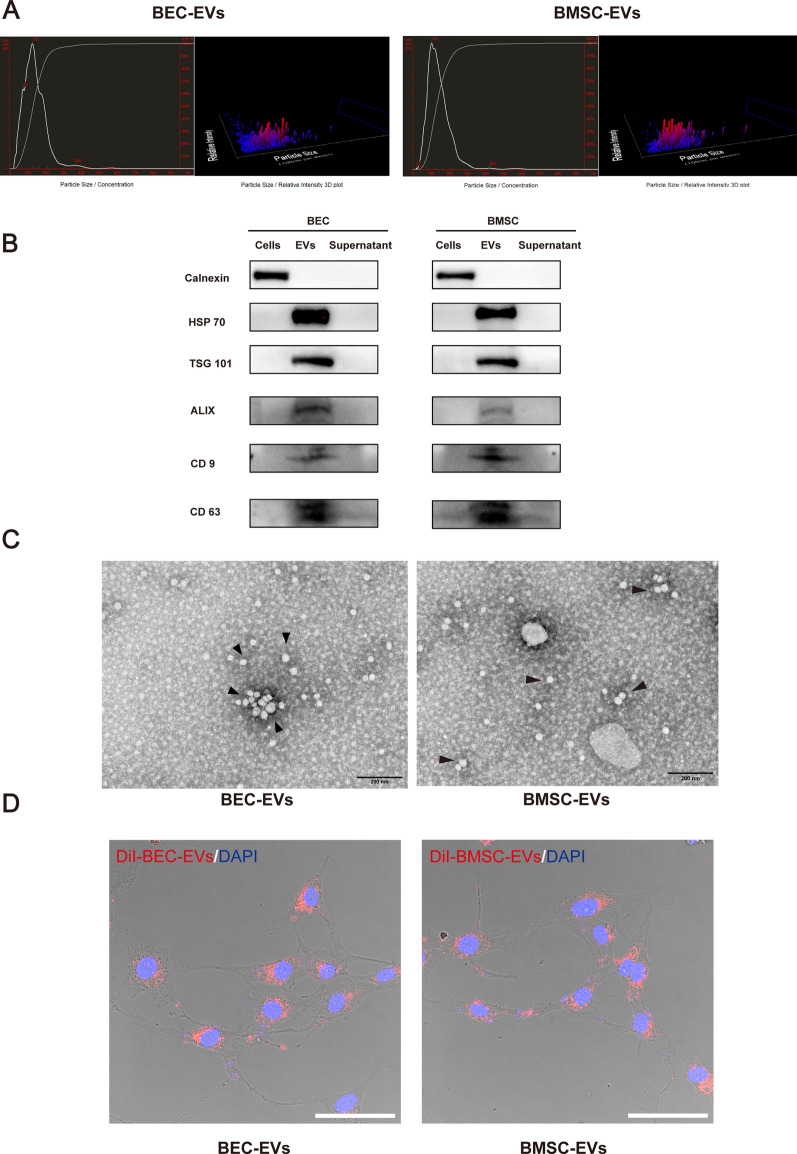
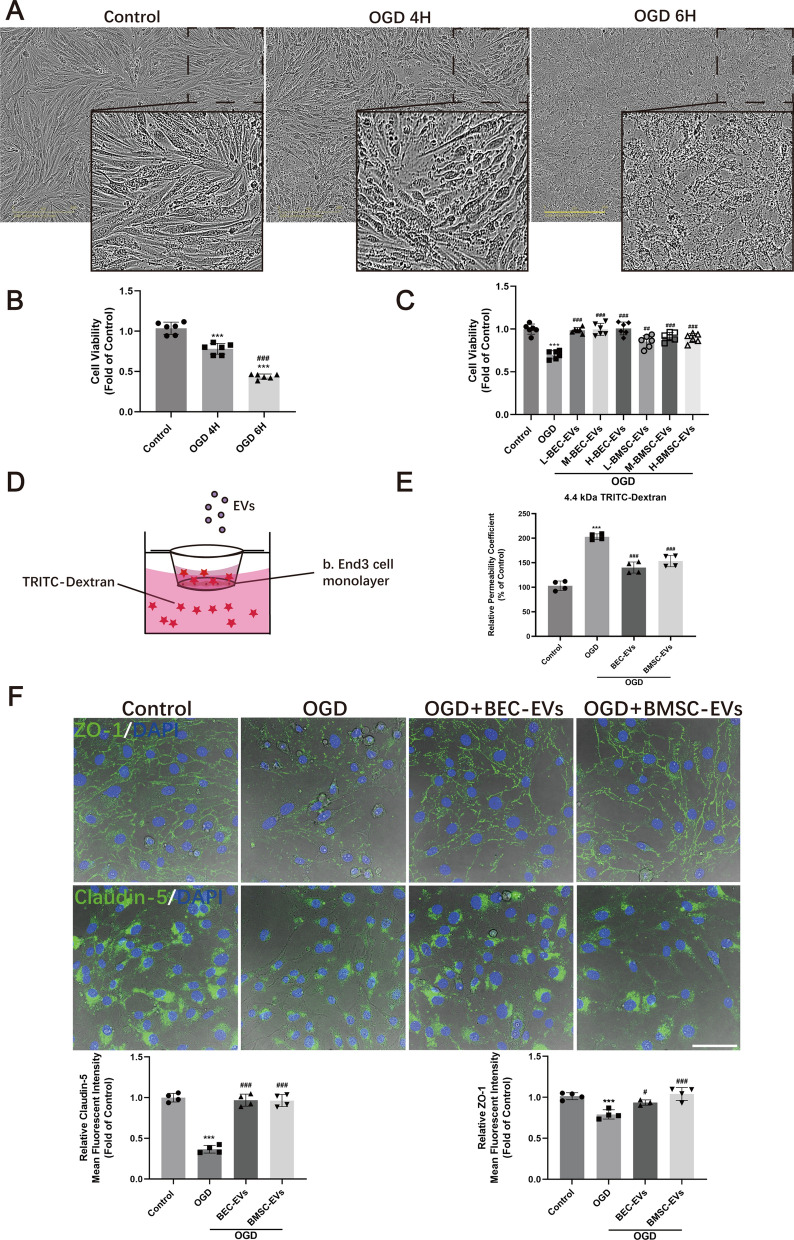
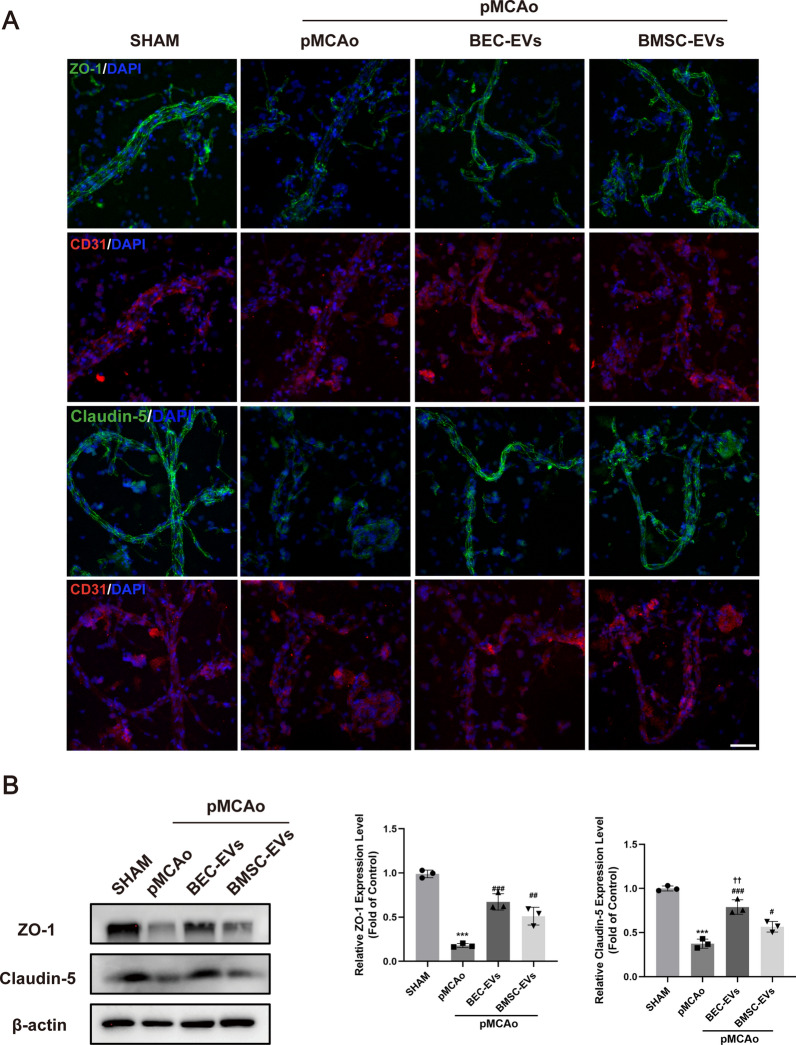
Methods: BMSC-EVs and BEC-EVs were isolated and characterized by nanoparticle tracking analysis, western blotting, and transmission electron microscope. Oxygen and glucose deprivation (OGD) treated b. End3 cells were utilized to evaluate brain endothelial cell leakage. CCK-8 and TRITC-dextran leakage assays were used to measure cell viability and transwell monolayer permeability. Permanent middle cerebral artery occlusion (pMCAo) model was established, and EVs were intravenously administered in rats. Animal neurological function tests were applied, and microvessels were isolated from the ischemic cortex. BBB leakage and tight junction proteins were analyzed by Evans Blue (EB) staining and western blotting, respectively. Co-IP assay and Cav-1 siRNA/pcDNA 3.1 vector transfection were employed to verify the endocytosis efficacy of Cav-1 on tight junction proteins.

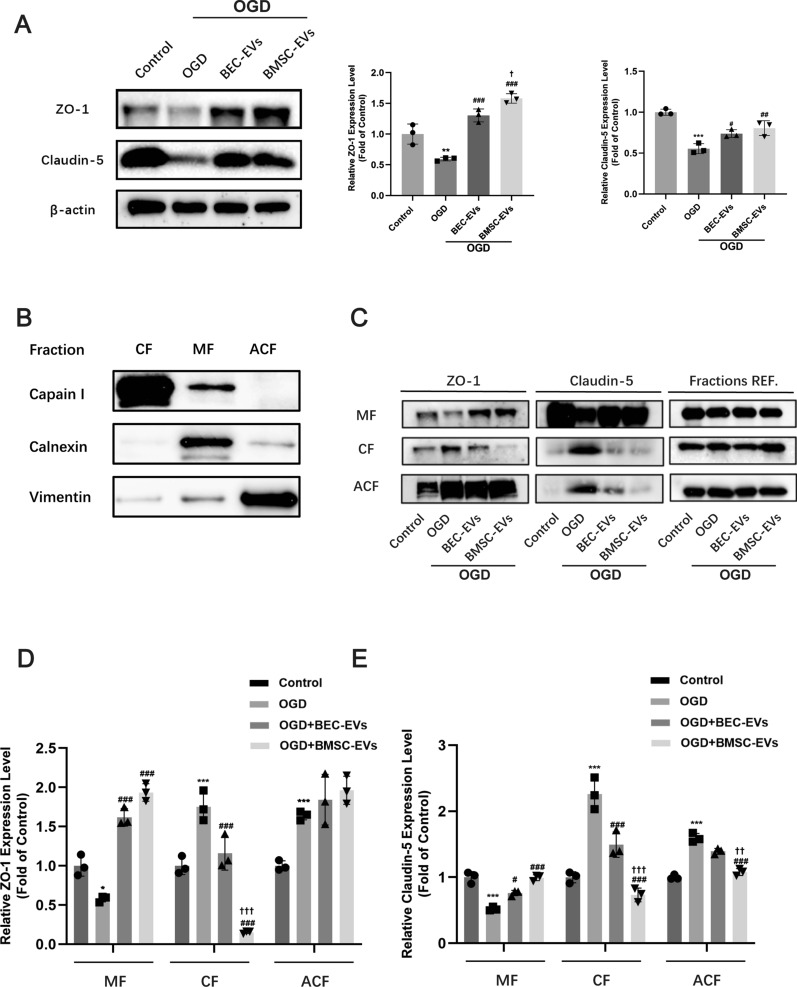
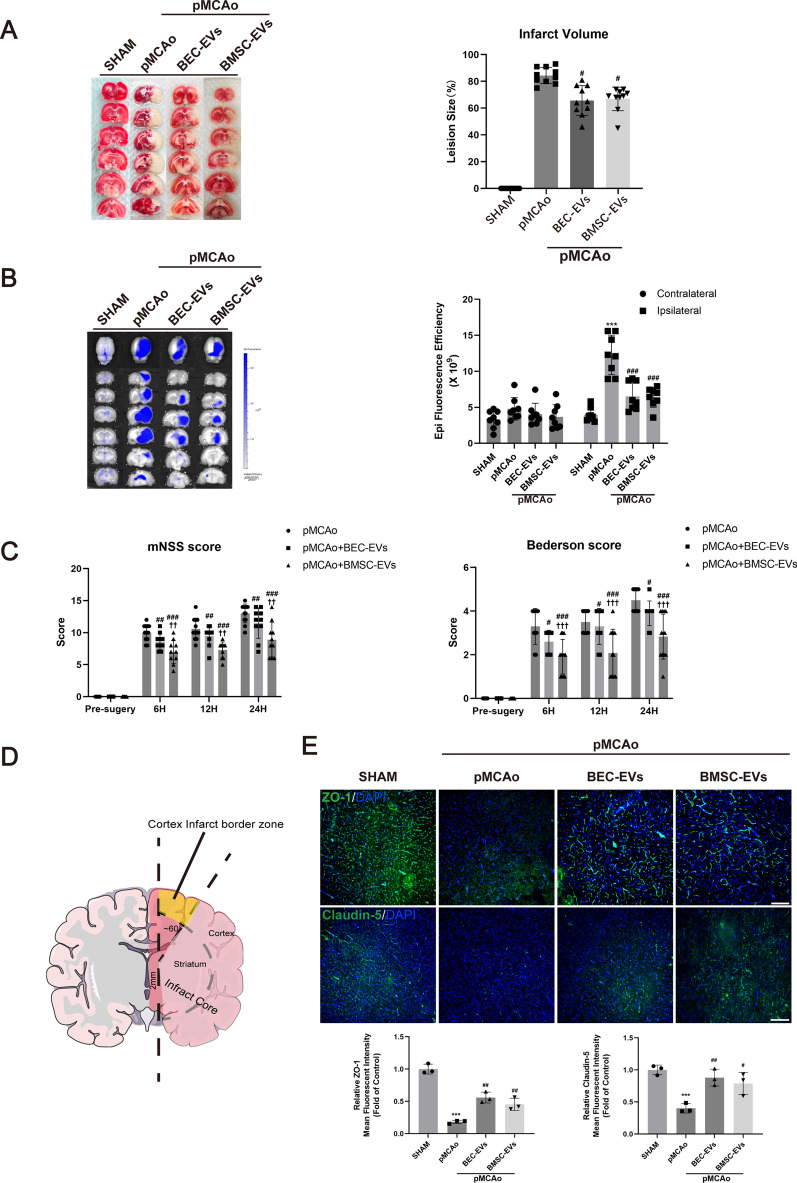
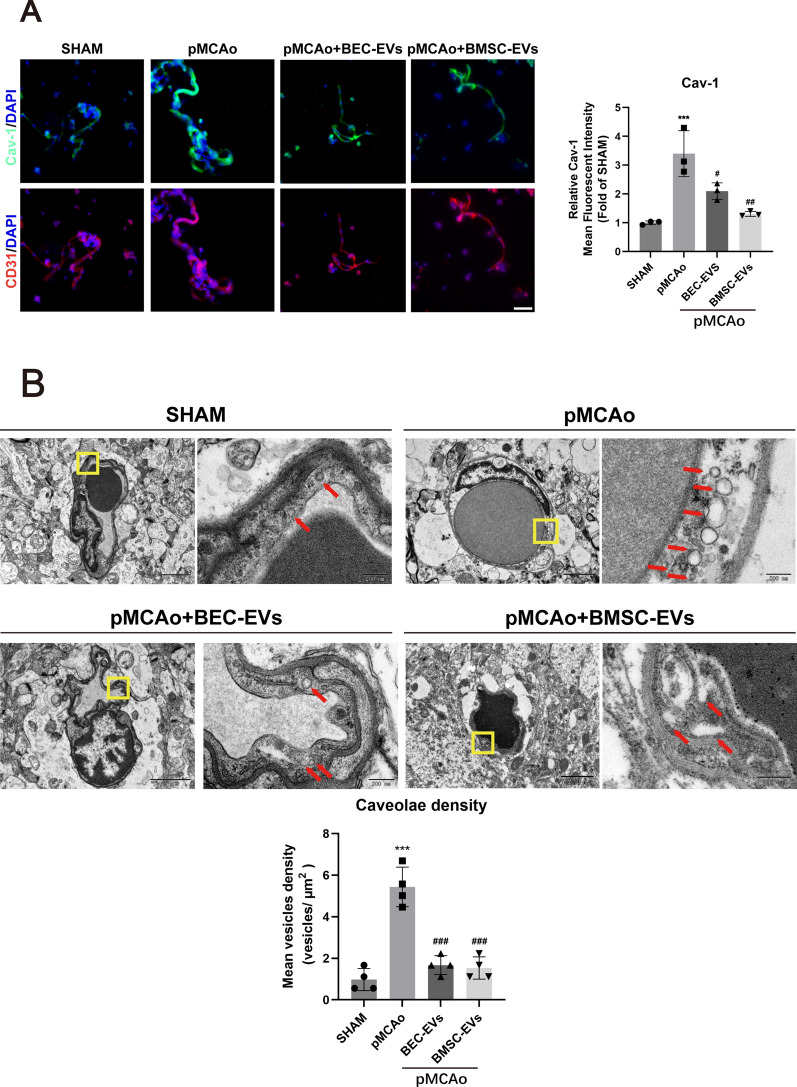
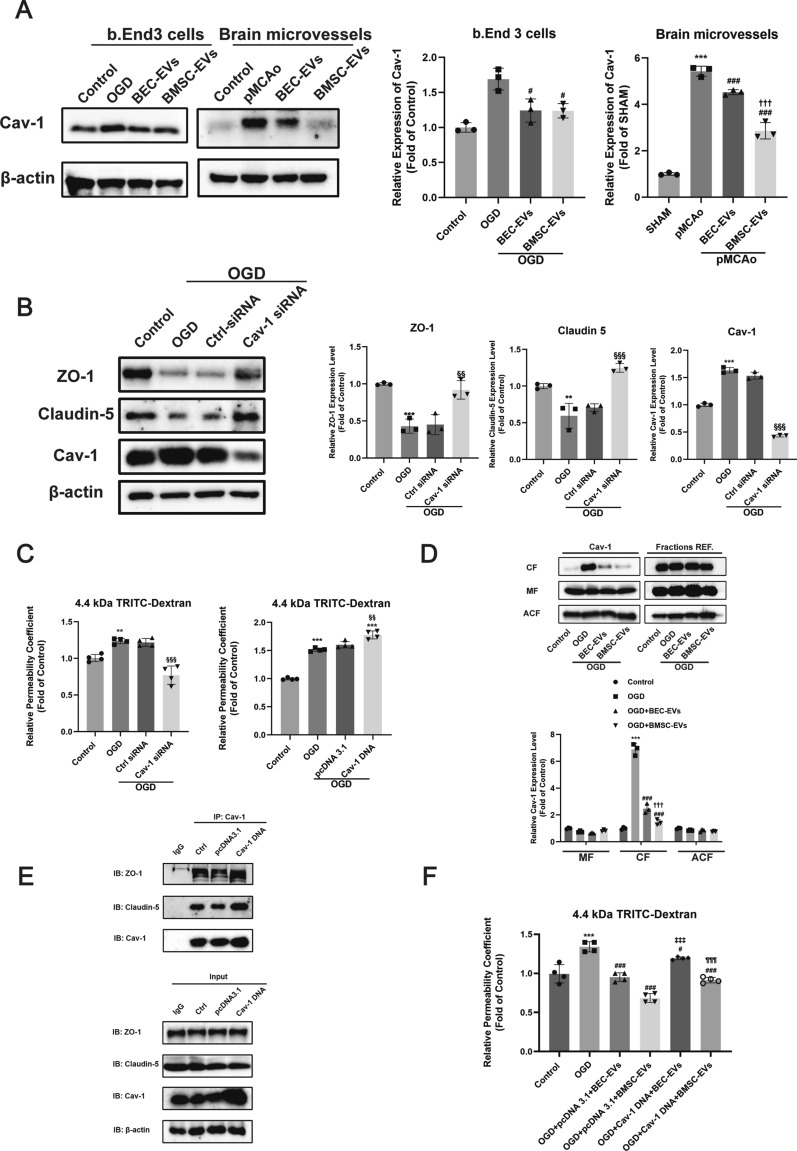
Results: Both kinds of EVs exerted similar efficacies in reducing the cerebral infarction volume and BBB leakage and enhancing the expressions of ZO-1 and Claudin-5 after 24 h pMCAo in rats. At the same time, BMSC-EVs were outstanding in ameliorating neurological function. Simultaneously, both EVs treatments suppressed the highly expressed Cav-1 in OGD-exposed b. End3 cells and ischemic cerebral microvessels, and this efficacy was more prominent after BMSC-EVs administration. Cav-1 knockdown reduced OGD-treated b. End3 cells monolayer permeability and recovered ZO-1 and Claudin-5 expressions, whereas Cav-1 overexpression aggravated permeability and enhanced the colocalization of Cav-1 with ZO-1 and Claudin-5. Furthermore, Cav-1 overexpression partly reversed the lower cell leakage by BMSC-EVs and BEC-EVs administrations in OGD-treated b. End3 cells.

Conclusions: Our results demonstrated that Cav-1 aggravated BBB permeability in acute ischemic stroke, and BMSC-EVs exerted similar antagonistic efficacy to BEC-EVs on Cav-1-dependent ZO-1 and Claudin-5 endocytosis. BMSC-EVs treatment was superior in Cav-1 suppression and neurological function amelioration.

Keywords: Blood–brain barrier; Caveolin-1; Endocytosis; Extracellular vesicles; Ischemic stroke; Tight junction proteins.


Conflict of interest statement

The authors declare that they have no competing interests.

Figures

Fig. 1
Fig. 1
Characterization of BEC-EVs and BMSC-EVs. A NTA of BEC-EVs and BMSC-EVs showed the size of EVs. B Representative western blotting of EVs marker HSP 70, TSG 101, ALIX, CD9, and CD63. Cells and supernatant without EVs were regarded as negative control, respectively, and calnexin was defined as endoplasmic reticulum marker which presented exclusively in cells. C Representative TEM images of BEC-EVs and BMSC-EVs (Black arrowheads). Scale Bar: 200 nm. Magnification: 40 k × . All images were taken in the same scale. D Representative confocal microscope images of b. End3 cells phagocytizing DiI labeled BEC-EVs and BMSC-EVs. Scale Bar: 50 μm. Magnification: 63 × . All images were taken in the same scale
Fig. 2
Fig. 2
BEC-EVs and BMSC-EVs treatments reduced the leakage and enhanced the expressions of ZO-1 and Claudin-5 in OGD insulted b. End3 cells. A Representative images of b. End3 cell morphology after 4 and 6 h OGD insult. Scale Bar: 200 μm. Magnification: 20 × . All images were taken in the same scale. B The viability analysis of OGD insulted b. End3 cells after BEC-EVs and BMSC-EVs treatments (n = 6). C Viability analysis of b. End3 subjected to OGD after different dosages of BEC-EVs and BMSC-EVs administrations (n = 6). D Schematic of transwell insert for the evaluation of TRITC-Dextran leakage after the treatments of EVs from two sources. E Relative permeability coefficient of OGD insulted b. End3 cells after BEC-EVs and BMSC-EVs treatments (n = 4). F Representative immunofluorescent staining images of ZO-1 and Claudin-5 in OGD insulted b. End3 cells after BEC-EVs and BMSC-EVs treatments, and quantification of mean fluorescent intensity. Scale Bar: 50 μm. Magnification: 63 × . All images were taken in the same scale. ***P < 0.001 vs. Control group; ###P < 0.001, ##P < 0.01, #P < 0.05 vs. OGD or OGD 4 h group
Fig. 3
Fig. 3
BEC-EVs and BMSC-EVs treatments recovered ZO-1 and Claudin-5 expressions and inhibited their intracellular translocation in OGD insulted b. End3 cells. A Representative western blotting of ZO-1 and Claudin-5 after the treatments of EVs from two sources and quantification of ZO-1 and Claudin-5 expressions (n = 3). B The purity determination in subcellular fractions by western blotting. C Representative western blotting of ZO-1 and Claudin-5 in subcellular fractions. MF Membrane fraction; CF Cytoplasm fraction; ACF Actin cytoskeleton fraction; Fractions REF. (Calpain I for AF, Calnexin for MF and Vimentin for ACF, respectively). D, E Quantification of ZO-1 and Claudin-5 expressions in subcellular fractions (n = 3). ***P < 0.001, **P < 0.01, *P < 0.05 vs. Control group; ###P < 0.001, ##P < 0.01, #P < 0.05 vs. OGD group; †††P < 0.001, ††P < 0.01, P < 0.05 vs. OGD + BEC-EVs group
Fig. 4
Fig. 4
BEC-EVs and BMSC-EVs treatments enhanced ZO-1 and Claudin-5 expressions in BMV from ischemic cortex. A Representative immunofluorescent staining of Claudin-5, ZO-1 and CD31 in BMV. Scale Bar: 50 μm. Magnification: 40 × . All images were taken in the same scale. B Representative western blotting of Claudin-5 and ZO-1 in BMV and quantification of ZO-1 and Claudin-5 expressions (n = 3). ***P < 0.001 vs. SHAM group; ###P < 0.001, ##P < 0.01, #P < 0.05 vs. pMCAo group; ††P < 0.01 vs. pMCAo + BMSC-EVs group
Fig. 5
Fig. 5
BEC-EVs and BMSC-EVs treatments improved neurological injury, BBB leakage and ZO-1 and Claudin-5 expressions after acute IS. A Representative TTC staining images of total brain slices from pMCAo rats and relative infarction volume quantification (n = 8). B Representative images of EB leakage determined by IVIS and quantification of fluorescent efficacy (n = 8). C The evaluation of neurological function by mNSS and Bederson tests (n = 10). D Schematic of cortex infarct border area observed in immunofluorescent staining. E Representative immunofluorescent staining and expression quantification of ZO-1 and Claudin-5 in cortex infarct border area (n = 3). Scale Bar: 200 μm. Magnification: 10 × . All images were taken in the same scale. ***P < 0.001 vs. SHAM group; ###P < 0.001, ##P < 0.01, #P < 0.05 vs. pMCAo group; †††P < 0.001, ††P < 0.01, vs. pMCAo + BEC-EVs
Fig. 6
Fig. 6
Distribution and expression of Caveolin-1 and Caveolae in brain microvessels. A Representative immunofluorescence staining images and quantification of Caveolin-1 and CD 31 in BMV (n = 3). Scale Bar: 50 μm. Magnification: 40 × . All images were taken in the same scale. B TEM image of caveolae-like vesicles in brain microvascular endothelial cells and quantification of the density. Scale Bar: 2 μm and 200 nm. Magnification: 2 k × and 20 k × . All images were taken in the same scale. ***P < 0.001 vs. SHAM group; ###P < 0.001, ##P < 0.05, #P < 0.01 vs. pMCAo group
Fig. 7
Fig. 7
BEC-EVs and BMSC-EVs treatments antagonized Cav-1-dependent ZO-1 and Claudin-5 endocytosis to decrease BBB permeability. A Representative western blotting of Cav-1 in OGD insulted b. End3 cells and BMV from ischemic cortex; and quantification of Cav-1 expression (n = 3). B Representative western blotting of ZO-1, Claudin-5 and Cav-1 after Cav-1 siRNA transfection in OGD insulted b. End3 cells and quantification of ZO-1, Claudin-5 and Cav-1 expressions (n = 3). C Relative permeability coefficient of OGD insulted b. End3 cells after siRNA/pcDNA 3.1 transfection (n = 4). D Representative western blotting of Cav-1 in subcellular fractions. MF Membrane fraction; CF Cytoplasm fraction; ACF Actin cytoskeleton fraction; Fractions REF. (Calpain I for AF, Calnexin for MF and Vimentin for ACF, respectively) and quantification of Cav-1 expression in subcellular fractions (n = 3). E Representative co-ip results of Cav-1 with ZO-1 and Claudin-5 after Cav-1 pcDNA 3.1 transfection in b. End3 cells, and IgG was served as negative control. IP: Immunoprecipitation; IB: Immunoblotting. F Relative permeability coefficient of OGD insulted b. End3 cells with pcDNA 3.1 transfection after the treatments of EVs from two sources (n = 4). ***P < 0.001, **P < 0.01 vs. Control/SHAM group; ###P < 0.001, #P < 0.05 vs. pMCAo/OGD group; †††P < 0.0001, vs. pMCAo + BEC-EVs. §§§P < 0.001, §§P < 0.01 vs. Ctrl-siRNA/pcDNA 3.1 group. ‡‡‡P < 0.001 vs. OGD + pcDNA 3.1 + BEC-EVs group; ¶¶¶P < 0.001 vs. OGD + pcDNA 3.1 + BMSC-EVs group

References

    1. Feigin VL, Nguyen G, Cercy K, Johnson CO, Alam T, Parmar PG, et al. Global, regional, and country-specific lifetime risks of stroke, 1990 and 2016. N Engl J Med. 2018;379(25):2429–2437. doi: 10.1056/NEJMoa1804492. - DOI - PMC - PubMed
    1. Tsao CW, Aday AW, Almarzooq ZI, Alonso A, Beaton AZ, Bittencourt MS, et al. Heart disease and stroke statistics-2022 update: a report from the american heart association. Circulation. 2022;145(8):e153–e639. doi: 10.1161/CIR.0000000000001052. - DOI - PubMed
    1. Emberson J, Lees KR, Lyden P, Blackwell L, Albers G, Bluhmki E, et al. Effect of treatment delay, age, and stroke severity on the effects of intravenous thrombolysis with alteplase for acute ischaemic stroke: a meta-analysis of individual patient data from randomised trials. Lancet. 2014;384(9958):1929–1935. doi: 10.1016/s0140-6736(14)60584-5. - DOI - PMC - PubMed
    1. Joo H, Wang G, George MG. Use of intravenous tissue plasminogen activator and hospital costs for patients with acute ischaemic stroke aged 18–64 years in the USA. Stroke Vasc Neurol. 2016;1(1):8–15. doi: 10.1136/svn-2015-000002. - DOI - PMC - PubMed
    1. Khandelwal P, Yavagal DR, Sacco RL. Acute ischemic stroke intervention. J Am Coll Cardiol. 2016;67(22):2631–2644. doi: 10.1016/j.jacc.2016.03.555. - DOI - PubMed