. 2023 Feb 28;15(1):12.
doi: 10.1186/s13073-023-01161-y.

Refining epigenetic prediction of chronological and biological age

Affiliations

Refining epigenetic prediction of chronological and biological age

Elena Bernabeu et al. Genome Med. .

Abstract

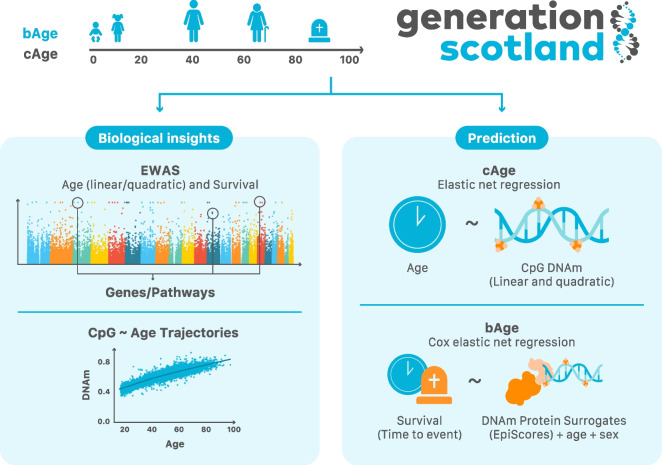
Background: Epigenetic clocks can track both chronological age (cAge) and biological age (bAge). The latter is typically defined by physiological biomarkers and risk of adverse health outcomes, including all-cause mortality. As cohort sample sizes increase, estimates of cAge and bAge become more precise. Here, we aim to develop accurate epigenetic predictors of cAge and bAge, whilst improving our understanding of their epigenomic architecture.

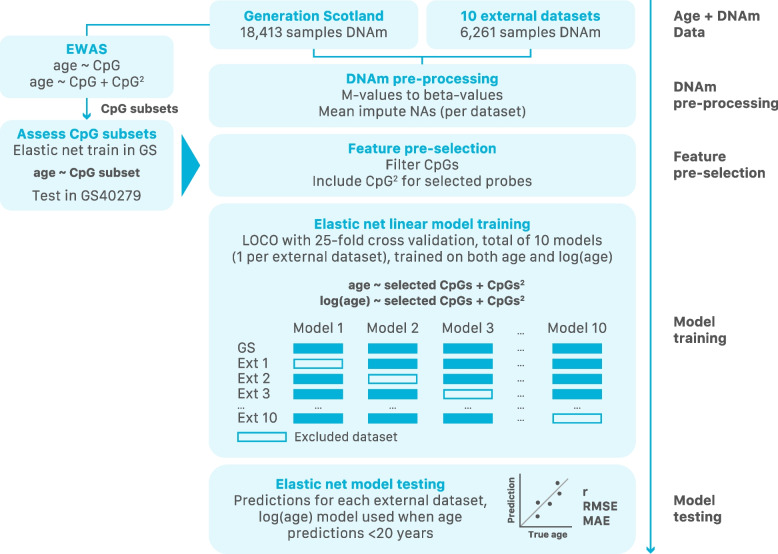
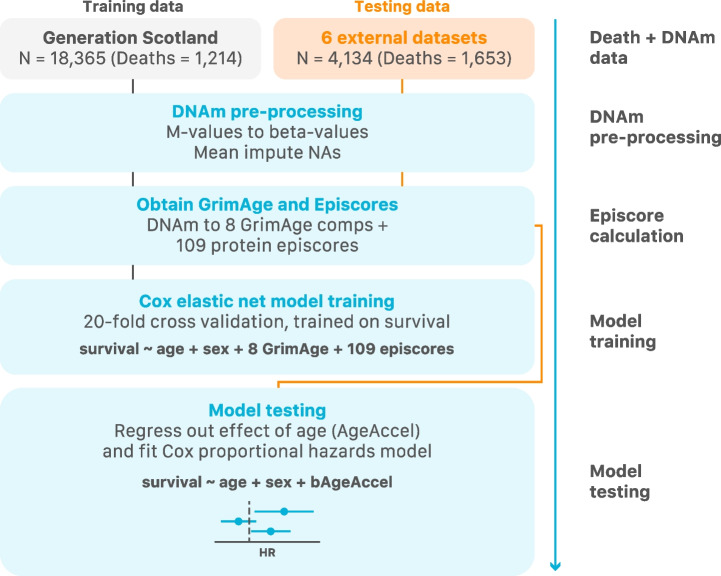
Methods: First, we perform large-scale (N = 18,413) epigenome-wide association studies (EWAS) of chronological age and all-cause mortality. Next, to create a cAge predictor, we use methylation data from 24,674 participants from the Generation Scotland study, the Lothian Birth Cohorts (LBC) of 1921 and 1936, and 8 other cohorts with publicly available data. In addition, we train a predictor of time to all-cause mortality as a proxy for bAge using the Generation Scotland cohort (1214 observed deaths). For this purpose, we use epigenetic surrogates (EpiScores) for 109 plasma proteins and the 8 component parts of GrimAge, one of the current best epigenetic predictors of survival. We test this bAge predictor in four external cohorts (LBC1921, LBC1936, the Framingham Heart Study and the Women's Health Initiative study).

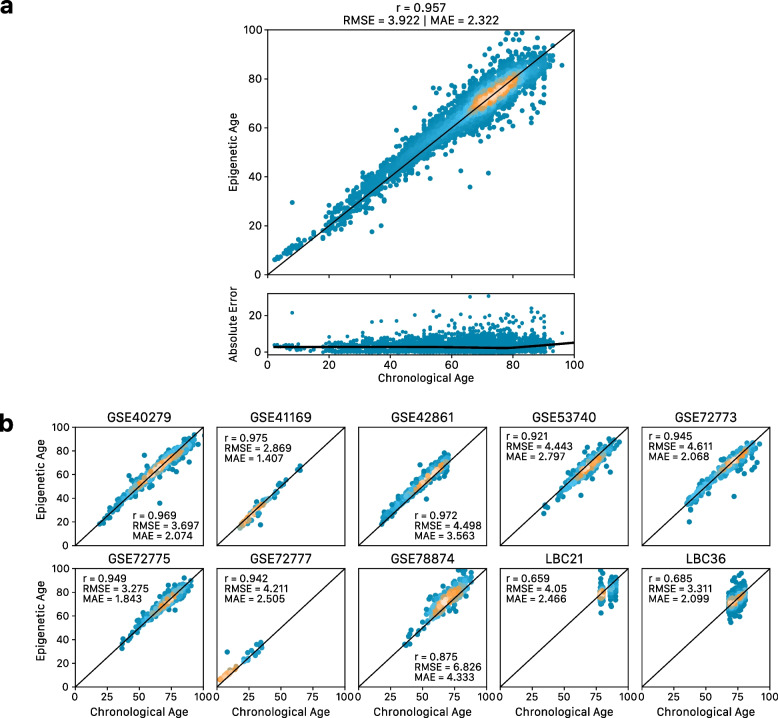
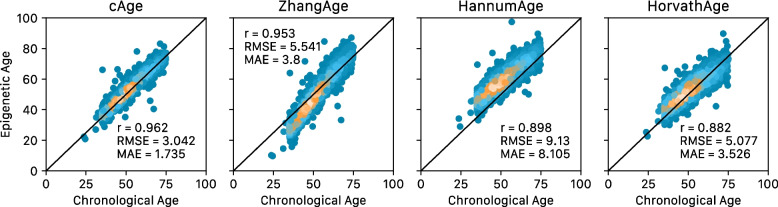
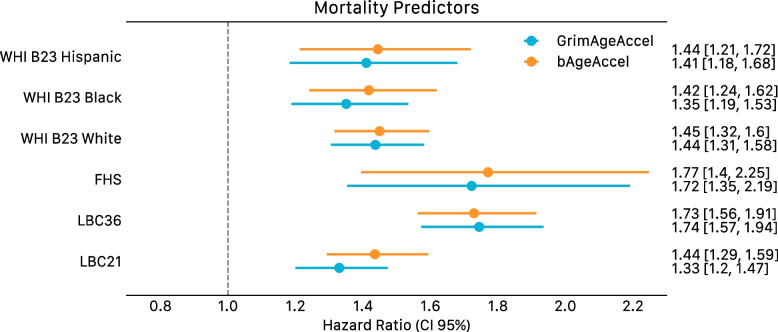
Results: Through the inclusion of linear and non-linear age-CpG associations from the EWAS, feature pre-selection in advance of elastic net regression, and a leave-one-cohort-out (LOCO) cross-validation framework, we obtain cAge prediction with a median absolute error equal to 2.3 years. Our bAge predictor was found to slightly outperform GrimAge in terms of the strength of its association to survival (HRGrimAge = 1.47 [1.40, 1.54] with p = 1.08 × 10-52, and HRbAge = 1.52 [1.44, 1.59] with p = 2.20 × 10-60). Finally, we introduce MethylBrowsR, an online tool to visualise epigenome-wide CpG-age associations.

Conclusions: The integration of multiple large datasets, EpiScores, non-linear DNAm effects, and new approaches to feature selection has facilitated improvements to the blood-based epigenetic prediction of biological and chronological age.


Conflict of interest statement

R.E.M has received a speaker fee from Illumina and is an advisor to the Epigenetic Clock Development Foundation. R.F.H. has received consultant fees from Illumina. R.E.M, R.F.H., and D.A.G. have received consultant fees from Optima partners. A.M.M has previously received speaker fees from Janssen and Illumina and research funding from The Sackler Trust. M.R.R. receives research funding from Boehringer Ingelheim. All other authors declare no competing interests.

Figures

Fig. 1
Fig. 1
Study overview. Using the Generation Scotland cohort as our main data source, we explored the relationship between the epigenome and age/survival via EWAS, which also informed on genes of interest and potentially enriched pathways. We further characterised epigenome-wide CpG ~ age trajectories, which can be visualised in a new Shiny app, MethylBrowsR (https://shiny.igmm.ed.ac.uk/MethylBrowsR/). Finally, we refined epigenetic prediction of both cAge and bAge. Calculation of cAge can be performed either using a standalone script (https://github.com/elenabernabeu/cage_bage/tree/main/cage_predictor) or by uploading DNAm data to our MethylDetectR shiny app (https://shiny.igmm.ed.ac.uk/MethylDetectR/). As the weights for GrimAge and its component parts are not publicly available, bAge can only be calculated by using our standalone script (https://github.com/elenabernabeu/cage_bage/tree/main/bage_predictor), after obtaining GrimAge estimates from an external online calculator (http://dnamage.genetics.ucla.edu/new)
Fig. 2
Fig. 2
Flowchart for the creation of the cAge predictor. First, DNAm data originating from Generation Scotland and 10 external datasets was pre-processed. Next, CpGs were pre-selected based on the Generation Scotland EWAS for epigenome-wide significant linear and quadratic CpG-age associations. Elastic net models were then trained and tested on the remaining features using a LOCO framework with 25-fold CV, with training on both age and log(age) as outcomes
Fig. 3
Fig. 3
Performance of cAge LOCO framework (one cAge model per external cohort), a across all 10 datasets considered, and b per cohort. Performance metrics shown include Pearson correlation (r), root mean squared error (RMSE), and median absolute error (MAE). Metrics also included in Table 1
Fig. 4
Fig. 4
cAge predictor performance in the GSE55763 dataset, compared to ZhangAge, HannumAge, and HorvathAge. Performance metrics shown include Pearson correlation (r), root mean squared error (RMSE), and median absolute error (MAE)
Fig. 5
Fig. 5
Flowchart for the creation of the bAge predictor. First, DNAm data originating from Generation Scotland and six external datasets was pre-processed. GrimAge components and 109 protein EpiScores were generated within each cohort. A Cox PH elastic net regression model of time to all-cause mortality (with 20-fold CV) was trained in Generation Scotland with the GrimAge components and EpiScores as possible features. The model that maximised Harrell’s C index was tested on the six external datasets
Fig. 6
Fig. 6
Forest plots of bAge/GrimAge predictors, applied to time to all-cause mortality in LBC1921, LBC1936, FHS, and WHI. Predictors regressed on age. Hazard ratios are presented per standard deviation of the GrimAgeAccel and bAgeAccel variables, along with 95% confidence intervals. Cox models are adjusted for age at DNAm sampling and sex

References

    1. Yousefi PD, et al. DNA methylation-based predictors of health: applications and statistical considerations. Nat Rev Genet. 2022;23:369–383. doi: 10.1038/s41576-022-00465-w. - DOI - PubMed
    1. Bocklandt S, et al. Epigenetic predictor of age. PLoS One. 2011;6:e14821. doi: 10.1371/journal.pone.0014821. - DOI - PMC - PubMed
    1. Horvath S. DNA methylation age of human tissues and cell types. Genome Biol. 2013;14:1–20. doi: 10.1186/gb-2013-14-10-r115. - DOI - PMC - PubMed
    1. Hannum G, et al. Genome-wide methylation profiles reveal quantitative views of human aging rates. Mol Cell. 2013;49:359–367. doi: 10.1016/j.molcel.2012.10.016. - DOI - PMC - PubMed
    1. Zhang Q, et al. Improved precision of epigenetic clock estimates across tissues and its implication for biological ageing. Genome Med. 2019;11:1–11. doi: 10.1186/s13073-019-0667-1. - DOI - PMC - PubMed

Publication types