

Identification and verification of feature biomarkers associated with immune cells in neonatal sepsis
- PMID: 36855207
- PMCID: PMC9972688
- DOI: 10.1186/s40001-023-01061-2
Identification and verification of feature biomarkers associated with immune cells in neonatal sepsis
Abstract
Background: Neonatal sepsis (NS), a life-threatening condition, is characterized by organ dysfunction and is the most common cause of neonatal death. However, the pathogenesis of NS is unclear and the clinical inflammatory markers currently used are not ideal for diagnosis of NS. Thus, exploring the link between immune responses in NS pathogenesis, elucidating the molecular mechanisms involved, and identifying potential therapeutic targets is of great significance in clinical practice. Herein, our study aimed to explore immune-related genes in NS and identify potential diagnostic biomarkers. Datasets for patients with NS and healthy controls were downloaded from the GEO database; GSE69686 and GSE25504 were used as the analysis and validation datasets, respectively. Differentially expressed genes (DEGs) were identified and Gene Set Enrichment Analysis (GSEA) was performed to determine their biological functions. Composition of immune cells was determined and immune-related genes (IRGs) between the two clusters were identified and their metabolic pathways were determined. Key genes with correlation coefficient > 0.5 and p < 0.05 were selected as screening biomarkers. Logistic regression models were constructed based on the selected biomarkers, and the diagnostic models were validated.
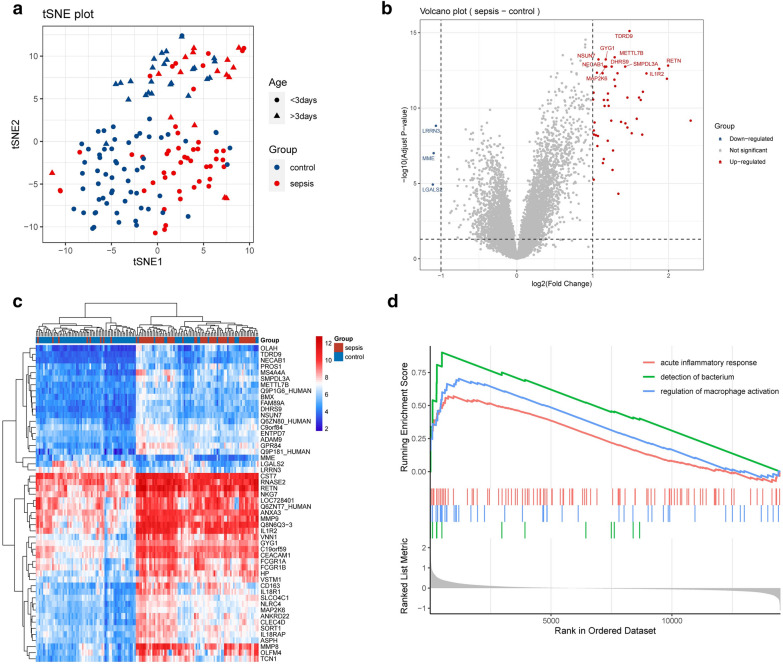
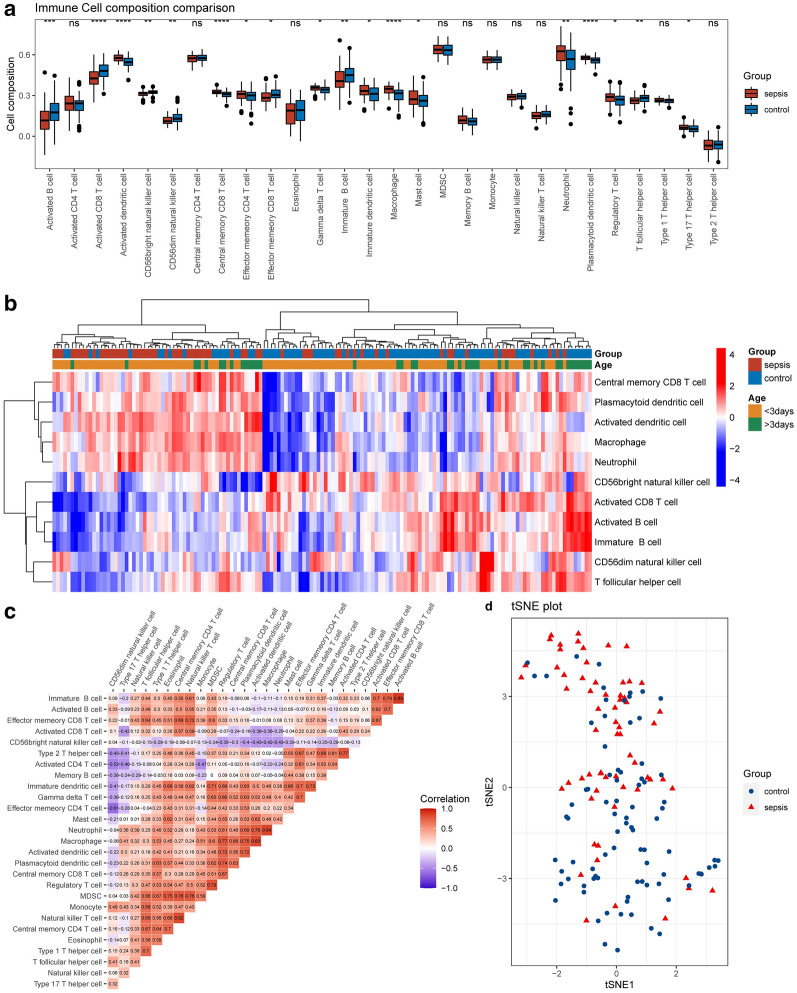
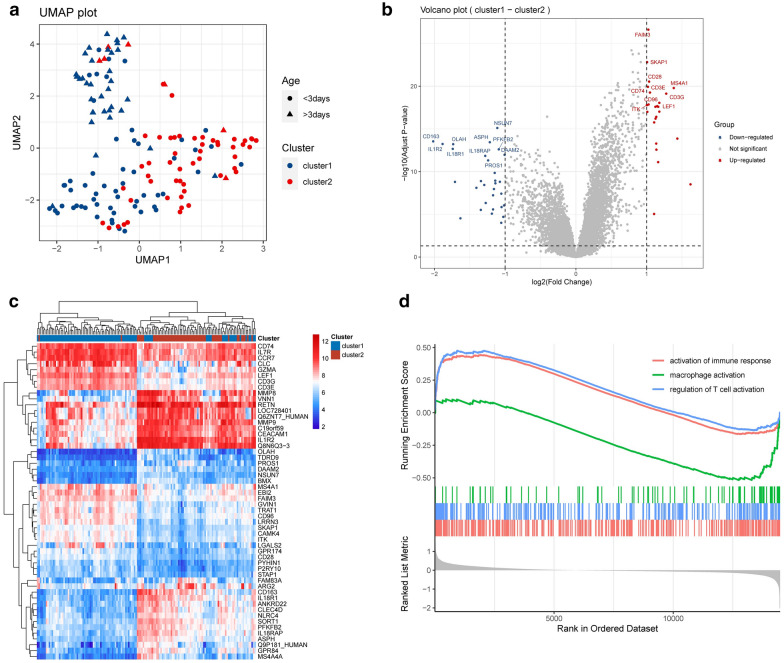
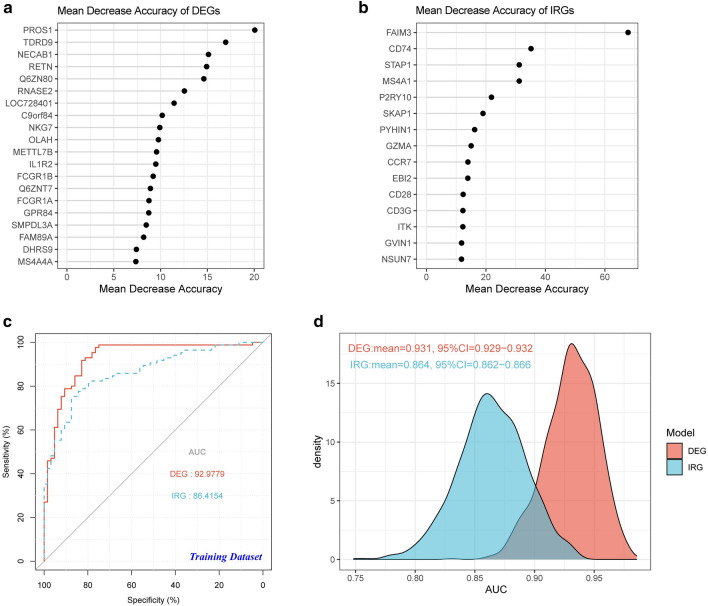
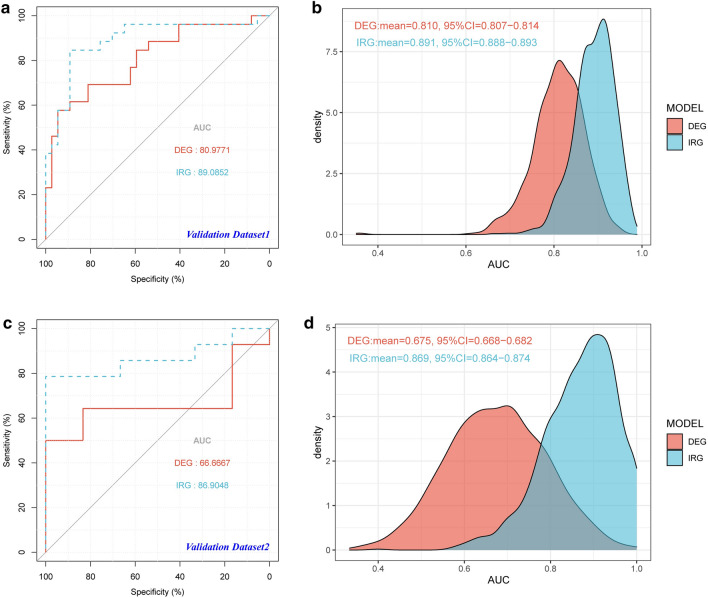
Results: Fifty-two DEGs were identified, and GSEA indicated involvement in acute inflammatory response, bacterial detection, and regulation of macrophage activation. Most infiltrating immune cells, including activated CD8 + T cells, were significantly different in patients with NS compared to the healthy controls. Fifty-four IRGs were identified, and GSEA indicated involvement in immune response and macrophage activation and regulation of T cell activation. Diagnostic models of DEGs containing five genes (PROS1, TDRD9, RETN, LOC728401, and METTL7B) and IRG with one gene (NSUN7) constructed using LASSO algorithm were validated using the GPL6947 and GPL13667 subset datasets, respectively. The IRG model outperformed the DEG model. Additionally, statistical analysis suggested that risk scores may be related to gestational age and birth weight, regardless of sex.
Conclusions: We identified six IRGs as potential diagnostic biomarkers for NS and developed diagnostic models for NS. Our findings provide a new perspective for future research on NS pathogenesis.
Keywords: Biomarkers; Diagnosis model; Immune infiltration; Logistic regression; Neonatal sepsis.
© 2023. The Author(s).
Conflict of interest statement
The authors declare that they have no competing interests.
Figures
Similar articles
-
Identification of key biomarkers in neonatal sepsis by integrated bioinformatics analysis and clinical validation.Heliyon. 2022 Nov 15;8(11):e11634. doi: 10.1016/j.heliyon.2022.e11634. eCollection 2022 Nov. Heliyon. 2022. PMID: 36411922 Free PMC article.
-
Development of a Novel Inflammatory-Associated Gene Signature and Immune Infiltration Patterns in Intervertebral Disc Degeneration.Oxid Med Cell Longev. 2022 Sep 22;2022:2481071. doi: 10.1155/2022/2481071. eCollection 2022. Oxid Med Cell Longev. 2022. PMID: 36193061 Free PMC article.
-
Identification and validation of a novel four-gene diagnostic model for neonatal early-onset sepsis with bacterial infection.Eur J Pediatr. 2023 Mar;182(3):977-985. doi: 10.1007/s00431-022-04753-9. Epub 2022 Dec 17. Eur J Pediatr. 2023. PMID: 36527479 Free PMC article.
-
Bioinformatic Analysis and Machine Learning Methods in Neonatal Sepsis: Identification of Biomarkers and Immune Infiltration.Biomedicines. 2023 Jun 28;11(7):1853. doi: 10.3390/biomedicines11071853. Biomedicines. 2023. PMID: 37509492 Free PMC article.
-
Clinical and immunological aspects of microRNAs in neonatal sepsis.Biomed Pharmacother. 2022 Jan;145:112444. doi: 10.1016/j.biopha.2021.112444. Epub 2021 Nov 19. Biomed Pharmacother. 2022. PMID: 34808550 Review.
Cited by
-
Identification and validation of key biomarkers based on RNA methylation genes in sepsis.Front Immunol. 2023 Aug 28;14:1231898. doi: 10.3389/fimmu.2023.1231898. eCollection 2023. Front Immunol. 2023. PMID: 37701433 Free PMC article.
-
PROS1 is a crucial gene in the macrophage efferocytosis of diabetic foot ulcers: a concerted analytical approach through the prisms of computer analysis.Aging (Albany NY). 2024 Apr 10;16(8):6883-6897. doi: 10.18632/aging.205732. Epub 2024 Apr 10. Aging (Albany NY). 2024. PMID: 38613800 Free PMC article.
-
A practical predictive model to predict 30-day mortality in neonatal sepsis.Rev Assoc Med Bras (1992). 2024 Aug 16;70(7):e20231561. doi: 10.1590/1806-9282.20231561. eCollection 2024. Rev Assoc Med Bras (1992). 2024. PMID: 39166657 Free PMC article.
-
Application of Advanced Molecular Methods to Study Early-Onset Neonatal Sepsis.Int J Mol Sci. 2024 Feb 13;25(4):2258. doi: 10.3390/ijms25042258. Int J Mol Sci. 2024. PMID: 38396935 Free PMC article. Review.
-
Comprehensive analysis of immunogenic cell death-related gene and construction of prediction model based on WGCNA and multiple machine learning in severe COVID-19.Sci Rep. 2024 Apr 11;14(1):8450. doi: 10.1038/s41598-024-59117-0. Sci Rep. 2024. PMID: 38600309 Free PMC article.
References
MeSH terms
Substances
Grants and funding
LinkOut - more resources
Full Text Sources
Research Materials
Miscellaneous
