

Genome sequencing of Sitopsis species provides insights into their contribution to the B subgenome of bread wheat
- PMID: 36855304
- PMCID: PMC10363506
- DOI: 10.1016/j.xplc.2023.100567
Genome sequencing of Sitopsis species provides insights into their contribution to the B subgenome of bread wheat
Abstract
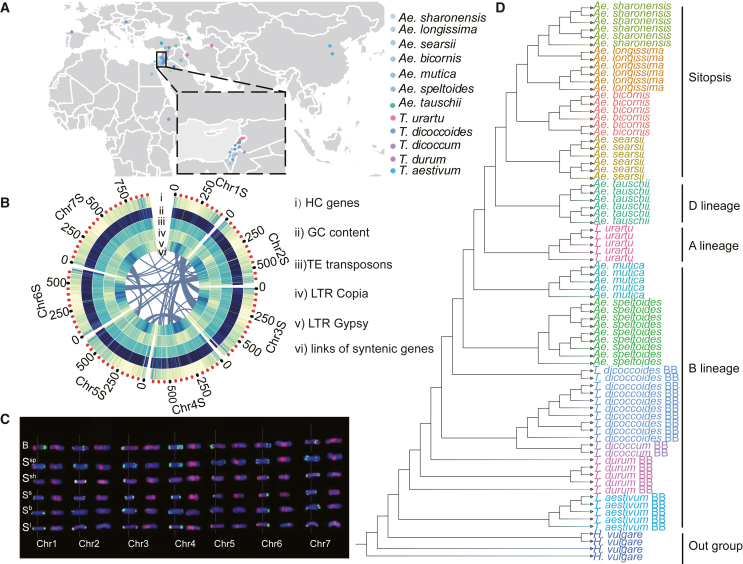
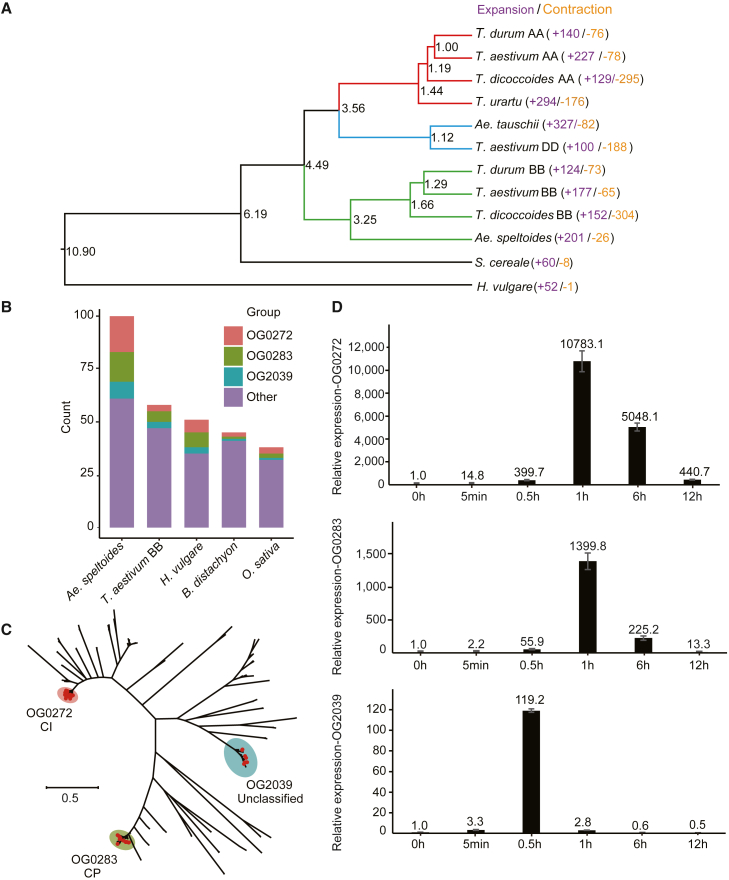
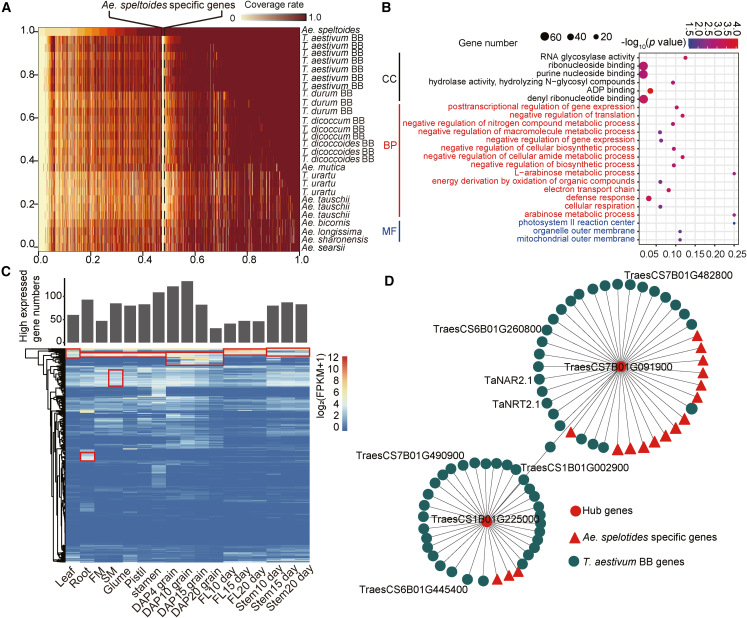
Wheat (Triticum aestivum, BBAADD) is an allohexaploid species that originated from two polyploidization events. The progenitors of the A and D subgenomes have been identified as Triticum urartu and Aegilops tauschii, respectively. Current research suggests that Aegilops speltoides is the closest but not the direct ancestor of the B subgenome. However, whether Ae. speltoides has contributed genomically to the wheat B subgenome and which chromosome regions are conserved between Ae. speltoides and the B subgenome remain unclear. Here, we assembled a high-quality reference genome for Ae. speltoides, resequenced 53 accessions from seven species (Aegilops bicornis, Aegilops longissima, Aegilops searsii, Aegilops sharonensis, Ae. speltoides, Aegilops mutica [syn. Amblyopyrum muticum], and Triticum dicoccoides) and revealed their genomic contributions to the wheat B subgenome. Our results showed that centromeric regions were particularly conserved between Aegilops and Triticum and revealed 0.17 Gb of conserved blocks between Ae. speltoides and the B subgenome. We classified five groups of conserved and non-conserved genes between Aegilops and Triticum, revealing their biological characteristics, differentiation in gene expression patterns, and collinear relationships between Ae. speltoides and the wheat B subgenome. We also identified gene families that expanded in Ae. speltoides during its evolution and 789 genes specific to Ae. speltoides. These genes can serve as genetic resources for improvement of adaptability to biotic and abiotic stress. The newly constructed reference genome and large-scale resequencing data for Sitopsis species will provide a valuable genomic resource for wheat genetic improvement and genomic studies.
Keywords: Aegilops; B subgenome; Sitopsis; conserved blocks; polyploid wheat.
Copyright © 2023 The Author(s). Published by Elsevier Inc. All rights reserved.
Figures


Similar articles
-
Genome sequences of five Sitopsis species of Aegilops and the origin of polyploid wheat B subgenome.Mol Plant. 2022 Mar 7;15(3):488-503. doi: 10.1016/j.molp.2021.12.019. Epub 2022 Jan 1. Mol Plant. 2022. PMID: 34979290
-
Genome sequences of three Aegilops species of the section Sitopsis reveal phylogenetic relationships and provide resources for wheat improvement.Plant J. 2022 Apr;110(1):179-192. doi: 10.1111/tpj.15664. Epub 2022 Feb 12. Plant J. 2022. PMID: 34997796 Free PMC article.
-
The origin of the B-genome of bread wheat (Triticum aestivum L.).Genetika. 2013 Mar;49(3):303-14. doi: 10.7868/s0016675813030077. Genetika. 2013. PMID: 23755530
-
Gametocidal genes of Aegilops: segregation distorters in wheat-Aegilops wide hybridization.Genome. 2017 Aug;60(8):639-647. doi: 10.1139/gen-2017-0023. Epub 2017 Jun 27. Genome. 2017. PMID: 28654760 Review.
-
Broadening the bread wheat D genome.Theor Appl Genet. 2019 May;132(5):1295-1307. doi: 10.1007/s00122-019-03299-z. Epub 2019 Feb 10. Theor Appl Genet. 2019. PMID: 30739154 Review.
Cited by
-
Comparative Analysis Reveals Different Evolutionary Fates and Biological Functions in Wheat Duplicated Genes (Triticum aestivum L.).Plants (Basel). 2023 Aug 22;12(17):3021. doi: 10.3390/plants12173021. Plants (Basel). 2023. PMID: 37687268 Free PMC article.
-
Bioinformatic Identification and Expression Analyses of the MAPK-MAP4K Gene Family Reveal a Putative Functional MAP4K10-MAP3K7/8-MAP2K1/11-MAPK3/6 Cascade in Wheat (Triticum aestivum L.).Plants (Basel). 2024 Mar 24;13(7):941. doi: 10.3390/plants13070941. Plants (Basel). 2024. PMID: 38611471 Free PMC article.
-
A telomere-to-telomere genome assembly coupled with multi-omic data provides insights into the evolution of hexaploid bread wheat.Nat Genet. 2025 Apr;57(4):1008-1020. doi: 10.1038/s41588-025-02137-x. Epub 2025 Apr 7. Nat Genet. 2025. PMID: 40195562 Free PMC article.
-
Mapping of Aegilops speltoides derived leaf rust and stripe rust resistance genes using 35K SNP array.BMC Genom Data. 2024 Jul 15;25(1):69. doi: 10.1186/s12863-024-01247-5. BMC Genom Data. 2024. PMID: 39009972 Free PMC article.
-
Genomic structural variation in an alpha/beta hydrolase triggers hybrid necrosis in wheat.Nat Commun. 2025 Mar 18;16(1):2655. doi: 10.1038/s41467-025-57750-5. Nat Commun. 2025. PMID: 40102399 Free PMC article.
References
-
- International Wheat Genome Sequencing Consortium IWGSC, Appels R., Eversole K., Feuillet C., Keller B., Rogers J., Stein N., Pozniak C.J., Choulet F., Distelfeld A., et al. Shifting the limits in wheat research and breeding using a fully annotated reference genome. Science. 2018;361:eaar7191. doi: 10.1126/science.aar7191. - DOI - PubMed
-
- Avni R., Lux T., Minz-Dub A., Millet E., Sela H., Distelfeld A., Deek J., Yu G., Steuernagel B., Pozniak C., et al. Genome sequences of three Aegilops species of the section Sitopsis reveal phylogenetic relationships and provide resources for wheat improvement. Plant J. 2022;110:179–192. doi: 10.1111/tpj.15664. - DOI - PMC - PubMed
-
- Awlachew Z.T., Singh R., Kaur S., Bains N.S., Chhuneja P. Transfer and mapping of the heat tolerance component traits of Aegilops speltoides in tetraploid wheat Triticum durum. Mol. Breeding. 2016;36:78. doi: 10.1007/s11032-016-0499-2. - DOI
Publication types
MeSH terms
LinkOut - more resources
Full Text Sources
Molecular Biology Databases
Miscellaneous
