. 2023;8(1):16.
doi: 10.1007/s41109-023-00540-z. Epub 2023 Feb 24.

Impact of network centrality and income on slowing infection spread after outbreaks

Affiliations

Impact of network centrality and income on slowing infection spread after outbreaks

Shiv G Yücel et al. Appl Netw Sci. 2023.

Abstract

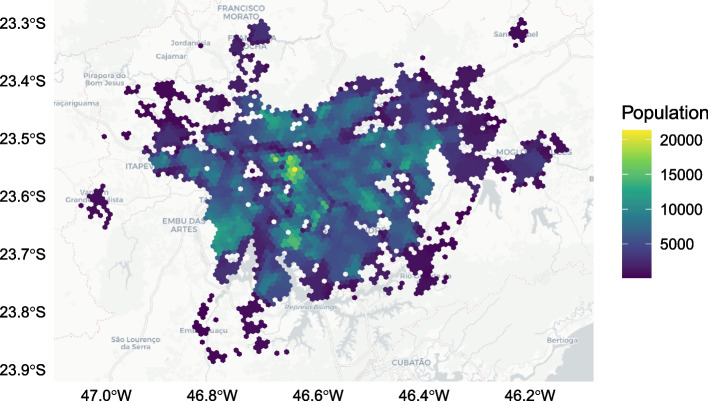
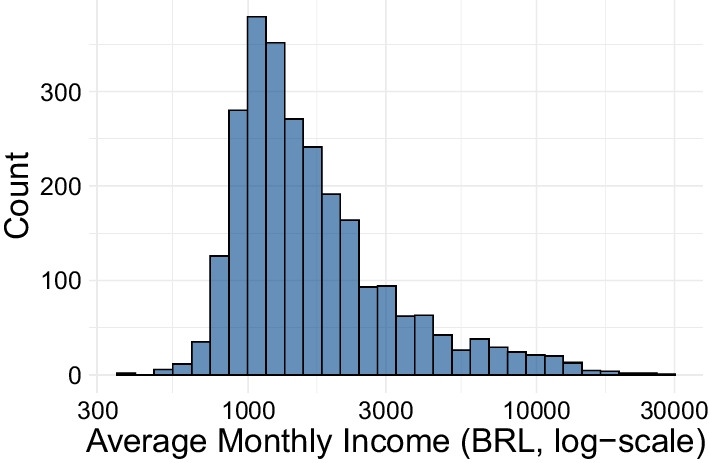
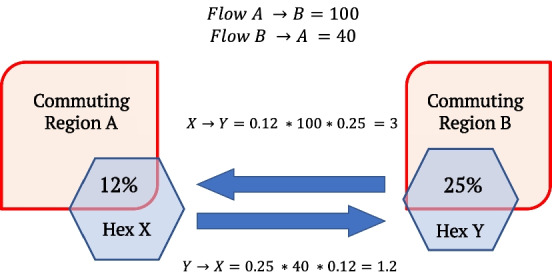
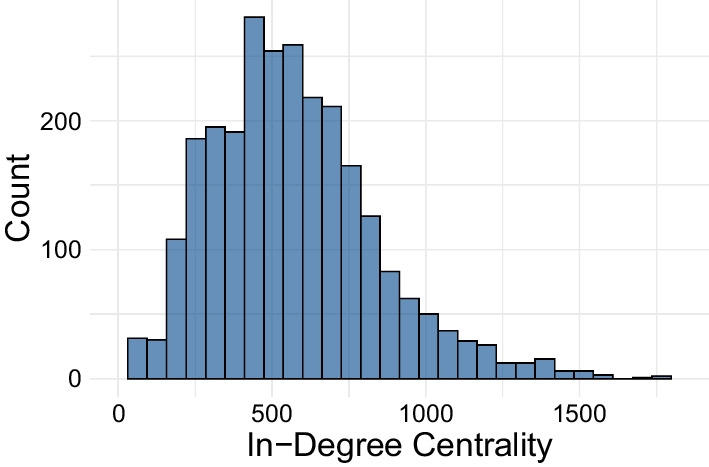
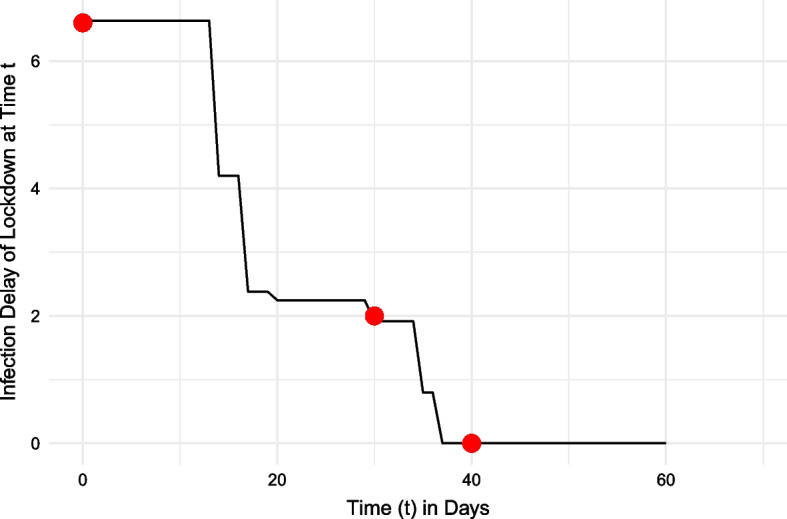
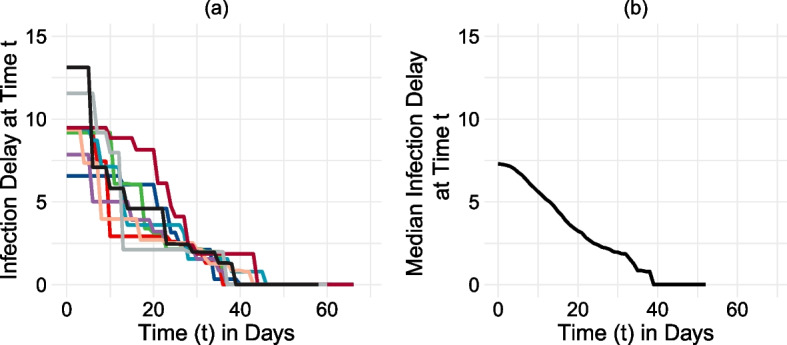
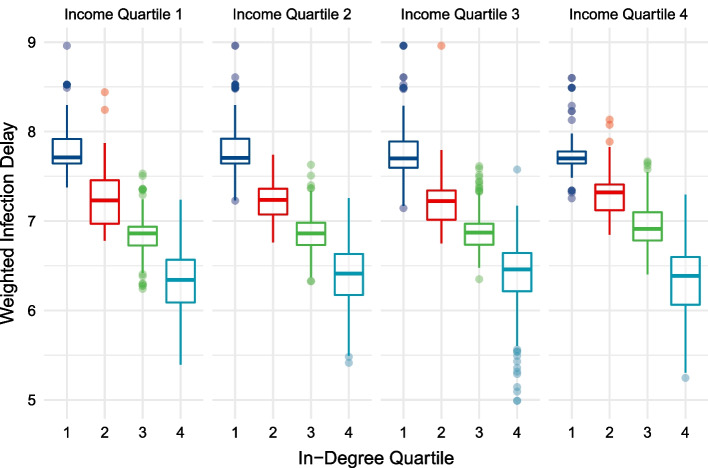
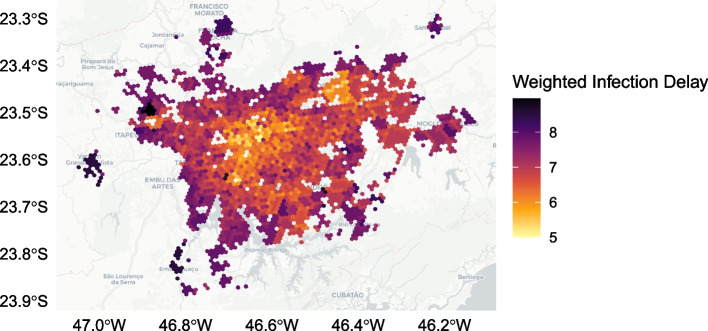
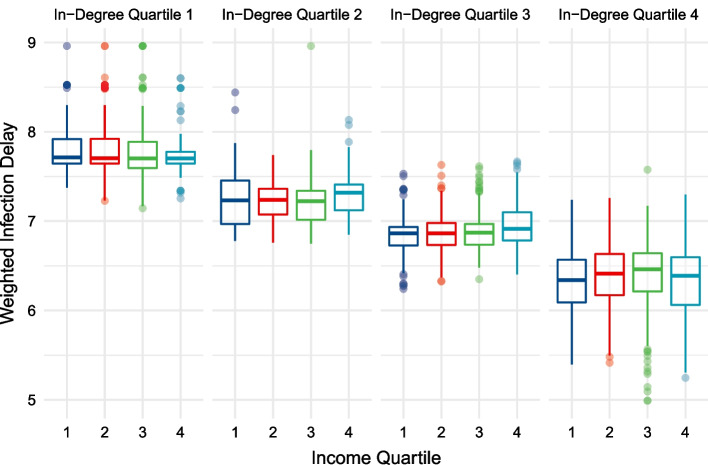
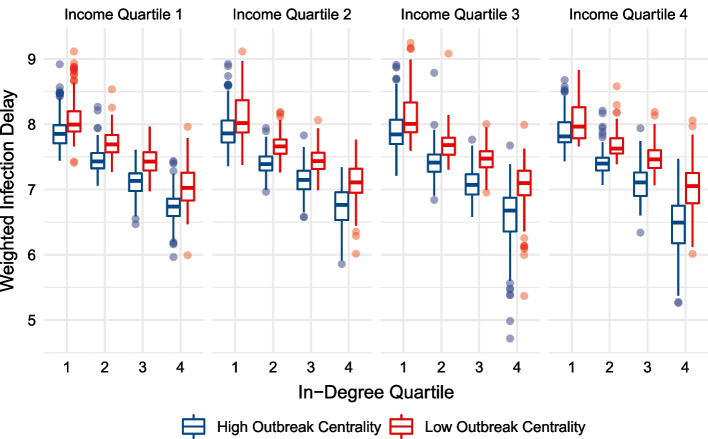
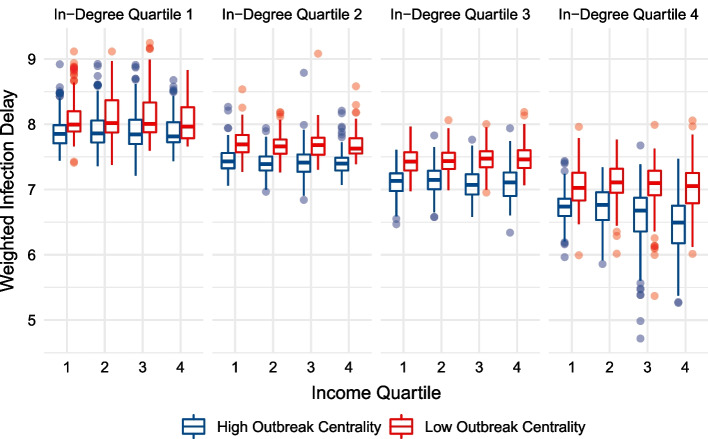
The COVID-19 pandemic has shed light on how the spread of infectious diseases worldwide are importantly shaped by both human mobility networks and socio-economic factors. However, few studies look at how both socio-economic conditions and the complex network properties of human mobility patterns interact, and how they influence outbreaks together. We introduce a novel methodology, called the Infection Delay Model, to calculate how the arrival time of an infection varies geographically, considering both effective distance-based metrics and differences in regions' capacity to isolate-a feature associated with socio-economic inequalities. To illustrate an application of the Infection Delay Model, this paper integrates household travel survey data with cell phone mobility data from the São Paulo metropolitan region to assess the effectiveness of lockdowns to slow the spread of COVID-19. Rather than operating under the assumption that the next pandemic will begin in the same region as the last, the model estimates infection delays under every possible outbreak scenario, allowing for generalizable insights into the effectiveness of interventions to delay a region's first case. The model sheds light on how the effectiveness of lockdowns to slow the spread of disease is influenced by the interaction of mobility networks and socio-economic levels. We find that a negative relationship emerges between network centrality and the infection delay after a lockdown, irrespective of income. Furthermore, for regions across all income and centrality levels, outbreaks starting in less central locations were more effectively slowed by a lockdown. Using the Infection Delay Model, this paper identifies and quantifies a new dimension of disease risk faced by those most central in a mobility network.

Keywords: Epidemic intervention effectiveness; Human mobility; Socio-economic inequality; Spatial analysis.


Conflict of interest statement

Competing interestsThe authors declare that they have no competing interests.

Figures

Fig. 1
Fig. 1
Geographic distribution of all hexagonal cells in the Metropolitan Region of São Paulo for which daily isolation levels are available from the mobile analytics company InLoco/Incognia (Incognia 2020). Shows variation in populations across the Metropolitan Region of São Paulo
Fig. 2
Fig. 2
Distribution of average income per capita (Brazilian Real per month) across hexagon cells
Fig. 3
Fig. 3
Travel survey data interpolation strategy from travel zones to hexagon cells. Outflow and inflow are proportional to a hexagon cell’s overlap with a travel zone. To estimate travel patterns within a given hexagon, known inflow and outflow between travels zones A and B are proportionally allocated based on the overlap. For example, Hexagon X overlaps with 12% of Region A, and therefore 12% of Region A’s outflow is assigned to Hexagon X. Hexagon Y overlaps with 25% of Region B, and therefore 25% of the 12% outflow is assigned to Hexagon Y as inflow
Fig. 4
Fig. 4
Distribution of in-degree centrality for hexagon cells in the interpolated mobility network
Fig. 5
Fig. 5
Hypothetical infection delay curve for region-at-risk A caused by a lockdown, following an outbreak beginning in region B. At time t=0, location B would be the only infected region—as the outbreak location. At this time, a lockdown would allow region A to gain approximately 6.6 days (y-axis) until its first case of COVID-19. If the disease were to spread unmitigated until time t=30 days, a lockdown would provide a gain of only 2 days before region A’s first case. At the 40-day mark following an outbreak in region B, without any intervention, region A would already be infected. Thus, a lockdown intervention at this point would have no ability to delay the onset of infection, with a y-axis value of 0
Fig. 6
Fig. 6
Illustrative example of infection delay median pipeline for a single hexagon cell, using only 10 outbreaks for visualisation (real analysis uses 2598 outbreak scenarios). From left to right: a the infection delay curves are calculated for each outbreak location; b the median of those curves are taken at every time t to create a general characterisation of lockdown effectiveness in the region-at-risk
Fig. 7
Fig. 7
Weighted median infection delay values across in-degree centrality quartiles, while controlling for income
Fig. 8
Fig. 8
Geographic distribution of weighted median infection delay values over the first ten days of an outbreak
Fig. 9
Fig. 9
Weighted median infection delay values across income quartiles, while controlling for in-degree centrality
Fig. 10
Fig. 10
Un-weighted infection delay values across in-degree centrality quartiles, while controlling for income. Each region’s infection delay values are calculated and displayed for outbreak scenarios in the upper and lower 50% of in-degree centrality
Fig. 11
Fig. 11
Un-weighted infection delay values across income quartiles, while controlling for in-degree centrality. Each region’s infection delay values are calculated and displayed for outbreak scenarios in the upper and lower 50% of in-degree centrality

Similar articles

References

    1. Ajbar A, Alqahtani RT, Boumaza M. Dynamics of an SIR-based COVID-19 model with linear incidence rate, nonlinear removal rate, and public awareness. Front Phys. 2021;9:634251. doi: 10.3389/fphy.2021.634251. - DOI
    1. Aleta A, Martín-Corral D, Bakker MA, Pastore y Piontti A, Ajelli M, Litvinova M, Chinazzi M, Dean NE, Halloran ME, Longini IM, Jr, Pentland A. Quantifying the importance and location of SARS-CoV-2 transmission events in large metropolitan areas. Proceed Nat Acad Sci. 2022;119(26):e2112182119. doi: 10.1073/pnas.2112182119. - DOI - PMC - PubMed
    1. Balcan D, Colizza V, Gonçalves B, Hud H, Ramasco JJ, Vespignani A. Multiscale mobility networks and the spatial spreading of infectious diseases. Proc Natl Acad Sci USA. 2009;106(51):21484–21489. doi: 10.1073/pnas.0906910106. - DOI - PMC - PubMed
    1. Bonaccorsi G, Pierri F, Cinelli M, Flori A, Galeazzi A, Porcelli F, Schmidt AL, Valensise CM, Scala A, Quattrociocchi W, et al. Economic and social consequences of human mobility restrictions under Covid-19. Proc Natl Acad Sci. 2020;117(27):15530–15535. doi: 10.1073/pnas.2007658117. - DOI - PMC - PubMed
    1. Brockmann D, Helbing D. The hidden geometry of complex, network-driven contagion phenomena (Science (1337)) Science. 2014;343(6172):730. doi: 10.1126/science.343.6172.730-c. - DOI - PubMed

LinkOut - more resources