. 2023 Apr;5(4):e184-e199.
doi: 10.1016/S2665-9913(23)00029-2. Epub 2023 Feb 14.

Immunoglobulin, glucocorticoid, or combination therapy for multisystem inflammatory syndrome in children: a propensity-weighted cohort study

Collaborators, Affiliations

Immunoglobulin, glucocorticoid, or combination therapy for multisystem inflammatory syndrome in children: a propensity-weighted cohort study

Samuel Channon-Wells et al. Lancet Rheumatol. 2023 Apr.

Abstract

Background: Multisystem inflammatory syndrome in children (MIS-C), a hyperinflammatory condition associated with SARS-CoV-2 infection, has emerged as a serious illness in children worldwide. Immunoglobulin or glucocorticoids, or both, are currently recommended treatments.

Methods: The Best Available Treatment Study evaluated immunomodulatory treatments for MIS-C in an international observational cohort. Analysis of the first 614 patients was previously reported. In this propensity-weighted cohort study, clinical and outcome data from children with suspected or proven MIS-C were collected onto a web-based Research Electronic Data Capture database. After excluding neonates and incomplete or duplicate records, inverse probability weighting was used to compare primary treatments with intravenous immunoglobulin, intravenous immunoglobulin plus glucocorticoids, or glucocorticoids alone, using intravenous immunoglobulin as the reference treatment. Primary outcomes were a composite of inotropic or ventilator support from the second day after treatment initiation, or death, and time to improvement on an ordinal clinical severity scale. Secondary outcomes included treatment escalation, clinical deterioration, fever, and coronary artery aneurysm occurrence and resolution. This study is registered with the ISRCTN registry, ISRCTN69546370.

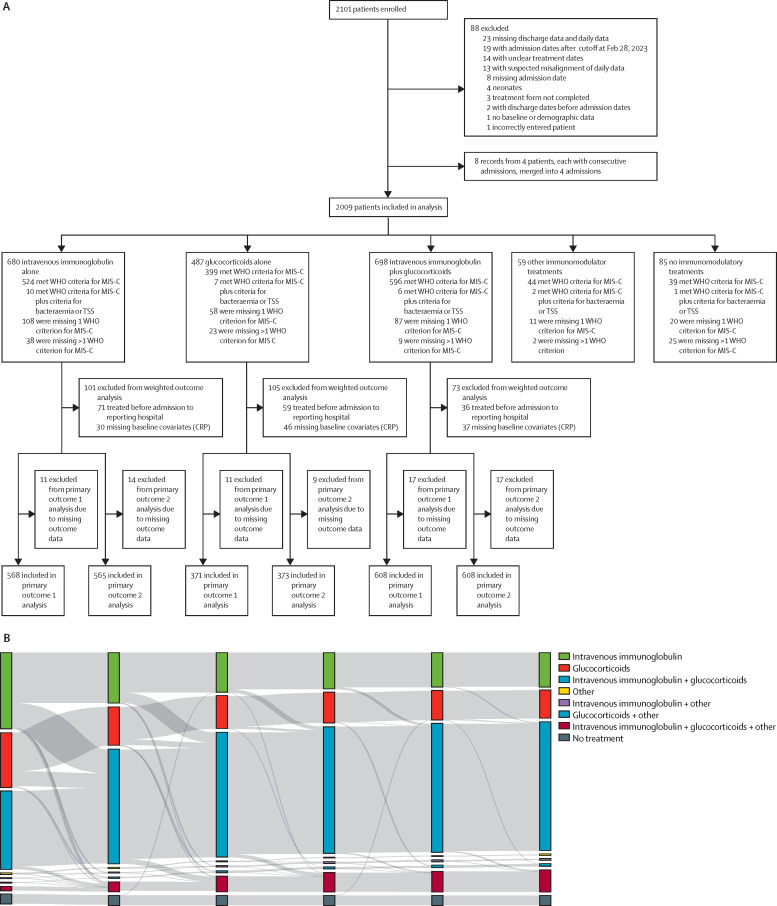
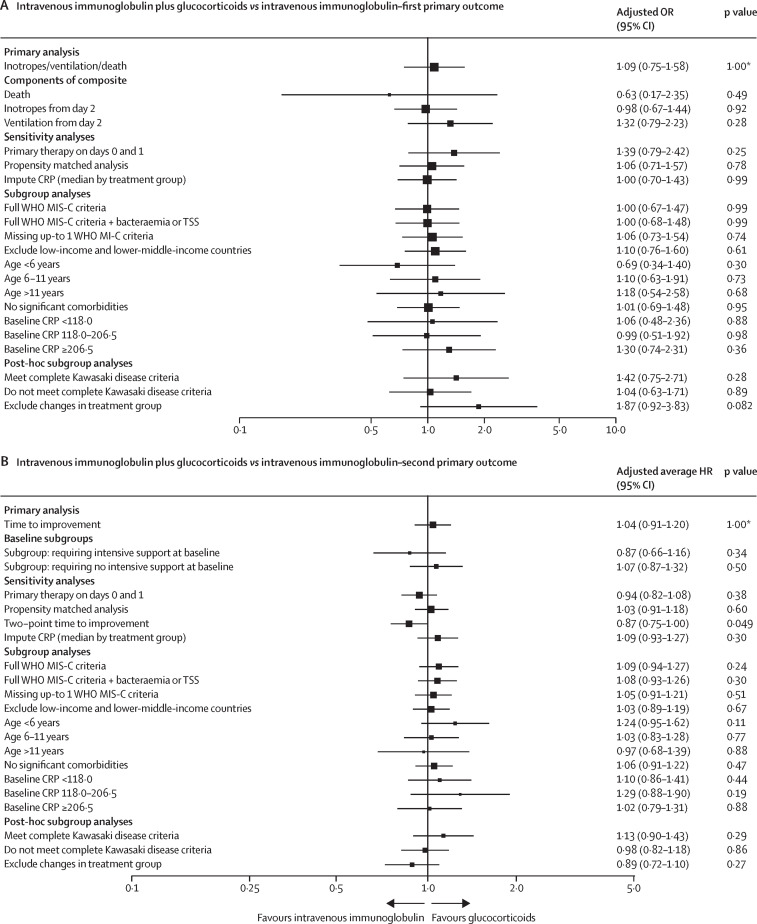
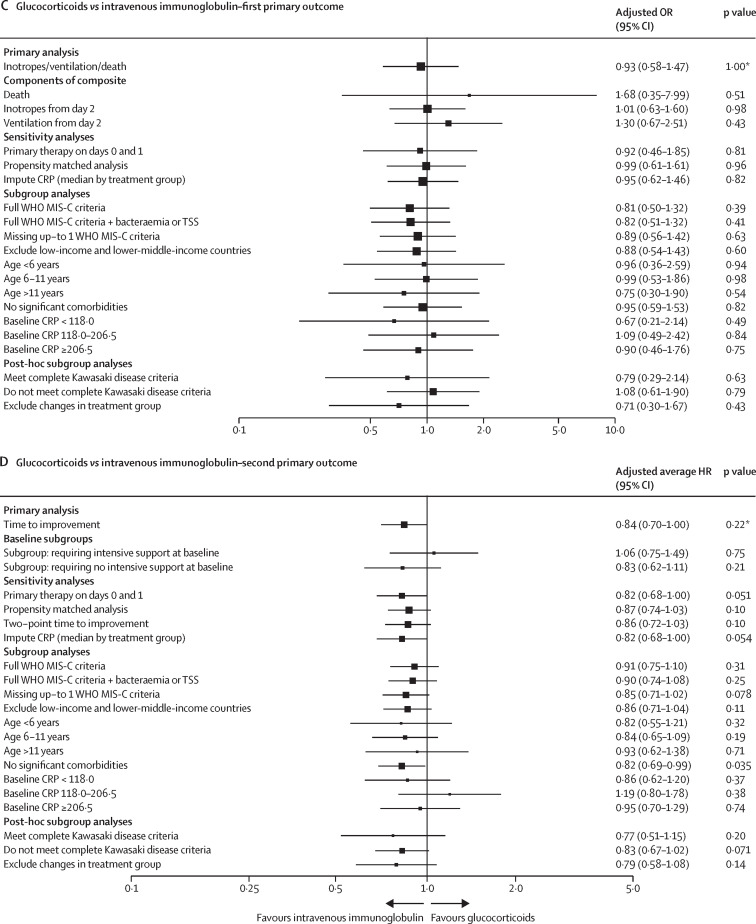
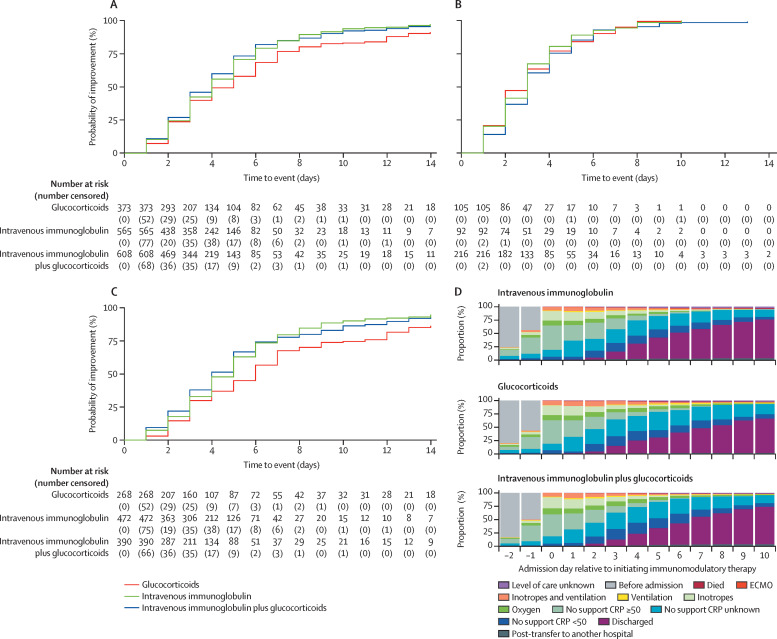
Findings: We enrolled 2101 children (aged 0 months to 19 years) with clinically diagnosed MIS-C from 39 countries between June 14, 2020, and April 25, 2022, and, following exclusions, 2009 patients were included for analysis (median age 8·0 years [IQR 4·2-11·4], 1191 [59·3%] male and 818 [40·7%] female, and 825 [41·1%] White). 680 (33·8%) patients received primary treatment with intravenous immunoglobulin, 698 (34·7%) with intravenous immunoglobulin plus glucocorticoids, 487 (24·2%) with glucocorticoids alone; 59 (2·9%) patients received other combinations, including biologicals, and 85 (4·2%) patients received no immunomodulators. There were no significant differences between treatments for primary outcomes for the 1586 patients with complete baseline and outcome data that were considered for primary analysis. Adjusted odds ratios for ventilation, inotropic support, or death were 1·09 (95% CI 0·75-1·58; corrected p value=1·00) for intravenous immunoglobulin plus glucocorticoids and 0·93 (0·58-1·47; corrected p value=1·00) for glucocorticoids alone, versus intravenous immunoglobulin alone. Adjusted average hazard ratios for time to improvement were 1·04 (95% CI 0·91-1·20; corrected p value=1·00) for intravenous immunoglobulin plus glucocorticoids, and 0·84 (0·70-1·00; corrected p value=0·22) for glucocorticoids alone, versus intravenous immunoglobulin alone. Treatment escalation was less frequent for intravenous immunoglobulin plus glucocorticoids (OR 0·15 [95% CI 0·11-0·20]; p<0·0001) and glucocorticoids alone (0·68 [0·50-0·93]; p=0·014) versus intravenous immunoglobulin alone. Persistent fever (from day 2 onward) was less common with intravenous immunoglobulin plus glucocorticoids compared with either intravenous immunoglobulin alone (OR 0·50 [95% CI 0·38-0·67]; p<0·0001) or glucocorticoids alone (0·63 [0·45-0·88]; p=0·0058). Coronary artery aneurysm occurrence and resolution did not differ significantly between treatment groups.

Interpretation: Recovery rates, including occurrence and resolution of coronary artery aneurysms, were similar for primary treatment with intravenous immunoglobulin when compared to glucocorticoids or intravenous immunoglobulin plus glucocorticoids. Initial treatment with glucocorticoids appears to be a safe alternative to immunoglobulin or combined therapy, and might be advantageous in view of the cost and limited availability of intravenous immunoglobulin in many countries.

Funding: Imperial College London, the European Union's Horizon 2020, Wellcome Trust, the Medical Research Foundation, UK National Institute for Health and Care Research, and National Institutes of Health.


Conflict of interest statement

AT has provided unpaid consultancy work for Janssen Pharmaceuticals. DM has received grant support from the British Embassy in Moscow (StopCOVID Cohort: Clinical Characterisation of Russian Patients) and from UK Research and Innovation/National Institute for Health and Care Research (NIHR; Long COVID Core Outcome Set [PC-COS] project), and holds the following unpaid positions: Co-Chair of International Severe Acute Respiratory and Emerging Infection Consortium (ISARIC) Global Paediatric Long COVID Working Group, Member of ISARIC working group on long-term follow-up in adults, Co-lead of the PC-COS project aiming to define the Core Outcome Set for Long-COVID, in collaboration with the WHO. MJC reports a personal fee from Biotest for speaking at the BioTest Immunology Forum 2022, Royal Society. EW holds the following unpaid positions: member of the paediatric steering committee for the RECOVERY trial; Paediatric Representative for NHS England working on the National paediatric virtual advisory network and expert advisory group for COVID treatment, and independent advisory group for COVID monoclonal antibodies; and Co-lead for the pan-London Post-COVID service for children. All other authors declare no competing interests.

Figures

Figure 1
Figure 1
Study flowchart and treatments received by patients at days 0–5 after initiation of immunomodulator treatment (A) The study flowchart gives an overview of the total number of patients enrolled, excluded, and included for analyses. Patients who met the inclusion criteria are categorised by treatment groups (intravenous immunoglobulin alone, glucocorticoids alone, intravenous immunoglobulin plus glucocorticoids, other immunomodulator treatments [including, anti-tumour necrosis factor, anti-interleukin 1, anti-interleukin 6] and no immunomodulator treatments) and subdivided by our data-driven classification according to the WHO MIS-C criteria. (B) The Sankey diagram shows the number of patients who received cumulative therapies from days after initiation of immunomodulator treatment. Each vertical stack represents a different day in the patients' admission relative to starting immunomodulatory treatment (days 0 to 5), with day 0 representing the first day of immunomodulator treatment. The grey bands represent movement of patients between treatment groups from days 0 to 1, days 1 to 2, days 2 to 3, days 3 to 4, and days 4 to 5. The width of the grey bands is proportional to the number of patients (flow). The flow of patients is independent between time intervals; there is no continuous correspondence across days 1 to 5. Glucocorticoids include intravenous and oral glucocorticoids (appendix p 41). Other includes one or more other immunomodulatory treatments given alone or in combination with glucocorticoids or intravenous immunoglobulin, or both. Other immunomodulatory treatments include anti-interleukin 1, anti-interleukin 6, anti-tumour necrosis factor, cytokine adsorber (CytoSorb), granulocyte colony stimulating factor, colchicine, mesenchymal stem cells, convalescent plasma, cyclophosphamide, plasmapheresis, and hydroxychloroquine. MIS-C=multisystem inflammatory syndrome in children. TSS=toxic shock syndrome.
Figure 2
Figure 2
Forest plots summarising point estimates and 95% CIs for primary analyses, including all subgroup and sensitivity analyses Outcomes for patients with suspected MIS-C who received intravenous immunoglobulin plus glucocorticoids (A, B) or glucocorticoids alone (C, D), compared with those who received intravenous immunoglobulin alone (reference group, indicated by an OR, or average HR, of 1·00). (A, C) The first primary outcome analyses, risk of inotropes, ventilation or death, and values to the right of the dotted line indicate superiority of intravenous immunoglobulin alone. (B, D) The second primary outcome analyses, time to improvement in ordinal clinical severity score, with values to the left indicating superiority of intravenous immunoglobulin alone. CRP=C-reactive protein. HR=hazard ratio. MIS-C=multisystem inflammatory syndrome in children. OR=odds ratio. *p-values corrected for multiple hypothesis testing using the Bonferroni-Holm procedure, observed p value ×4. Absolute numbers of patients included in each analysis can be found in the appendix (pp 29–32).
Figure 2
Figure 2
Forest plots summarising point estimates and 95% CIs for primary analyses, including all subgroup and sensitivity analyses Outcomes for patients with suspected MIS-C who received intravenous immunoglobulin plus glucocorticoids (A, B) or glucocorticoids alone (C, D), compared with those who received intravenous immunoglobulin alone (reference group, indicated by an OR, or average HR, of 1·00). (A, C) The first primary outcome analyses, risk of inotropes, ventilation or death, and values to the right of the dotted line indicate superiority of intravenous immunoglobulin alone. (B, D) The second primary outcome analyses, time to improvement in ordinal clinical severity score, with values to the left indicating superiority of intravenous immunoglobulin alone. CRP=C-reactive protein. HR=hazard ratio. MIS-C=multisystem inflammatory syndrome in children. OR=odds ratio. *p-values corrected for multiple hypothesis testing using the Bonferroni-Holm procedure, observed p value ×4. Absolute numbers of patients included in each analysis can be found in the appendix (pp 29–32).
Figure 3
Figure 3
Weighted clinical improvement over time (A–C) Kaplan-Meier curves for the three main primary treatment groups showing time to one-point improvement in clinical severity on ordinal scale weighted by inverse probability of treatment, for all patients (A), a subgroup of patients needing at least one of inotropes or ventilation at baseline (B), and a subgroup of patients not requiring inotropes or ventilation at baseline (C). Tables below the Kaplan-Meier curves show the numbers at risk at the start of each day, and the number censored at this specific time point. (D) Clinical severity on ordinal scale, shown as proportional column charts from 2 days before treatment to 10 days after treatment, separated by primary treatment group, and weighted by inverse probability of treatment. Additional groups have been added for graphical purposes. CRP=C-reactive protein. ECMO=extracorporeal membrane oxygenation.
Figure 4
Figure 4
Change in CRP, troponin, and ferritin over time Each of three key markers of inflammation (CRP, troponin, and ferritin) is plotted as a line and weighted by the covariate balancing propensity score. The levels are shown as a percentage of each patient's peak value, plotted by day relative to starting treatment. A generalised additive model was used to fit the curves. For each plot patients are only included if they had blood results available both before and after treatment initiation, and only if their last value up to treatment initiation was abnormal (CRP ≥8 mg/L, troponin ≥14 ng/L, and ferritin ≥50 μg/L). (A) Fitted curves for the three measures in patients who received any immunomodulators, compared with those who did not receive immunomodulators, using day of admission as relative admission day for patients not receiving immunomodulator treatment, and curves for troponin in (A) were fitted using a loess model due to small sample numbers. (B) Fitted curves for patients who received intravenous immunoglobulin alone, intravenous immunoglobulin plus glucocorticoids, and glucocorticoids alone as their primary treatment. (C) Fitted curves for the three treatments combined in the patients whose primary treatment did not change between treatment initiation (day 0) and day 2. CRP=C-reactive protein.

References

    1. Riphagen S, Gomez X, Gonzalez-Martinez C, Wilkinson N, Theocharis P. Hyperinflammatory shock in children during COVID-19 pandemic. Lancet. 2020;395:1607–1608. - PMC - PubMed
    1. Viner RM, Whittaker E. Kawasaki-like disease: emerging complication during the COVID-19 pandemic. Lancet. 2020;395:1741–1743. - PMC - PubMed
    1. Whittaker E, Bamford A, Kenny J, et al. Clinical characteristics of 58 children with a pediatric inflammatory multisystem syndrome temporally associated with SARS-CoV-2. JAMA. 2020;324:259–269. - PMC - PubMed
    1. Verdoni L, Mazza A, Gervasoni A, et al. An outbreak of severe Kawasaki-like disease at the Italian epicentre of the SARS-CoV-2 epidemic: an observational cohort study. Lancet. 2020;395:1771–1778. - PMC - PubMed
    1. Feldstein LR, Tenforde MW, Friedman KG, et al. Characteristics and outcomes of US children and adolescents with multisystem inflammatory syndrome in children (MIS-C) compared with severe acute COVID-19. JAMA. 2021;325:1074–1087. - PMC - PubMed