

JAK1/2 inhibitor ruxolitinib promotes the expansion and suppressive action of polymorphonuclear myeloid-derived suppressor cells via the JAK/STAT and ROS-MAPK/NF-κB signalling pathways in acute graft-versus-host disease
- PMID: 36855558
- PMCID: PMC9968240
- DOI: 10.1002/cti2.1441
JAK1/2 inhibitor ruxolitinib promotes the expansion and suppressive action of polymorphonuclear myeloid-derived suppressor cells via the JAK/STAT and ROS-MAPK/NF-κB signalling pathways in acute graft-versus-host disease
Abstract
Objectives: Ruxolitinib, a Janus kinase (JAK) 1/2 inhibitor, demonstrates efficacy for treating steroid-resistant acute graft-versus-host disease (SR-aGVHD) following allogeneic stem cell transplantation (allo-HSCT). Myeloid-derived suppressor cells (MDSCs) have a protective effect on aGVHD via suppressing T cell function. However, the precise features and mechanism of JAK inhibitor-mediated immune modulation on MDSCs subsets remain poorly understood.
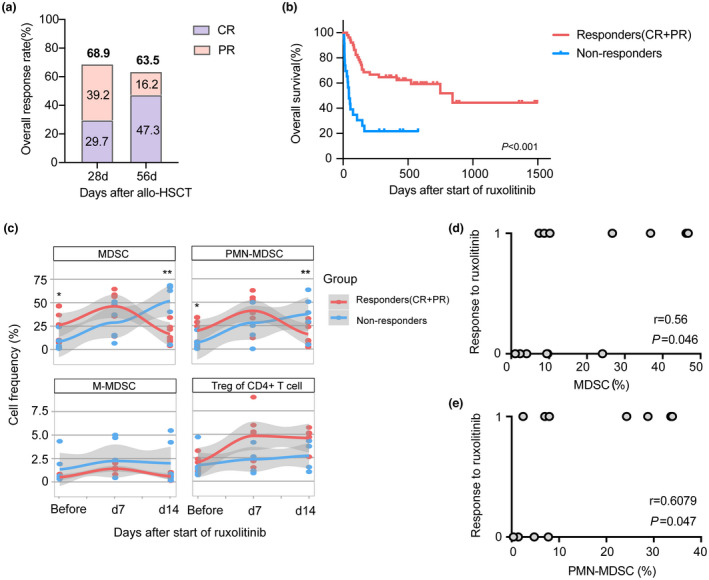
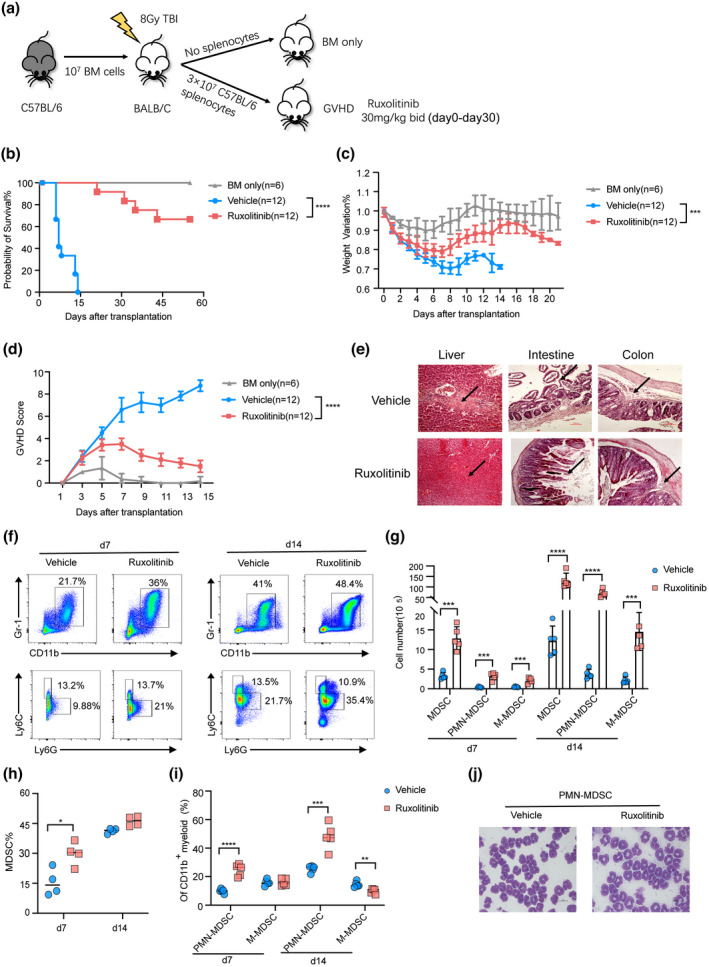
Methods: A total of 74 SR-aGVHD patients treated with allo-HSCT and ruxolitinib were enrolled in the present study. The alterations of MDSC and regulatory T cell (Treg) populations were monitored during ruxolitinib treatment in responders and nonresponders. A mouse model of aGVHD was used to evaluate the immunosuppressive activity of MDSCs and related signalling pathways in response to ruxolitinib administration in vivo and in vitro.
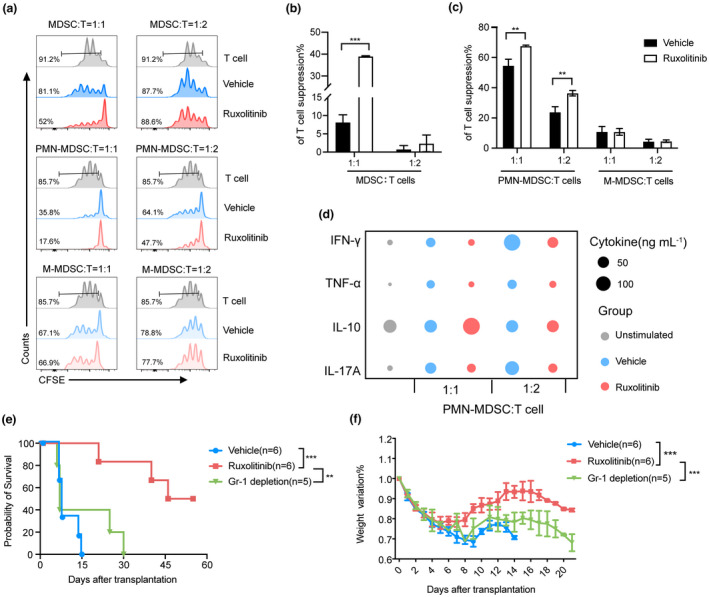
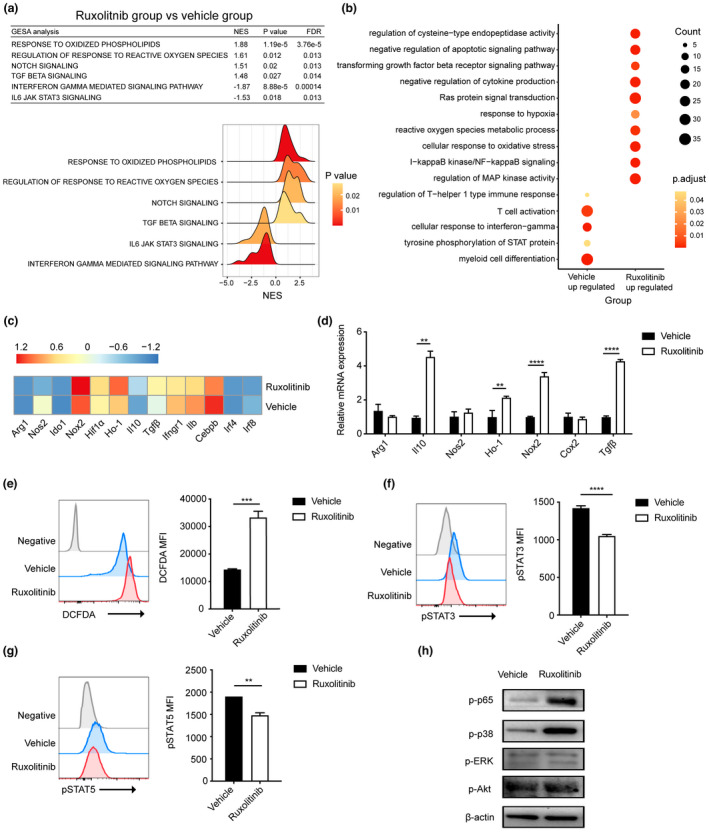
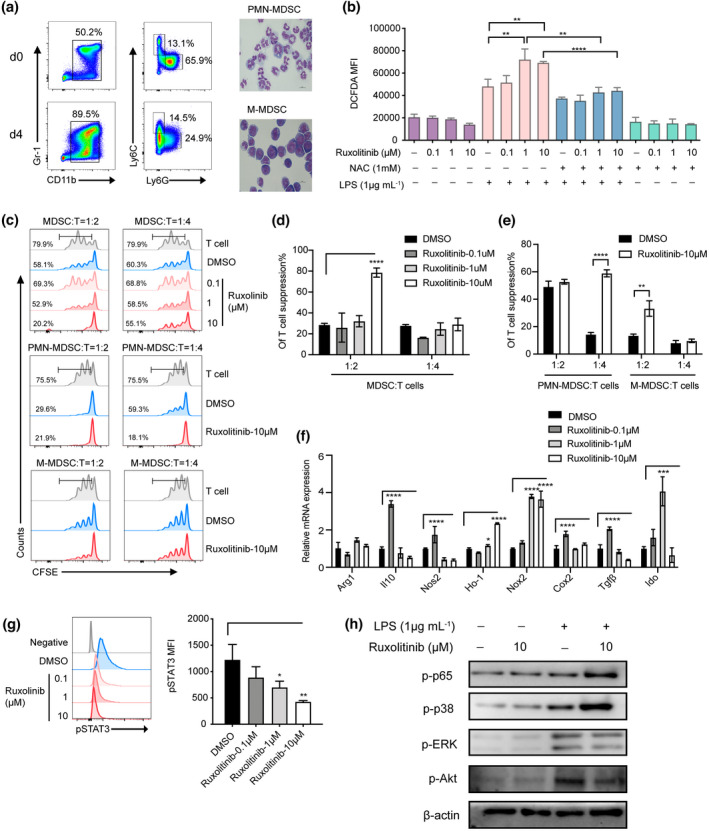
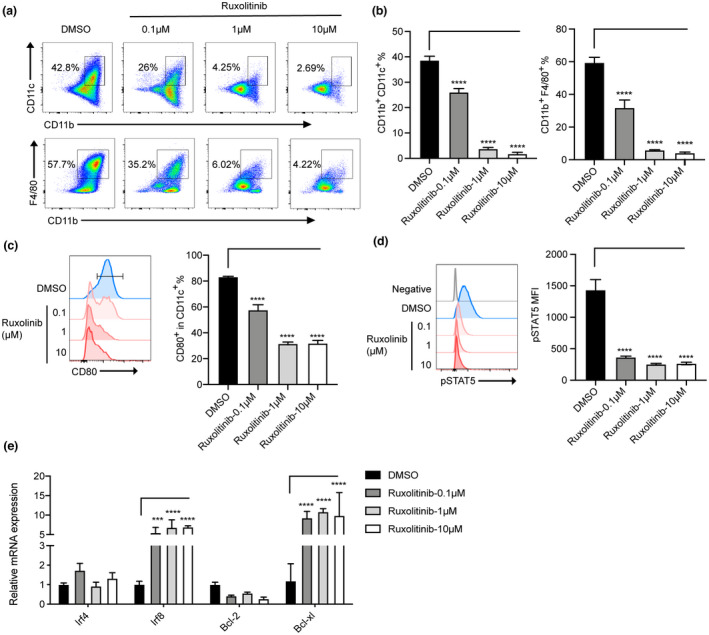
Results: Patients with SR-aGVHD who received ruxolitinib treatment achieved satisfactory outcomes. Elevation proportions of MDSCs before treatment, especially polymorphonuclear-MDSCs (PMN-MDSCs) were better to reflect the response to ruxolitinib than those in Tregs. In the mouse model of aGVHD, the administration of ruxolitinib resulted in the expansion and functional enhancement of PMN-MDSCs and the effects could be partially reversed by an anti-Gr-1 antibody in vivo. Ruxolitinib treatment significantly elevated the suppressive function of PMN-MDSCs through reactive oxygen species (ROS) production by Nox2 upregulation as well as bypassing the activated MAPK/NF-κB signalling pathway. Additionally, ex vivo experiments demonstrated that ruxolitinib prevented the differentiation of mature myeloid cells and promoted the accumulation of MDSCs by inhibiting STAT5.
Conclusions: Ruxolitinib enhances PMN-MDSCs functions through JAK/STAT and ROS-MAPK/NF-κB signalling pathways. Monitoring frequencies and functions of MDSCs can help evaluate treatment responses to ruxolitinib.
Keywords: JAK/STAT pathway; ROS; acute graft‐versus‐host disease; myeloid‐derived suppressor cells.
© 2023 The Authors. Clinical & Translational Immunology published by John Wiley & Sons Australia, Ltd on behalf of Australian and New Zealand Society for Immunology, Inc.
Conflict of interest statement
The authors declare no competing interests.
Figures
Similar articles
-
mTOR inhibitor rapamycin induce polymorphonuclear myeloid-derived suppressor cells mobilization and function in protecting against acute graft-versus-host disease after bone marrow transplantation.Clin Immunol. 2018 Feb;187:122-131. doi: 10.1016/j.clim.2017.11.005. Epub 2017 Nov 10. Clin Immunol. 2018. PMID: 29132870
-
Cyclosporine A regulates PMN-MDSCs viability and function through MPTP in acute GVHD: Old medication, new target.Transplant Cell Ther. 2022 Jul;28(7):411.e1-411.e9. doi: 10.1016/j.jtct.2022.04.010. Epub 2022 Apr 14. Transplant Cell Ther. 2022. PMID: 35430420
-
mTOR Signaling Regulates the Development and Therapeutic Efficacy of PMN-MDSCs in Acute GVHD.Front Cell Dev Biol. 2021 Dec 23;9:741911. doi: 10.3389/fcell.2021.741911. eCollection 2021. Front Cell Dev Biol. 2021. PMID: 35004668 Free PMC article.
-
New Applications of JAK/STAT Inhibitors in Pediatrics: Current Use of Ruxolitinib.Pharmaceuticals (Basel). 2022 Mar 19;15(3):374. doi: 10.3390/ph15030374. Pharmaceuticals (Basel). 2022. PMID: 35337171 Free PMC article. Review.
-
The Role of Myeloid-Derived Suppressor Cells (MDSCs) in Graft-versus-Host Disease (GVHD).J Clin Med. 2021 May 11;10(10):2050. doi: 10.3390/jcm10102050. J Clin Med. 2021. PMID: 34064671 Free PMC article. Review.
Cited by
-
JAK-STAT signaling in inflammation and stress-related diseases: implications for therapeutic interventions.Mol Biomed. 2023 Nov 8;4(1):40. doi: 10.1186/s43556-023-00151-1. Mol Biomed. 2023. PMID: 37938494 Free PMC article. Review.
-
MDSC checkpoint blockade therapy: a new breakthrough point overcoming immunosuppression in cancer immunotherapy.Cancer Gene Ther. 2025 Apr;32(4):371-392. doi: 10.1038/s41417-025-00886-9. Epub 2025 Mar 26. Cancer Gene Ther. 2025. PMID: 40140724 Free PMC article. Review.
-
JAK inhibition enhances checkpoint blockade immunotherapy in patients with Hodgkin lymphoma.Science. 2024 Jun 21;384(6702):eade8520. doi: 10.1126/science.ade8520. Epub 2024 Jun 21. Science. 2024. PMID: 38900864 Free PMC article. Clinical Trial.
-
Stepping forward: T-cell redirecting bispecific antibodies in cancer therapy.Acta Pharm Sin B. 2024 Jun;14(6):2361-2377. doi: 10.1016/j.apsb.2024.03.027. Epub 2024 Mar 24. Acta Pharm Sin B. 2024. PMID: 38828136 Free PMC article. Review.
-
Bladder-cancer-derived exosomal circRNA_0013936 promotes suppressive immunity by up-regulating fatty acid transporter protein 2 and down-regulating receptor-interacting protein kinase 3 in PMN-MDSCs.Mol Cancer. 2024 Mar 9;23(1):52. doi: 10.1186/s12943-024-01968-2. Mol Cancer. 2024. PMID: 38461272 Free PMC article.
References
-
- Xu L, Feng J, Xu X et al. IL‐17‐producing γδT cells ameliorate intestinal acute graft‐versus‐host disease by recruitment of gr‐1+CD11b+ myeloid‐derived suppressor cells. Bone Marrow Transplant 2021; 56: 2389–2399. - PubMed
-
- Zeiser R. Advances in understanding the pathogenesis of graft‐versus‐host disease. Br J Haematol 2019; 187: 563–572. - PubMed
LinkOut - more resources
Full Text Sources
Research Materials
Miscellaneous