Review
. 2022 Dec 7;33(1):89-97.
doi: 10.1055/s-0042-1758880. eCollection 2023 Jan.

Blood in the Brain on Susceptibility-Weighted Imaging

Affiliations
Review

Blood in the Brain on Susceptibility-Weighted Imaging

Neeraj Jain et al. Indian J Radiol Imaging. .

Abstract

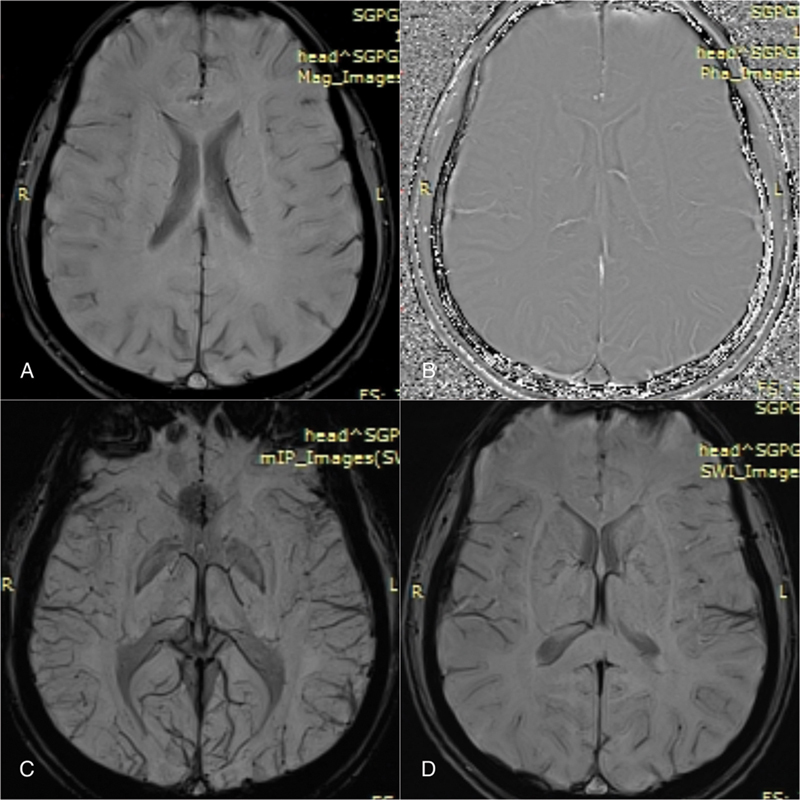
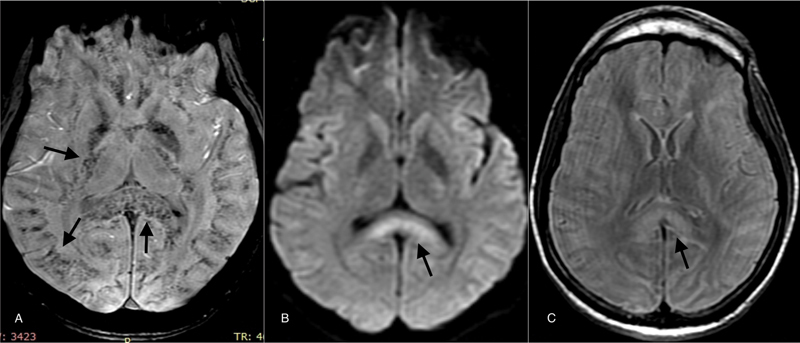
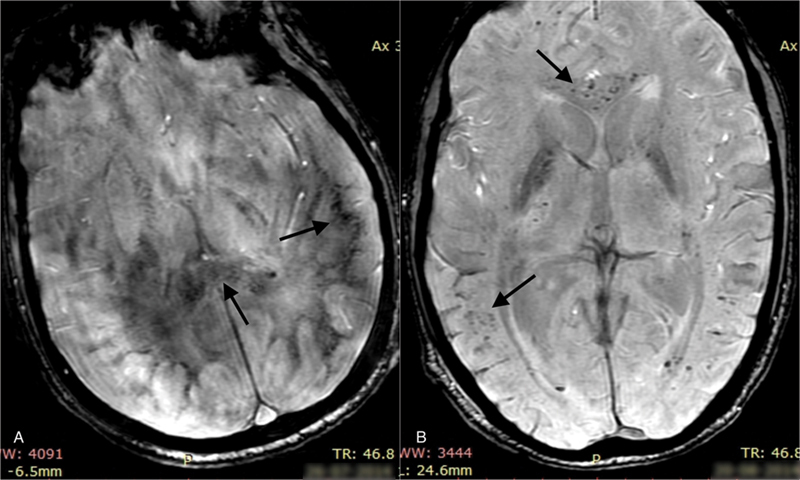
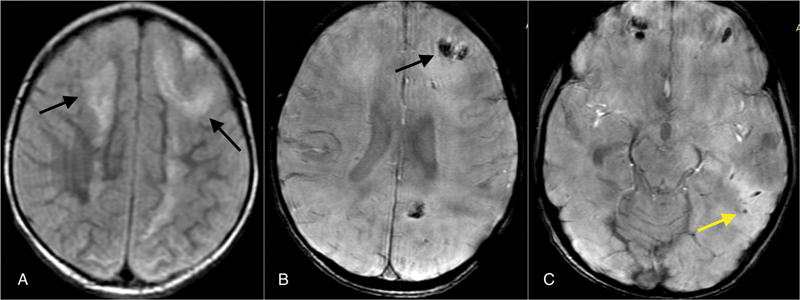
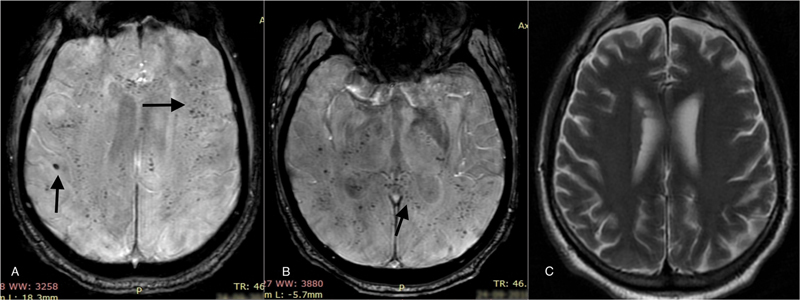
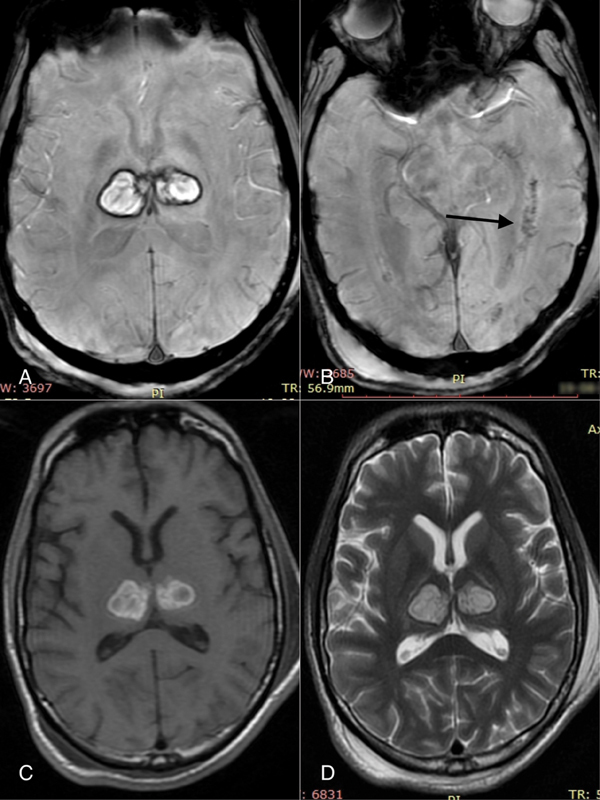
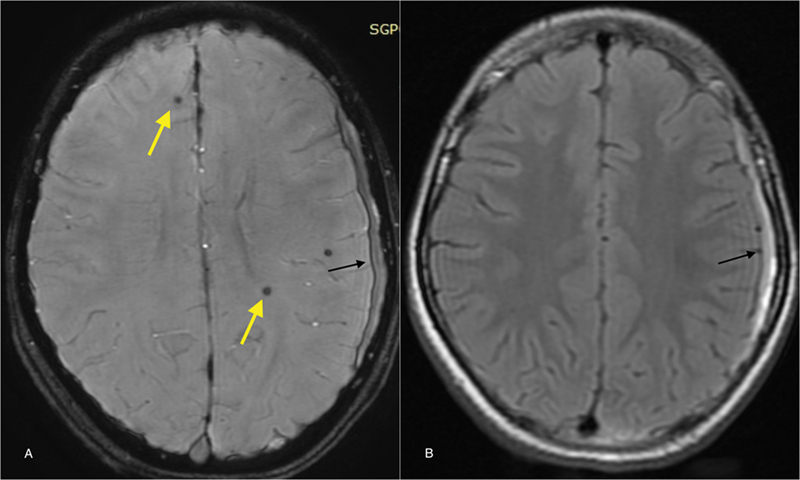
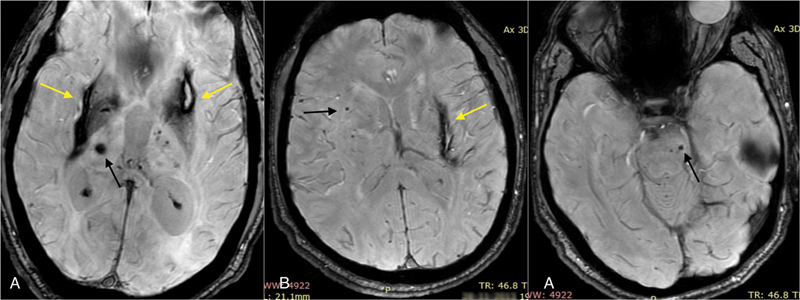
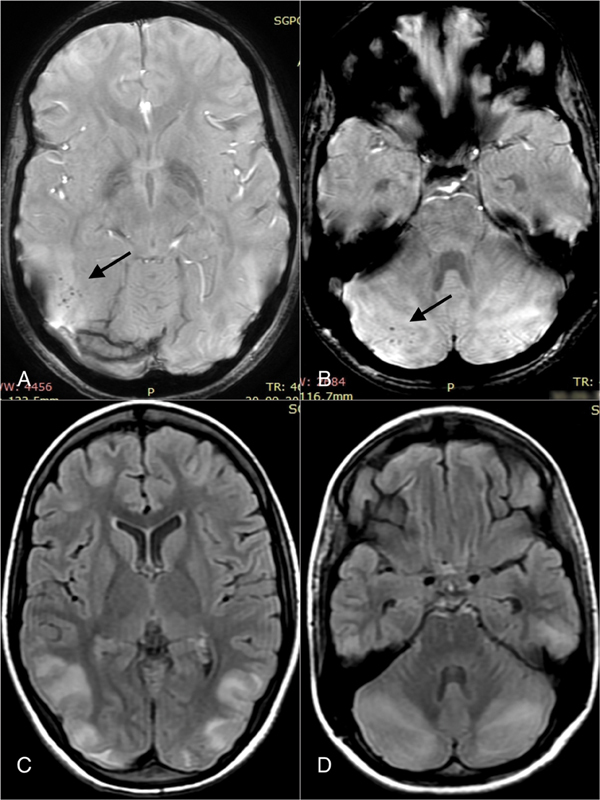
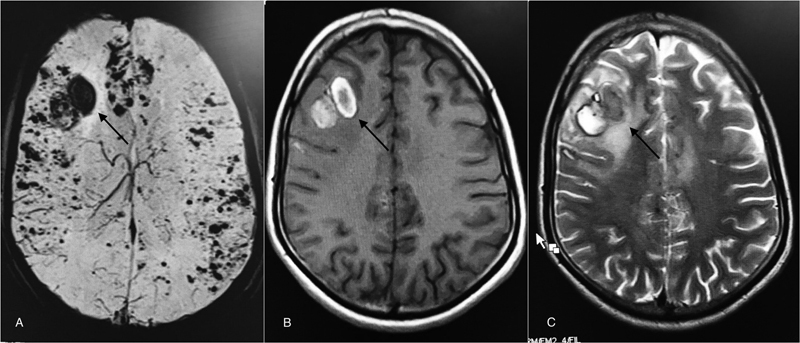
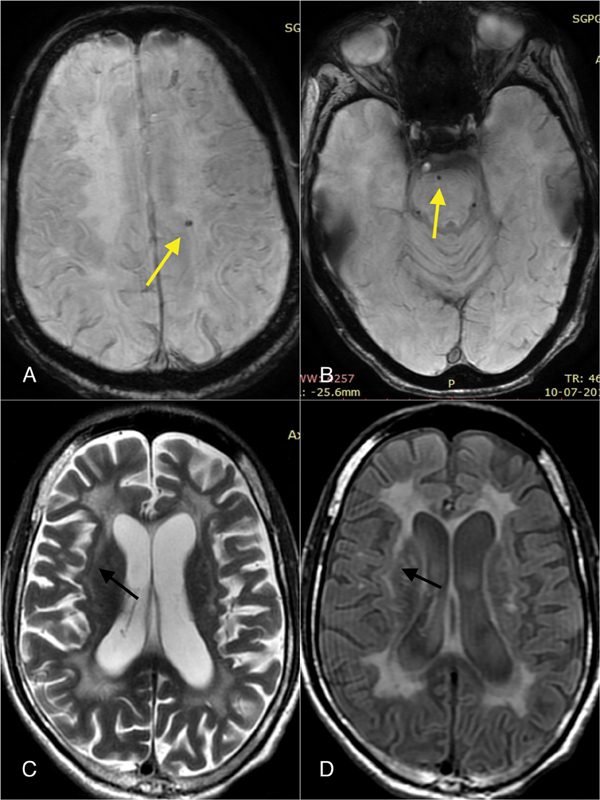
Intraparenchymal brain hemorrhage is not uncommon and results from a wide variety of causes ranging from trauma to tumor. Many a time, it is not possible to determine the exact cause of non-traumatic hemorrhage on conventional magnetic resonance imaging (MRI). Susceptibility-weighted imaging (SWI) is a high-resolution (3D) gradient-echo sequence. It is extremely sensitive to the inhomogeneity of the local magnetic field and highly useful in identifying the small amount of hemorrhage, which may be inapparent on other MR pulse sequences. In this review, we present different pattern of an intra-parenchymal brain hemorrhage on SWI with emphasis on differential diagnosis.

Keywords: brain hemorrhage; hemorrhage; magnetic resonance imaging; microhemorrhage; susceptibility-weighted imaging.


Conflict of interest statement

Conflict of Interest None declared.

Figures

Fig. 1
Fig. 1
Typical susceptibility-weighted imaging sequence, ( A ) magnitude images, ( B ) phase image, ( C ) mIP image, ( D ) susceptibility-weighted image.
Fig. 2
Fig. 2
Cerebral malaria, axial SWI image ( A ) shows diffuse petechial hemorrhages in bilateral fronto-temporo-parietal regions, internal and external capsule and splenium of the corpus callosum. Axial DWI images ( B ) shows hyperintense signal in the splenium of corpus callosum, axial FLAIR image ( C ) shows hyperintense signal bilateral cerebral hemispheres in the cortical-subcortical region and also in the splenium of corpus callosum. However, both DWI and FLAIR images fail to demonstrate petechial hemorrhages (Malarial parasites were detected on microscopic examination of peripheral blood smear).
Fig. 3
Fig. 3
Cerebral malaria, axial SWI images ( A and B ) in two different patients shows diffuse petechial hemorrhages in bilateral cerebral hemispheres with the involvement of corpus callosum (malarial parasites were detected on microscopic examination of peripheral blood smear).
Fig. 4
Fig. 4
Dengue hemorrhagic fever, Axial FLAIR image ( A ) shows symmetrical hyperintense signal in bilateral frontoparietal white matter and right frontal gray matter. Axial SWI images ( B, C ) show multiple macrobleeds and microbleeds in bilateral frontal and left parietal posterior temporal lobe. (Diagnosis was confirmed by positive dengue serology).
Fig. 5
Fig. 5
Scrub typhus, axial SWI images ( A, B ) shows diffuse petechial and few microhemorrhages in bilateral cerebral hemispheres also involving internal capsule and corpus callosum. Axial T2 images ( C ) appear essentially normal (diagnosis was confirmed by positive scrub typhus serology).
Fig. 6
Fig. 6
H1N1 encephalitis, axial SWI image ( A ) shows symmetrical hyperintense areas in bilateral thalamus with a peripheral rim of a dark signal representing hemosiderin, axial SWI image ( B ) shows petechial hemorrhages in the left parieto-temporal region along the left lateral ventricle (arrow). Axial T1 ( C ) and T2 ( D ) images show same areas showing hyperintense signal on both T1 and T2 weighted images representing late subacute hemorrhage (diagnosis was confirmed by positive H1N1 serology).
Fig. 7
Fig. 7
Case of primary angiitis of the central nervous system, axial FLAIR images ( A, B ) abnormal areas with the hyperintense signal in right temporoparietal region predominantly involving subcortical white matter. Axial SWI images ( C, D ) show multiple microhemorrhages and linear streaky peri-vascular hemorrhages in involved areas. Axial contrast images ( E, F ) shows multiple linear and punctate enhancement in the right frontoparietal and left parietal region (diagnosis confirmed at brain biopsy).
Fig. 8
Fig. 8
Idiopathic thrombocytopenic purpura axial SWI image ( A ) shows multiple microhemorrhages in bilateral frontal lobes and left subdural hematoma (arrow). Axial FLAIR image ( B ) fails to demonstrate microhemorrhage, however, left subdural hematoma is seen (arrow). (diagnosis confirmed at bone marrow study).
Fig. 9
Fig. 9
Case of acute hypertensive bleed, axial T2 image ( A ) shows a fairly large area of hypointense signal centered on right ganglia-thalamic region causing mass effect over right lateral ventricle. Axial SWI image ( B ) demonstrate “blooming” with the extension of bleed in lateral ventricle, which is not very much apparent on T2 image.
Fig. 10
Fig. 10
Chronic hypertensive encephalopathy, axial SWI image ( A ) shows multiple micro-hemorrhages centered on bilateral thalamus (black arrow) with macro- hemorrhages in bilateral basal ganglia (yellow arrows). Axial SWI images ( B, C ) in a different patient show micro-hemorrhages in right basal ganglia and brain stem (black arrows) and old macro-hemorrhage in left basal ganglia.
Fig. 11
Fig. 11
Posterior reversible encephalopathy, axial SWI images ( A, B ) show multiple petechial hemorrhages in right posterior temporal and bilateral cerebellar hemispheres posteriorly (arrows). Axial FLAIR images ( C, D ) show symmetrical abnormal hyperintense signal bilateral posterior temporal, parietal and cerebellar hemispheres.
Fig. 12
Fig. 12
Cerebral amyloid angiopathy, axial SWI image shows ( A ) large macrobleed in the right frontal region (arrow) with extensive microbleeds in bilateral cerebral hemispheres. Axial T1 ( B ) and T2 ( C ) images show clearly shows a late subacute macrobleed in the right frontal lobe, however, except a few microbleeds which are clearly seen on SWI image are not seen.
Fig. 13
Fig. 13
Cerebral autosomal dominant arteriopathy with subcortical infarct and leukoencephalopathy, axial SWI images ( A, B ) show micro hemorrhage in left subcortical white matter and pons. Axial T2 ( C ) and FLAIR ( D ) images show symmetrical hyperintense signal in bilateral periventricular and subcortical white matter with typical involvement of subinsular region (arrow).

Similar articles

Cited by

References

    1. Haacke E M, Mittal S, Wu Z, Neelavalli J, Cheng Y C. Susceptibility-weighted imaging: technical aspects and clinical applications, part 1. Am J Neuroradiol. 2009;30(01):19–30. - PMC - PubMed
    1. Chavhan G B, Babyn P S, Thomas B, Shroff M M, Haacke E M. Principles, techniques, and applications of T2*-based MR imaging and its special applications. Radiographics. 2009;29(05):1433–1449. - PMC - PubMed
    1. Mittal S, Wu Z, Neelavalli J, Haacke E M. Susceptibility-weighted imaging: technical aspects and clinical applications, part 2. Am J Neuroradiol. 2009;30(02):232–252. - PMC - PubMed
    1. Sood S, Gupta R, Modi J, Sharma J.Susceptibility weighted imaging: physics and clinical applications in neuroimaging at 3 Tesla. Conference PaperMarch201410.1594/ecr2014/C-1472 - DOI
    1. Lee Y J, Lee S, Jang J. Findings regarding an intracranial hemorrhage on the phase image of a susceptibility-weighted image (SWI), according to the stage, location, and size. Investig Magn Reson Imaging. 2015;19(02):107–113.