. 2023 Mar;13(3):e1203.
doi: 10.1002/ctm2.1203.

Single-cell transcriptomic analysis deciphers key transitional signatures associated with oncogenic evolution in human intramucosal oesophageal squamous cell carcinoma

Affiliations

Single-cell transcriptomic analysis deciphers key transitional signatures associated with oncogenic evolution in human intramucosal oesophageal squamous cell carcinoma

Xin-Yang Liu et al. Clin Transl Med. 2023 Mar.

Abstract

Background and aims: The early diagnosis and intervention of oesophageal squamous cell carcinoma (ESCC) are particularly important because of the lack of effective therapies and poor prognosis. Comprehensive research on early ESCC at the single-cell level is rare due to the need for fresh and high-quality specimens obtained from ESD. This study aims to systematically describe the cellular atlas of human intramucosal ESCC.

Methods: Five paired samples of intramucosal ESCC, para-ESCC oesophageal tissues from endoscopically resected specimens and peripheral blood mononuclear cells were adopted for scRNA-seq analysis. Computational pipeline scMetabolism was applied to quantify the metabolic diversity of single cells.

Results: A total of 164 715 cells were profiled. Epithelial cells exhibited high intra-tumoural heterogeneity and two evolutionary trajectories during ESCC tumorigenesis initiated from proliferative cells, and then through an intermediate state, to two different terminal states of normally differentiated epithelial cells or malignant cells, respectively. The abundance of CD8+ TEX s, Tregs and PD1+ CD4+ T cells suggested an exhausted and suppressive immune microenvironment. Several genes in immune cells, such as CXCL13, CXCR5 and PADI4, were identified as new biomarkers for poor prognosis. A new subcluster of malignant cells associated with metastasis and angiogenesis that appeared at an early stage compared with progressive ESCC was also identified in this study. Intercellular interaction analysis based on ligand-receptor pairs revealed the subcluster of malignant cells interacting with CAFs via the MDK-NCL pathway, which was verified by cell proliferation assay and IHC. This indicates that the interaction may be an important hallmark in the early change of tumour microenvironment and serves as a sign of CAF activation to stimulate downstream pathways for facilitating tumour invasion.

Conclusion: This study demonstrates the changes of cell subsets and transcriptional levels in human intramucosal ESCC, which may provide unique insights into the development of novel biomarkers and potential intervention strategies.

Keywords: intramucosal; oesophageal squamous cell carcinoma; single-cell RNA-seq; tumour microenvironment.


Conflict of interest statement

The authors declare no conflict of interest.

Figures

FIGURE 1
FIGURE 1
scRNA‐Seq profiling of the human intramucosal ESCC microenvironment. (A) Workflow depicting sample collection, single‐cell preparation and RNA‐seq. (B) t‐SNE plot displaying main cell types in human intramucosal ESCC microenvironment. (C) Bubblemap displaying the top 10 SDE genes in each cell type, both colour and size indicate the effect size. (D) Distribution of cells in different specimens. (E) Distribution of cells in different patients. (F) B cell percentage in early and progressive ESCC patients (** indicates a p value < .01). ESCC: oesophageal squamous cell carcinoma; ESD: endoscopic submucosal resection; PBMCs: peripheral blood mononuclear cells; t‐SNE: t‐distributed stochastic neighbour embedding.
FIGURE 2
FIGURE 2
The single‐cell transcriptomes of epithelial cells in human intramucosal ESCC. (A) t‐SNE plot revealing the seven epithelial cell subclusters. (B) Distribution of epithelial cells in paratumour and tumour specimen revealed by t‐SNE plot. (C) Cell number percentage of seven subclusters in different specimen. (D) GO analysis for E1–E7 subclusters. (E) Violin plot showing important markers of E1–E7 subclusters. (F) Distribution of seven subclusters in different patients, with E7 absent in patient 3. (G) CNV profiles showing a relative variation between epithelial cells originated from tumour and paratumour specimen after Bayes normalisation. (H) Psudotome analysis revealing trajectory paths of intramucosal ESCC initiation. (I) t‐SNE plot showing gene expression in sphingolipid metabolism pathways of E7 subcluster. ESCC: oesophageal squamous cell carcinoma; t‐SNE: t‐distributed stochastic neighbour embedding; GO: Gene Ontology; CNV: copy number variation.
FIGURE 3
FIGURE 3
Characreristics of epithelial cells in human intramucosal ESCC. (A) Dotplot showing metabolic characteristics of seven subclusters, both colour and size indicate the effect size. (B) Correlation between the 24 representing metabolic pathways and phenotypic scores of E7 subcluster (* indicates a p value < .05 and ** < .01). (C) GO analysis for progressive ESCC compared with E1–E7 subclusters. (D) Dotplot showing similarities and differences between early and progressive ESCC. ESCC: oesophageal squamous cell carcinoma; GO: Gene Ontology.
FIGURE 4
FIGURE 4
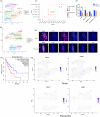
Exhausted T cells and suppressive immune microenvironment in human intramucosal ESCC. (A,B) t‐SNE plots revealing T cell subclusters in tumour specimens (A) and paratumour specimens (B). (C) Dotplot showing important markers of T cell subclusters, both colour and size indicate the effect size. (D) Distribution of T cell subclusters in different specimens (* indicates a p value < .05). (E) Immunostaining for FOXP3, CD4, CD8 and CD3 showing the distribution of FOXP3+ cells in tumour and paratumour tissues of early ESCC patients. (F) Kaplan–Meier analysis showing overall survival of the top 20 PD1+CD4+ T cells markers in ESCC patients. (G) CXCL13 and CXCR5 expression in PD1+CD4+T cells shown by t‐SNE plots. ESCC: oesophageal squamous cell carcinoma; t‐SNE: t‐distributed stochastic neighbour embedding.
FIGURE 5
FIGURE 5
Characterisation of myeloid cell subpopulations. (A) t‐SNE plot showing seven monocyte/macrophage cell subclusters. (B) Violin plots showing gene signatures of MM cell subclusters. (C) Kaplan–Meier analysis showing overall survival of PADI4 in ESCC patients. (D) t‐SNE plot showing dentric cell subclusters. (E) heatmap showing important gene signatures of DC subclusters. (F) Distribution of DC subclusters in different specimens. (G) Violin plots showing immune‐relevant genes expressed by LAMP3+ DCs. (F) Cell number percentage in different specimens. ESCC: oesophageal squamous cell carcinoma; t‐SNE: t‐distributed stochastic neighbour embedding; MM: monocyte/macrophage; DC: dendritic cells.
FIGURE 6
FIGURE 6
Distinct fibroblast subpopulations in human intramucosal ESCC ecosystem. (A) t‐SNE plotshowing five subclusters of cancer‐associated fibroblasts. (B) Violin plot showing important gene signatures expressed by all the five CAF subclusters collectively. (C) Dotplot showing important gene signatures of CAF subclusters respectively, both colour and size indicate the effect size. (D) GO analysis for CAF subclusters. (E) Distribution of CAF subcusters in different specimens. (F) Dotplot showing important gene signatures of CAFs derived from tumour and paratumour specimens. (G) GO analysis for CAF derived from tumour and paratumour specimens. ESCC: oesophageal squamous cell carcinoma; t‐SNE: t‐distributed stochastic neighbour embedding; CAF: cancer‐associated fibroblast; GO: Gene Ontology.
FIGURE 7
FIGURE 7
Altered crosstalk between subclusters in human intramucosal ESCC. (A) Circos plots showing crosstalk between T cell and CAF subclusters. (B) Circos plots showing crosstalk between epithelial cells and CAF subclusters. (C) Circos plots showing crosstalk between T cell and epithelial cell subclusters. (D) Dotplot showing upregulated and downregulated interactions between epithelial cells and CAF subclusters. (E) Expression level of MDK, NCL and LRP1 in human oesophageal cancer and paratumour specimen, data from GEPIA. (F) Correlation analyses between MDK and NCL, and between MDK and LRP1, data from GEPIA. (G) Schematic illustration of intercellular crosstalk between early ESCC cells and CAFs. (H) CCK‐8 assays were conducted to determine the function of MDK–NCL on proliferation capabilities. Proliferation of CAFs was significantly promoted by the stimulation of tumour supernatant and the alteration could be rescued by iMDK. (I) Knockdown on NCL protein levels in d042 cell lines transfected with NC and siNCL. (J) CCK‐8 assays were conducted to determine the function of MDK–NCL on proliferation capabilities. Knockdown of NCL reversed the tumour supernatants stimulation to CAFs proliferation. (K) HE staining and IHC in ESCC specimen of paratumour specimen, high grade intraepithelial neoplasia, intramucosal ESCC and progressive ESCC. All data are presented as mean ± SD and all the experiments were repeated three times. Data were analysed by unpaired t‐test. * p < .05, ** p < .01, *** p < .001. ESCC: oesophageal squamous cell carcinoma; CAF: cancer‐associated fibroblast; GO: Gene Ontology; GEPIA: Gene Expression Profiling Interactive Analysis; HE: hematoxylin–eosin; IHC: immunohistochemistry.
FIGURE 7
FIGURE 7
Altered crosstalk between subclusters in human intramucosal ESCC. (A) Circos plots showing crosstalk between T cell and CAF subclusters. (B) Circos plots showing crosstalk between epithelial cells and CAF subclusters. (C) Circos plots showing crosstalk between T cell and epithelial cell subclusters. (D) Dotplot showing upregulated and downregulated interactions between epithelial cells and CAF subclusters. (E) Expression level of MDK, NCL and LRP1 in human oesophageal cancer and paratumour specimen, data from GEPIA. (F) Correlation analyses between MDK and NCL, and between MDK and LRP1, data from GEPIA. (G) Schematic illustration of intercellular crosstalk between early ESCC cells and CAFs. (H) CCK‐8 assays were conducted to determine the function of MDK–NCL on proliferation capabilities. Proliferation of CAFs was significantly promoted by the stimulation of tumour supernatant and the alteration could be rescued by iMDK. (I) Knockdown on NCL protein levels in d042 cell lines transfected with NC and siNCL. (J) CCK‐8 assays were conducted to determine the function of MDK–NCL on proliferation capabilities. Knockdown of NCL reversed the tumour supernatants stimulation to CAFs proliferation. (K) HE staining and IHC in ESCC specimen of paratumour specimen, high grade intraepithelial neoplasia, intramucosal ESCC and progressive ESCC. All data are presented as mean ± SD and all the experiments were repeated three times. Data were analysed by unpaired t‐test. * p < .05, ** p < .01, *** p < .001. ESCC: oesophageal squamous cell carcinoma; CAF: cancer‐associated fibroblast; GO: Gene Ontology; GEPIA: Gene Expression Profiling Interactive Analysis; HE: hematoxylin–eosin; IHC: immunohistochemistry.

References

    1. Sung H, Ferlay J, Siegel RL, et al. Global Cancer Statistics 2020: gLOBOCAN estimates of incidence and mortality worldwide for 36 cancers in 185 countries. CA Cancer J Clin. 2021;71(3):209‐249. - PubMed
    1. Lin Y, Totsuka Y, He Y, et al. Epidemiology of esophageal cancer in Japan and China. J Epidemiol. 2013;23(4):233‐242. - PMC - PubMed
    1. Zhang Y, Ding H, Chen T, et al. Outcomes of endoscopic submucosal dissection vs esophagectomy for T1 esophageal squamous cell carcinoma in a real‐world cohort. Clin Gastroenterol Hepatol. 2019;17(1):73‐81.e3. - PubMed
    1. Oppedijk V, van der Gaast A, van Lanschot JJ, et al. Patterns of recurrence after surgery alone versus preoperative chemoradiotherapy and surgery in the CROSS trials. J Clin Oncol. 2014;32(5):385‐391. - PubMed
    1. Berry MF. Esophageal cancer: staging system and guidelines for staging and treatment. J Thorac Dis. 2014;6(3):S289‐97. Suppl. - PMC - PubMed

Publication types

MeSH terms