

Physiologically based pharmacokinetic modeling for development and applications of a virtual celiac disease population using felodipine as a model drug
- PMID: 36855819
- PMCID: PMC10272307
- DOI: 10.1002/psp4.12954
Physiologically based pharmacokinetic modeling for development and applications of a virtual celiac disease population using felodipine as a model drug
Abstract
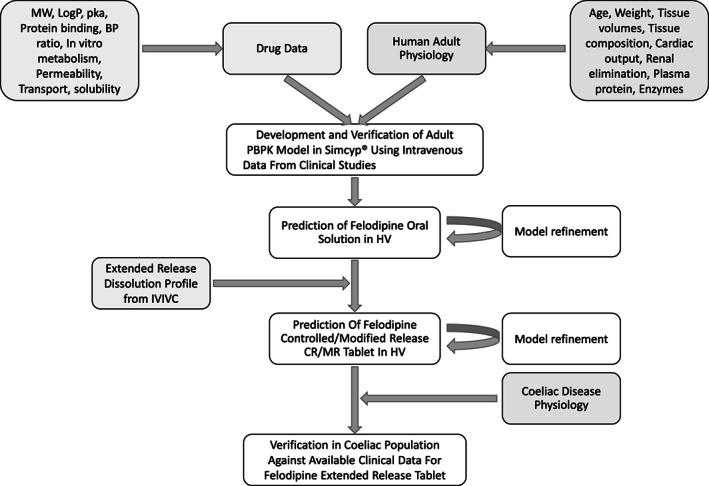
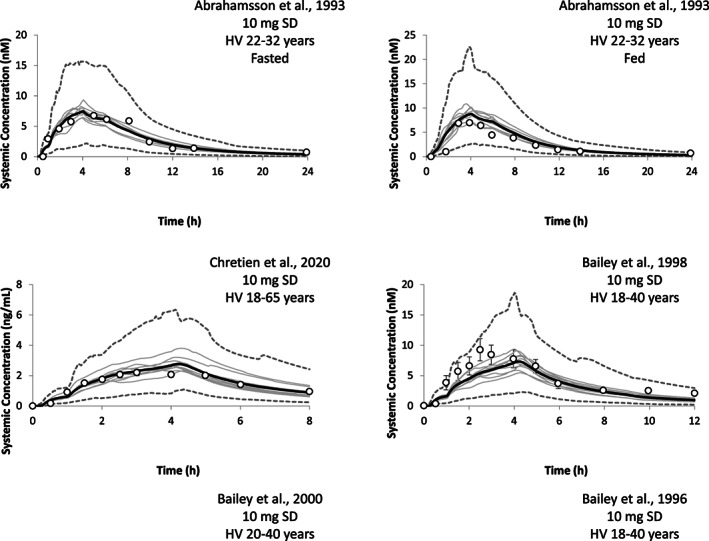
In celiac disease (CeD), gastrointestinal CYP3A4 abundance and morphology is affected by the severity of disease. Therefore, exposure to CYP3A4 substrates and extent of drug interactions is altered. A physiologically-based pharmacokinetic (PBPK) population for different severities of CeD was developed. Gastrointestinal physiology parameters, such as luminal pH, transit times, morphology, P-gp, and CYP3A4 expression were included in development of the CeD population. Data on physiological difference between healthy and CeD subjects were incorporated into the model as the ratio of celiac to healthy. A PBPK model was developed and verified for felodipine extended-release tablet in healthy volunteers (HVs) and then utilized to verify the CeD populations. Plasma concentration-time profile and PK parameters were predicted and compared against those observed in both groups. Sensitivity analysis was carried out on key system parameters in CeD to understand their impact on drug exposure. For felodipine, the predicted mean concentration-time profiles and 5th and 95th percentile intervals captured the observed profile and variability in the HV and CeD populations. Predicted and observed clearance was 56.9 versus 56.1 (L/h) in HVs. Predicted versus observed mean ± SD area under the curve for extended release felodipine in different severities of CeD were values of 14.5 ± 9.6 versus 14.4 ± 2.1, 14.6 ± 9.0 versus 17.2 ± 2.8, and 28.1 ± 13.5 versus 25.7 ± 5.0 (ng.h/mL), respectively. Accounting for physiology differences in a CeD population accurately predicted the PK of felodipine. The developed CeD population can be applied for determining the drug concentration of CYP3A substrates in the gut as well as for systemic levels, and for application in drug-drug interaction studies.
© 2023 The Authors. CPT: Pharmacometrics & Systems Pharmacology published by Wiley Periodicals LLC on behalf of American Society for Clinical Pharmacology and Therapeutics.
Conflict of interest statement
The authors declared no competing interests for this work.
Figures


Similar articles
-
PBPK modeling: What is the role of CYP3A4 expression in the gastrointestinal tract to accurately predict first-pass metabolism?CPT Pharmacometrics Syst Pharmacol. 2025 Jan;14(1):130-141. doi: 10.1002/psp4.13249. Epub 2024 Oct 2. CPT Pharmacometrics Syst Pharmacol. 2025. PMID: 39359052 Free PMC article.
-
Physiologically based pharmacokinetic modeling and simulation to predict drug-drug interactions of ivosidenib with CYP3A perpetrators in patients with acute myeloid leukemia.Cancer Chemother Pharmacol. 2020 Nov;86(5):619-632. doi: 10.1007/s00280-020-04148-3. Epub 2020 Sep 25. Cancer Chemother Pharmacol. 2020. PMID: 32978634
-
Evaluation of Cytochrome P450 3A4-Mediated Drug-Drug Interaction Potential for Cobimetinib Using Physiologically Based Pharmacokinetic Modeling and Simulation.Clin Pharmacokinet. 2016 Nov;55(11):1435-1445. doi: 10.1007/s40262-016-0412-5. Clin Pharmacokinet. 2016. PMID: 27225997
-
Severity of coeliac disease and clinical management study when using a CYP3A4 metabolised medication: a phase I pharmacokinetic study.BMJ Open. 2020 Mar 4;10(3):e034086. doi: 10.1136/bmjopen-2019-034086. BMJ Open. 2020. PMID: 32139488 Free PMC article. Clinical Trial.
-
Physiologically based predictions of the impact of inhibition of intestinal and hepatic metabolism on human pharmacokinetics of CYP3A substrates.J Pharm Sci. 2010 Jan;99(1):486-514. doi: 10.1002/jps.21802. J Pharm Sci. 2010. PMID: 19479982
Cited by
-
Drug-Drug Interactions between COVID-19 and Tuberculosis Medications: A Comprehensive Review of CYP450 and Transporter-Mediated Effects.Pharmaceuticals (Basel). 2024 Aug 6;17(8):1035. doi: 10.3390/ph17081035. Pharmaceuticals (Basel). 2024. PMID: 39204140 Free PMC article. Review.
-
Proteomic analysis of plasma and duodenal tissue in celiac disease patients reveals potential noninvasive diagnostic biomarkers.Sci Rep. 2024 Dec 2;14(1):29872. doi: 10.1038/s41598-024-80391-5. Sci Rep. 2024. PMID: 39622892 Free PMC article.
References
-
- Singh P, Arora A, Strand TA, et al. Global prevalence of celiac disease: systematic review and meta‐analysis. Clin Gastroenterol Hepatol. 2018;16:823‐36.e2. - PubMed
-
- NICE. (National Institue for Health and Care Excellence) Coeliac disease . https://bnf.nice.org.uk/treatment‐summary/coeliac‐disease.html. Accessed 06/01/2022 2022.
-
- Wang I, Hopper I. Celiac disease and drug absorption: implications for cardiovascular therapeutics. Cardiovasc Ther. 2014;32:253‐256. - PubMed
-
- Kitis G, Lucas ML, Bishop H, et al. Altered jejunal surface pH in coeliac disease: its effect on propranolol and folic acid absorption. Clin Sci (Lond). 1982;63:373‐380. - PubMed
MeSH terms
Substances
LinkOut - more resources
Full Text Sources
Medical
Miscellaneous
