

A circuit for secretion-coupled cellular autonomy in multicellular eukaryotic cells
- PMID: 36856068
- PMCID: PMC10090951
- DOI: 10.15252/msb.202211127
A circuit for secretion-coupled cellular autonomy in multicellular eukaryotic cells
Abstract
Cancers represent complex autonomous systems, displaying self-sufficiency in growth signaling. Autonomous growth is fueled by a cancer cell's ability to "secrete-and-sense" growth factors (GFs): a poorly understood phenomenon. Using an integrated computational and experimental approach, here we dissect the impact of a feedback-coupled GTPase circuit within the secretory pathway that imparts secretion-coupled autonomy. The circuit is assembled when the Ras-superfamily monomeric GTPase Arf1, and the heterotrimeric GTPase Giαβγ and their corresponding GAPs and GEFs are coupled by GIV/Girdin, a protein that is known to fuel aggressive traits in diverse cancers. One forward and two key negative feedback loops within the circuit create closed-loop control, allow the two GTPases to coregulate each other, and convert the expected switch-like behavior of Arf1-dependent secretion into an unexpected dose-response alignment behavior of sensing and secretion. Such behavior translates into cell survival that is self-sustained by stimulus-proportionate secretion. Proteomic studies and protein-protein interaction network analyses pinpoint GFs (e.g., the epidermal GF) as key stimuli for such self-sustenance. Findings highlight how the enhanced coupling of two biological switches in cancer cells is critical for multiscale feedback control to achieve secretion-coupled autonomy of growth factors.
Keywords: G proteins; Golgi secretion; cellular autonomy; dose-response alignment (DoRA); epidermal growth factor receptor (EGFR).
© 2023 The Authors. Published under the terms of the CC BY 4.0 license.
Conflict of interest statement
The authors declare that they have no conflict of interest.
Figures
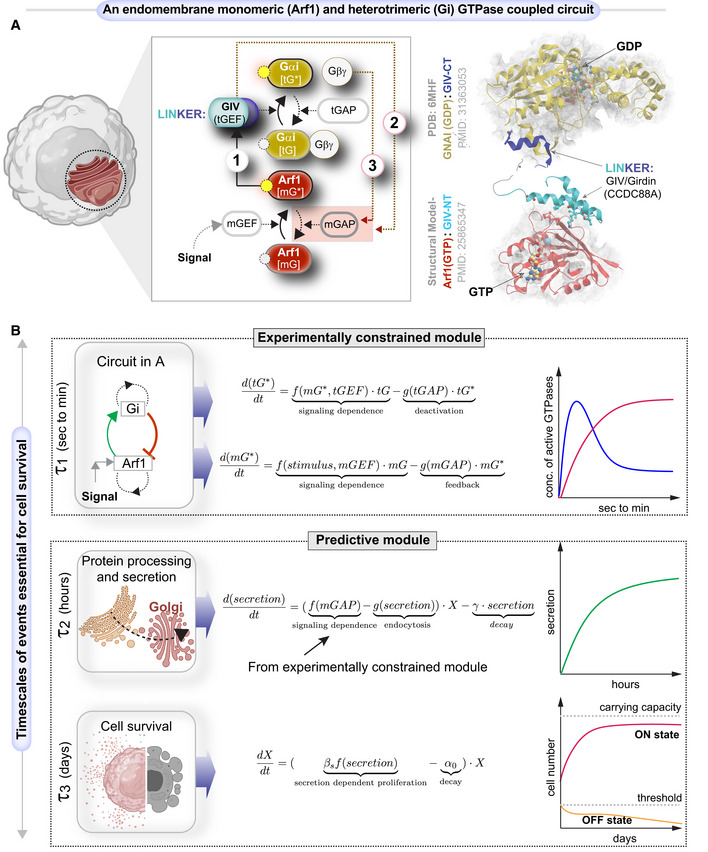
Schematic shows a system of two species of GTPases, mGTPases (mG), and heterotrimeric GTPases (tG), coupled by the linker protein, GIV/Girdin, that is localized on the Golgi membranes within the secretory pathway as the focus of this study. The circuit begins when active Arf1‐GTP directly binds GIV's N‐term HOOK domain, recruits GIV to Golgi membranes, and activates Gi (Lo et al, ; arrow 1). The circuit is completed when GIV's C‐terminus orchestrates two feedback loops (arrows 2 and 3), both of which are essential for the inactivation of Arf1 (Lo et al, ; Kalogriopoulos et al, 2019). See also Fig EV1 for illustrations detailing the sequential steps within the dynamic nature of the motif, and Movie EV1 for the visualization of these dynamic steps as a movie gif.
Schematic of the mathematical model that we used to study the role of such coupling of GTPase (top panel) in autocrine secretion‐supported cell survival and proliferation (bottom panel). The modeling in the top panel is experimentally constrained, and the modeling in the bottom panel is a predictive module. This model is based on the nominal time scale of these events (left panel) and has the typical behavior shown in the right panel.
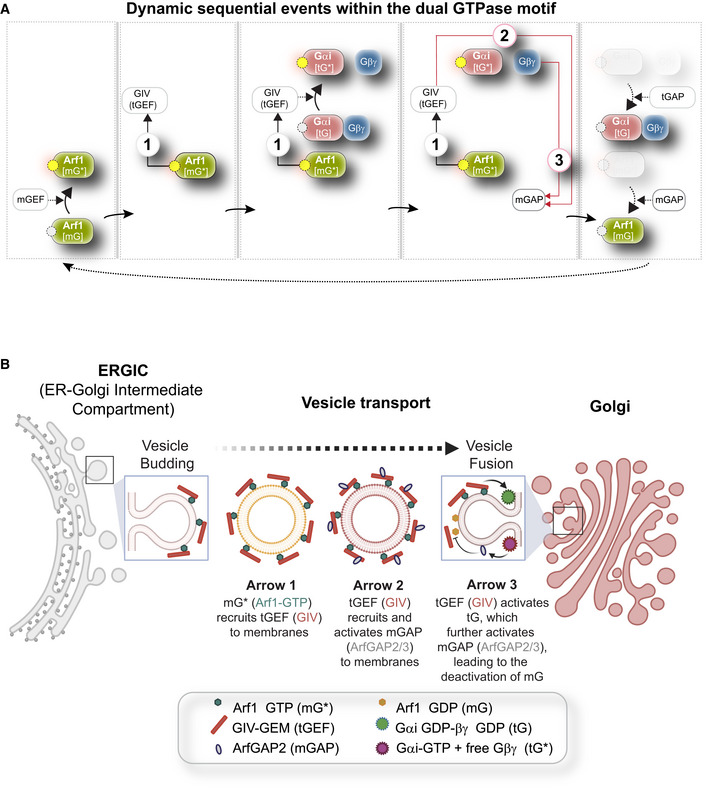
Dynamics within the endomembrane GTPase system. Left to right panels display the deconstructed arrows denoting key molecular events/chemical reaction cascades within this system, in which, the GIV‐GEM links the monomeric (m) and trimeric (t) GTPase systems and enables the conversion of extracellular stimulus (ligand; left) into membrane trafficking events (e.g., vesicle uncoating/budding/fusion; right). The forward and feedback reactions (arrows) are numbered 1–3. See Movie EV1 for a gif of the circuit.
Schematic summarizing the findings reported by Lo et al (2015) delineating how arrows 1–3 within the endomembrane GTPase system regulate the finiteness of Arf1 signaling for efficient secretion.
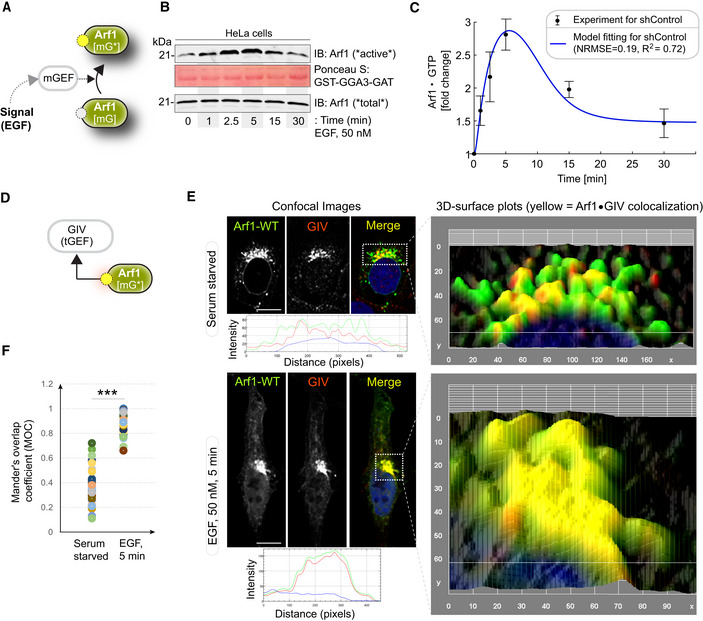
Schematic showing the specific step being interrogated in panels (B, C), that is, Arf1 activation under EGF stimulation.
Immunoblot shows GST‐GGA‐GAT domain bound Arf1 (active; top) and total Arf1 (input lysates; bottom) from equal aliquots of lysates of HeLa cells that were stimulated with EGF for the indicated time points prior to lysis.
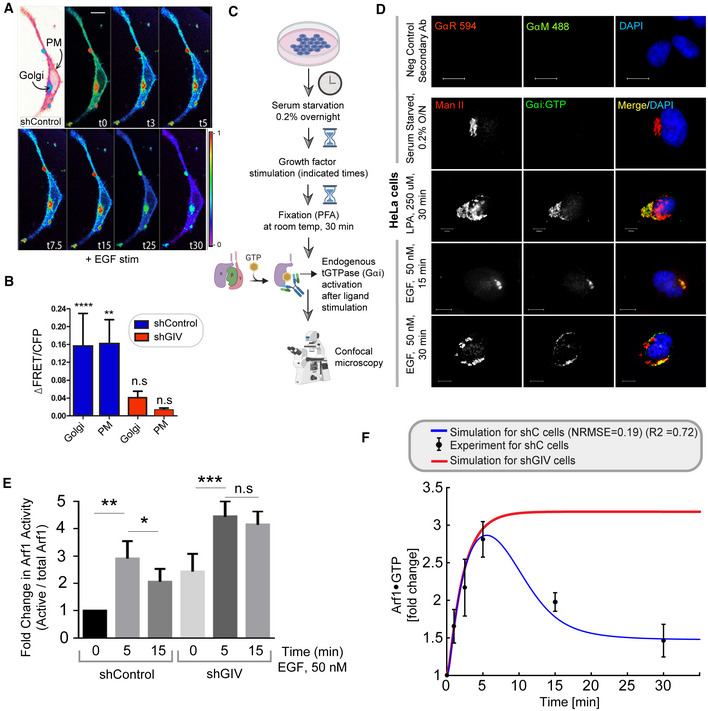
Graphs display the model fitting for Arf1 activation dynamics. The experimentally determined Arf1 activation (in B) dynamics are displayed as black dots with error bars, representing mean ± SEM (n = 3 biological replicates), and numerical simulation is shown by the blue continuous line.
Schematic showing the specific step being interrogated in panels (E, F), that is, recruitment of GIV‐GEM on Golgi.
HeLa cells expressing Arf1‐HA were serum starved overnight (E, top) and subsequently stimulated with EGF for 5 min (E, bottom) prior to fixation with PFA. Fixed cells were stained for Arf1 (HA; green) and GIV (red) and nuclei (DAPI; blue). Panels on the left show overlay of all three stains and representative RGB plots of sections through the Arf1‐stained pixels. Panels on the right display the magnified 3D surface plots of the boxed regions in the left panels. Scale bar = 10 μm.
Scatter plot shows the Mandler's overlap coefficient (MOC) for Arf1‐HA and GIV colocalization in (E) that was calculated on 13–15 cells/experiment, n = 3 independent experiments. P‐values were determined using Mann–Whitney t‐test: ***P = 0.0002.
- A
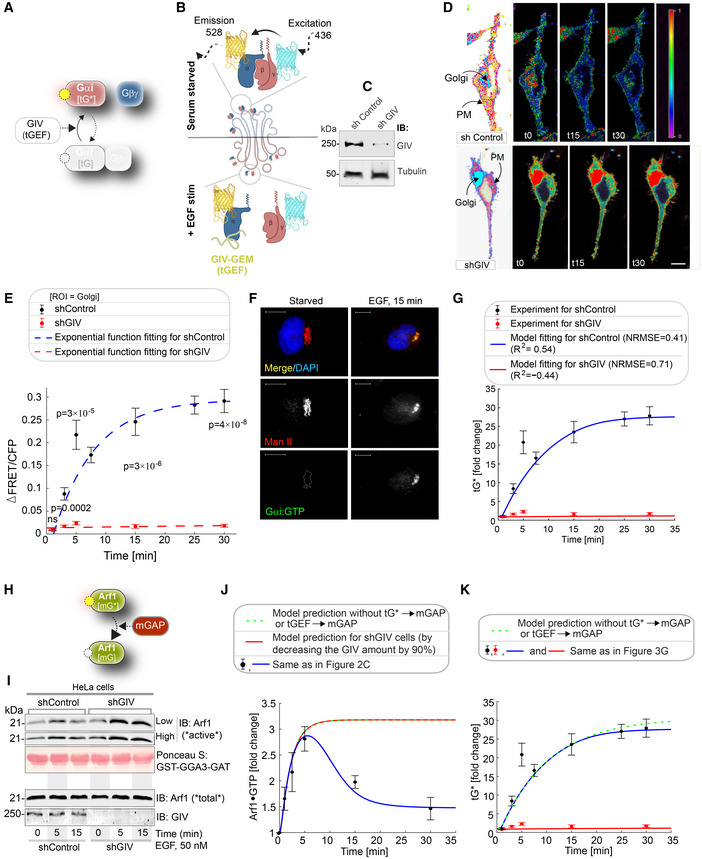
Schematic showing the specific step being interrogated in (B–G), that is, Gi activation.
- B
Schematic describing the mechanism of the FRET Gαi activity reporter. Serum‐starved conditions are expected to have more inactive trimeric Gi, and hence show high FRET (top). Upon ligand stimulation, GIV‐dependent dissociation of trimers is expected, with a resultant loss of intermolecular FRET.
- C
Equal aliquots (~45 μg) of whole cell lysates of control (shControl; top) and GIV‐GEM depleted (shGIV; bottom) HeLa cells were analyzed for GIV and tubulin (loading control) by immunoblotting (IB).
- D
Control (sh Control; top) and GIV‐GEM depleted (shGIV; bottom) HeLa cells were co‐transfected with Gαi1‐YFP, Gβ1‐CFP and Gγ2 (untagged), and live cells were analyzed by FRET imaging at steady state, after being serum starved in 0.2% FBS overnight and then after stimulation with 50 nM EGF. Representative freeze‐frame FRET images are shown. FRET image panels display intensities of acceptor emission due to efficient energy transfer in each pixel. The FRET scale is shown in the inset. Golgi and PM regions of interest are indicated with arrows. Scale bar = 10 μm. See also Fig EV2A and B for free‐frame images for additional time points in control HeLa cells.
- E
ΔFRET/CFP at the Golgi (derived from D) as a function of time. The data are represented as mean ± SEM. Interrupted lines display the fitting results using exponential functions for shControl (blue) and shGIV cells (red). Data represent five regions of interest (ROIs) analyzed over the pixels corresponding to the Golgi of 3–5 cells from two independent biological experiments, that is, n = 8 biological replicates. P‐values, as determined against t0 using Mann–Whitney are displayed.
- F
HeLa cells starved with 0.2% FBS overnight or stimulated subsequently with 50 nM EGF were fixed and stained for active Gαi (green; anti‐Gαi:GTP mAb) and Man II (red) and analyzed by confocal microscopy. Activation of Gαi was detected exclusively after EGF stimulation. When detected, active Gαi colocalizes with Man II (yellow pixels in merge panel). See also Fig EV2C and D for additional time points and stimulus. Scale bar = 7.5 μm.
- G
Model fit for the fold change of active tGTPase (denoted as tG*). Experiment data are the fold change of ΔFRET/CFP in (D) and is shown as mean ± SEM (n = 8; 3–5 cells from two independent biological experiments). Continuous lines display the model simulation results after parameter fitting (See Table EV1 for parameters).
- H
Schematic shows the step being interrogated in (I–K), that is, the termination of Arf1 signaling.
- I
Immunoblot shows bound Arf1 (active; top) and total Arf1 (input lysates; bottom) from equal aliquots of lysates of control (sh Control) and GIV‐depleted (shGIV) HeLa cells. Cells were stimulated with EGF for the indicated time points prior to lysis. Bar graphs in Fig EV2E display the fold change in Arf1 activity normalized to t0 min. “Low” and “high” indicate exposures.
- J, K
Model predictions of Arf1 activation dynamics (J) and Gαi activation dynamics (K) when negative feedback do not exist. The depletion of negative feedback in the model is achieved by deleting either or (interrupted green line). These two depletion ways have no difference due to AND gate logic; please see also Fig EV3 for model predictions using OR logic. The red line in (J) was obtained by setting the GIV amount to 10% of the control cell, matching the low concentration of GIV in shGIV cells. As a reference, the experimental data (i.e., error bars in black and red) and model fit results (curves in blue and red) in Figs 2C and 3G are also displayed here, which were plotted in a same way as in Figs 2C and 3G.
FRET‐based studies were carried out in sh Control cells as in Fig 3B and C. Briefly, HeLa cells were co‐transfected with Gαi1‐YFP, Gβ1‐CFP and Gγ2 (untagged), and live cells were analyzed by FRET imaging at steady state, after being serum starved in 0.2% FBS overnight and then after stimulation with 50 nM EGF. Representative freeze‐frame FRET images are shown. FRET image panels display intensities of acceptor emission due to efficient energy transfer in each pixel. The FRET scale is shown in the inset. Golgi and PM regions of interest are indicated with arrows. Scale bar = 10 μm.
Bar graphs display the change in FRET at t5 min at the Golgi and the PM regions of 3–5 cells, from four independent biological replicates. Scale bar = 7.5 μm. Results are displayed as mean ± SEM. Statistical significance was determined by student t‐test and the P‐values are depicted as: **P < 0.01; ****P < 0.0001.
Schematic showing how a conformation‐specific anti‐Gαi·GTP antibody detects GTP‐bound active Gαi in situ.
HeLa cells starved with 0.2% FBS overnight or stimulated subsequently with 50 nM EGF or 250 μM LPA were fixed and stained for active Gαi (green; anti‐Gαi:GTP mAb) and Man II (red) and analyzed by confocal microscopy. Activation of Gαi was detected exclusively after LPA/EGF stimulation. When detected, active Gαi colocalizes with Man II (yellow pixels in merge panel). Negative control (secondary antibody) staining was carried out on cells stimulated with EGF, 15 min. Scale bar = 10 μm.
Control (sh Control) and GIV‐depleted (shGIV) HeLa cells that were stimulated with EGF for the indicated time points prior to lysis were assessed for Arf1 activity. Immunoblots are shown in Fig 3I. Bar graphs display the fold change in Arf1 activity normalized to t0 min that was observed in control (shControl) and GIV‐depleted (shGIV) cells. Results are expressed as mean ± SEM; n = 3 biological replicates; P‐values were determined using Mann–Whitney t‐test compared to t0: *P < 0.05; **P < 0.01; ***P < 0.001. Immunoblots are representative of findings from at least three independent repeats.
Line graph in red displays a model‐derived simulation of Arf1 activation dynamics (mG*) in cells without tGEF (shGIV). As a reference, the results of model‐derived simulation fit to experimental data in control cells are displayed in blue, and the experimental data for Arf1 activation dynamics are shown as mean ± SEM (n = 3 biological replicates).
- A
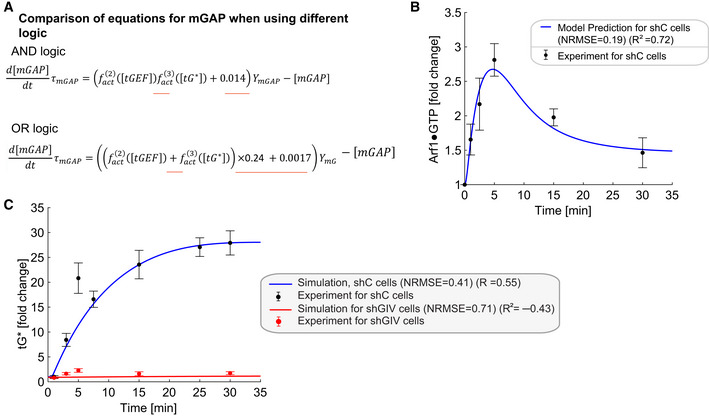
Comparisons of equations for mGAP when using different logics. The AND and OR logic are modeled by and , respectively. The constants 0.24 and 0.0017 ensure that the steady‐state values of all species when using OR logic are the same as those for AND logic. The differences between the two models are underlined in red in the equations.
- B, C
Simulations of Arf1 (B) and Gi (C) activation dynamics for OR logic. The OR logic also captures the experimental data reasonably well but the AND logic is better informed experimentally. The experimental data are the same as those in Fig 3J and K.
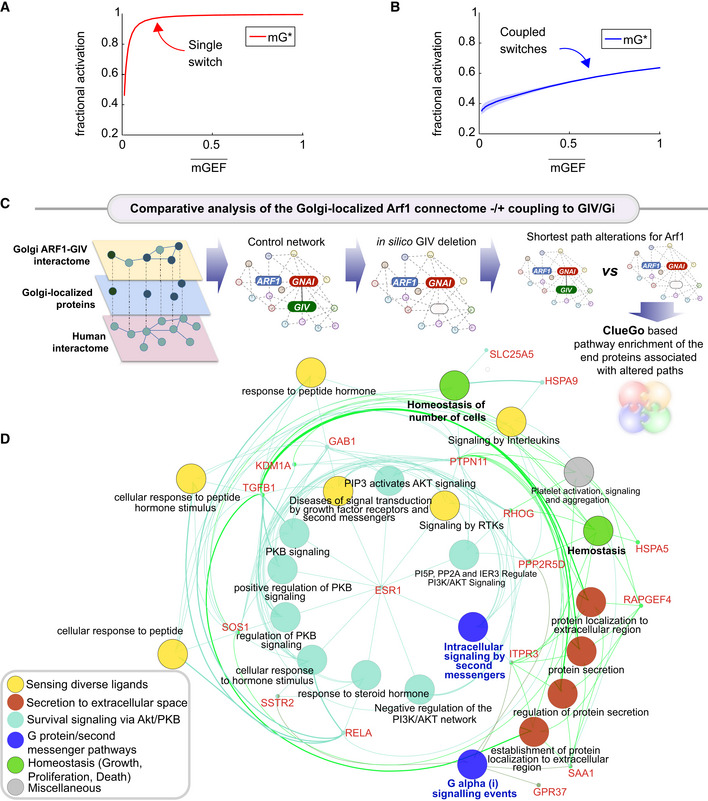
- A, B
Fractional activations of mGEF vs. active Arf1 (mG*) for the single switch (A; mG alone) and coupled switches (B; mG and tG). We perform stochastic simulations in the presence of noise in EGF (see Materials and Methods for details). The mean and the standard deviation (SD) of species are evaluated at steady states based on 1,000 repeated independent simulations of ODEs in the presence of noise. denotes the mean of mGEF; the shading shows the SD. The dimensionless EGF concentrations in the simulations are obtained through normalization, that is, dividing the EGF concentration by 217.4 nM (=50 nM/0.23). In all simulations, noise is introduced only in stimulus (i.e., EGF).
-
C, D A comparative analysis of the Golgi‐localized Arf1 (
mG ) connectome with/without coupling toGIV (tGEF ) and Gi (tGTPase ). Workflow (C) shows how the list of Golgi‐localized Arf1 andGIV interacting proteins (Appendix Fig S1and Dataset EV1) were used as “seeds” to construct aPPI network from theSTRING database to fetch the linking nodes to connect the seed proteins. The network was then perturbed by in silico deletion ofGIV , followed by a topological analysis of how such perturbation impacts the shortest paths associated with Arf1 to all other nodes in the network (see Materials and Methods). A network representation (D) using theClueGo algorithm of the cellular processes associated with the end proteins that were most frequently encountered in the most impacted shortest paths associated with Arf1 (listed in Appendix Fig S2E ). The deleted or newly added shortest paths were only considered using the differential network approach (see Materials and Methods). The key in the lower left corner displays the color code of various overarching themes encountered in the network.
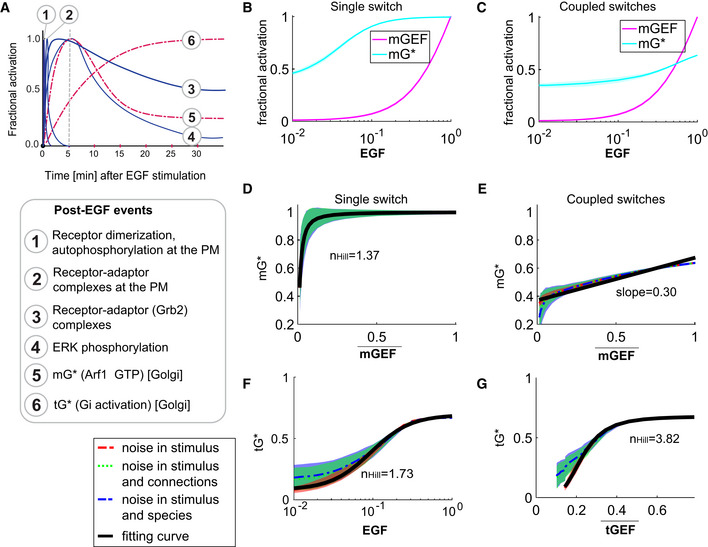
- A
Published dynamics of EGF‐stimulated events that are initiated at the PM (blue, continuous) or experimentally determined dynamics of events at the Golgi confirmed here (red, interrupted) are compared. The interrupted line at 5 min provides a reference frame for the observed peak Arf1 activity upon EGF stimulation.
- B, C
Dose responses of fractional activations of mGEF and active Arf1 (mG*) for the single switch (B; mG alone) and coupled switches (C; mG and tG). We perform stochastic simulations in the presence of noise in EGF (see Materials and Methods for details). The mean and the standard deviation (SD) of species are evaluated at steady states. The dimensionless EGF concentrations in the simulations are obtained through normalization, that is, dividing the EGF concentration by 217.4 nM (=50 nM/0.23). In all simulations, noise is introduced only in stimulus (i.e., EGF).
- D, E
The same plots as in Fig 4A and B but in the presence of three different types of noise: noise in stimulus (shown in red), noise in stimulus and connections simultaneously (shown in green), and noise in stimulus and species simultaneously (shown in blue; see Materials and Methods for details). Data are shown as mean values (dashed curves), with the shading showing the SD. The black curves are fitting curves (r 2 > 0.95) for red dashed curves (see Materials and Methods for the calculations of r 2 and ).
- F, G
The fractional activations of tGTPase (tG*) as a function of EGF (F) or tGEF (G). The plots are generated in a similar way as in (F, G). denotes the mean of tGEF. r 2 > 0.95 for all fitting curves. The EGF‐tG* relationship shows a Hill coefficient of 1.73, and the tGEF→tG* switch (switch #2) shows a dose–response behavior close to the saturation regime of an ultrasensitive curve (n Hill = 3.82).
- A
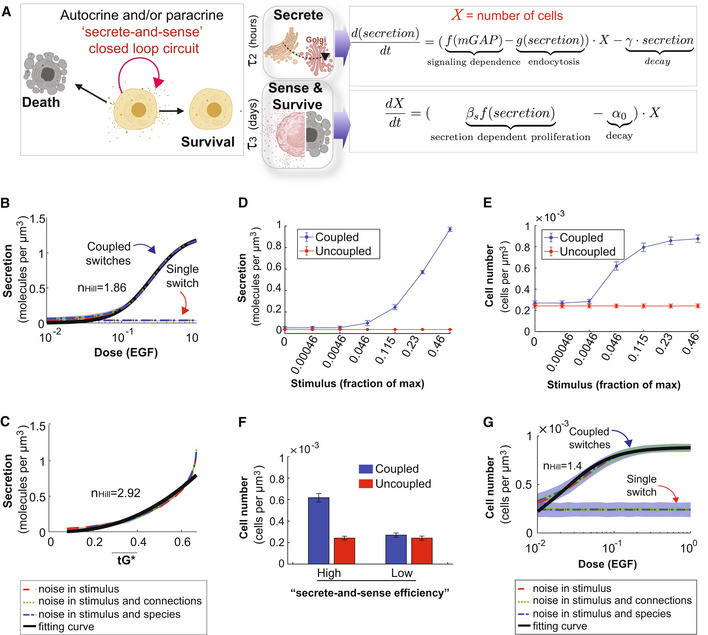
Schematic of the key features of the auto/paracrine loop that we hypothesize is regulated by the coupled GTPase circuit (left) and the corresponding phenomenological models to capture these key effects (right).
- B, C
Model prediction for secretion as a function of stimulus in cells with coupled and uncoupled GTPases. Noise is introduced into the system in a similar way as described in Fig EV4D–G. r 2 > 0.99 in (B); r 2 > 0.94 in (C).
- D, E
The secretion (D) or the cell number (E) as a function of stimulus in coupled and uncoupled switches. The stimulus = 0, 0.00046, 0.0046, 0.046, 0.115, 0.23, and 0.46 correspond to varying doses of EGF in simulations, ranging from 0, 0.1, 1, 10, 25, 50, and 100 nM, respectively. The error bar denotes SD based on 1,000 repeated independent simulations of ODEs when noise is in the stimulus and connections.
- F
The bar plot depicts cell numbers achieved by cells with either coupled or uncoupled switches, at different levels of stimulus. For the first two bars, the height and error bars are the mean and SD of cell number when stimulus = 0.046 in (E), respectively. For the last two bars, the height and error bars are the mean and SD of cell number when stimulus = 0 in (E), respectively.
- G
Relation between cell number and EGF in the presence of noise, which was introduced in a similar way as described in Fig EV4D–G. r 2 > 0.95.
- A
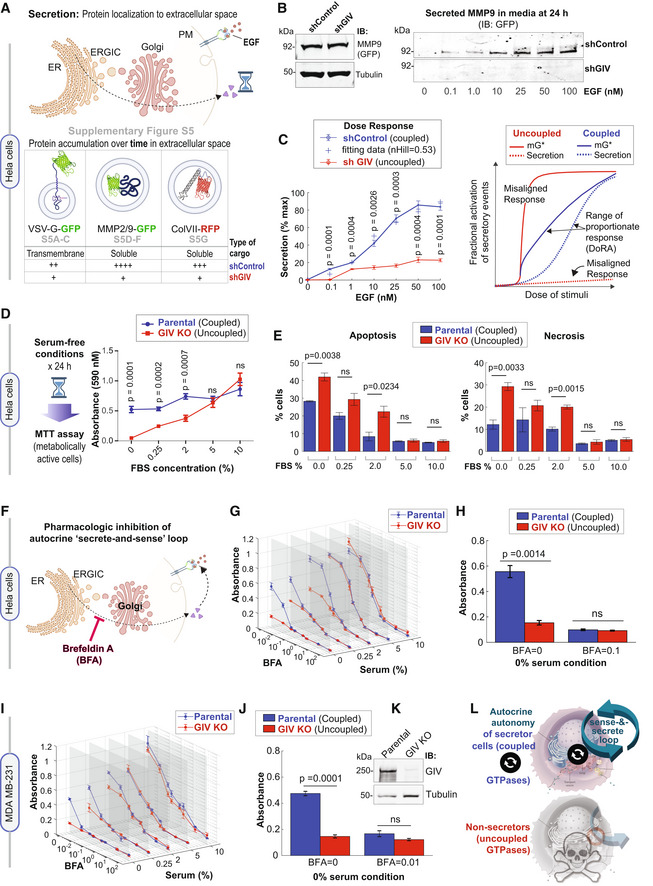
Schematic summarizes the findings showcased in Fig EV5, which investigate the secretion of diverse cargo proteins [temperature‐sensitive (ts)
VSV‐G ,MMP2 /9, andColVII ], as determined by their accumulation in extracellular space over time after the stimulus (EGF or serum). For each cargo tested, compared to cells withGIV (shControl ), ligand‐stimulated secretion was impaired in cells withoutGIV (shGIV ). - B
Immunoblots showing intracellular (left) and secreted (in the media; right)
GFP‐MMP9 at 24 h after stimulation with varying doses ofEGF . Tubulin, used as a loading control, confirms the presence of a similar number of plated cells in the assay. - C
Left: Graph displays experimentally determined secretion of
GFP‐MMP9 in response to varying doses ofEGF in control (shControl ) andGIV ‐depleted (shGIV )HeLa cells (as in B), and quantified by band densitometry. Results are expressed as mean ± SEM; n = 3 biological replicates. P‐values were determined by a two‐sided unpaired t‐test. Right: Schematic diagram of dose responses (mG * and secretion) for the single switch and coupled switches. Coupled switches stretch the range of proportionate responses. SinglemG switch results in misaligned responses.DoRA , dose–response alignment. - D
Left: Schematic summarizing the colorimetric assay used here to determine the number of metabolically viable cells. Right: The graph displays formazan absorbance expressed as a measure of cell viability from the HeLa cells (Y‐axis) cultured at varying conc. of serum (X‐axis). Results are expressed as mean ± SEM; n = 3 biological replicates. P‐values were determined by a two‐sided unpaired t‐test.
- E
Bar graphs display the % apoptotic (left) or necrotic (right) control (parental) and
GIV ‐depleted (GIV KO )HeLa cells after 24 h growth in varying concentrations of serum, as assessed by annexin V staining and flow cytometry. See also Appendix Fig S5A–C for dot plots and early and late apoptotic fractions. Results are expressed as mean ± SEM; n = 3 biological replicates. P‐values were determined by a two‐sided unpaired t‐test. - F
Schematic showing the rationale for and mechanism of action of fungal toxin,
BFA , for interrupting the secrete‐and‐sense autocrine loop in cells. -
G, H Control (parental) and
GIV ‐depleted (GIV KO )HeLa cells grown in different concentrations of serum (FBS %) were treated or not with varying concentrations ofBFA (μM ) as indicated. Line graphs in3D (G) depict the formazan absorbance expressed as a measure of cell viability from theHeLa cells in various conditions tested. Bar graphs (H) depict the cell number in serum‐free growth conditions that are supported exclusively by the autocrine secrete‐and‐sense loop (withoutBFA ;BFA = 0.0μM ) or when such loop is interrupted (BFA = 0.1μM ). Results are expressed as mean ± SEM; n = 3 biological replicates. Statistical significance was determined by one‐wayANOVA . -
I–K Control (parental) and
GIV ‐depleted (GIV KO )MDA MB ‐231 cells grown in different concentrations of serum (FBS %) were treated or not with varying concentrations ofBFA (μM ) as in (G, H) . Line graphs in3D (I) depict the formazan absorbance expressed as a measure of cell viability from theMDA MB ‐231 cells in various conditions tested. Bar graphs (J) depict the viability of theMDA MB ‐231 cells in serum‐free growth conditions that are supported exclusively by the autocrine secrete‐and‐sense loop (withoutBFA ;BFA = 0.0μM ) or when such loop is interrupted (BFA = 0.1μM ). Results are expressed as mean ± SEM; n = 3 biological replicates. Statistical significance was determined by one‐wayANOVA . Immunoblots (K) of equal aliquots of whole cell lysates confirm the depletion ofGIV compared to tubulin (loading control). See also Appendix Fig S5D–H for dot plots and early and late apoptotic fractions. Results are expressed as mean ± SEM; n = 3 biological replicates. - L
Summary of conclusions of this work. Top: Coupling of
GTPases within the secretory pathway enables dose–response alignment of secretion to stimulus, which appears to be essential for “secrete‐and‐sense” autocrine autonomy in cancer cells. Bottom: Uncoupling of theGTPases within the secretory pathway disrupts such autonomy and leads to cell death.
- A
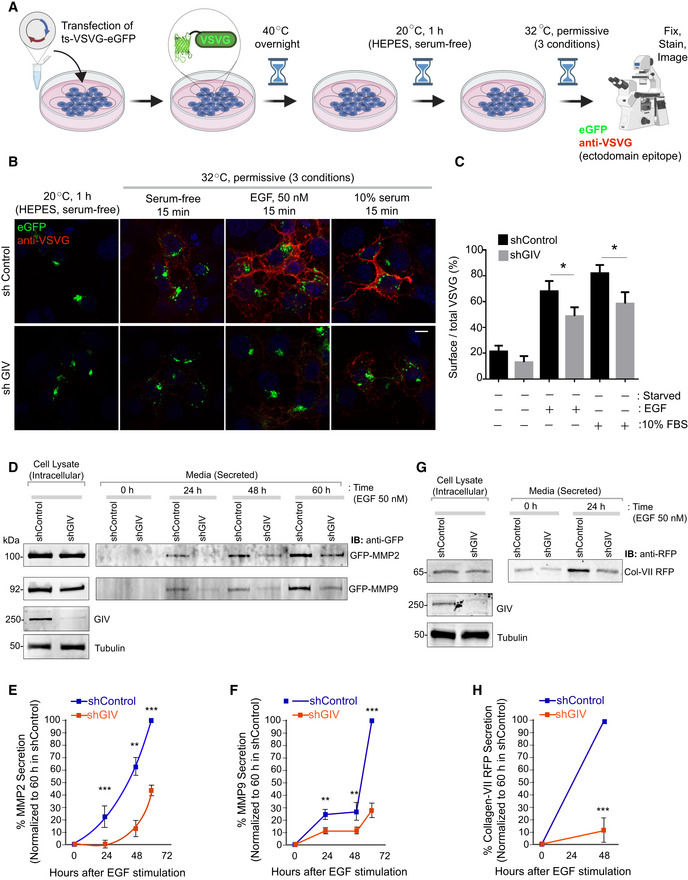
Schematic shows the basis for measuring secretion of transmembrane cargo protein, ts‐VSVG‐eGFP. This temperature‐sensitive mutant VSVG is retained in the ER at 40°C, at the Golgi at 20°C, and moves out of the Golgi to the PM when shifted to 32°C (Gallione & Rose, 1985). When visualized with immunofluorescence under non‐permeabilized conditions, a VSVG‐ectodomain targeting antibody selectively detects PM‐localized cargo, whereas a GFP tag allows the visualization of total VSVG in the cell.
- B, C
Control (sh Control; top) and GIV‐depleted (shGIV; bottom) Cos7 cells were transfected with tsO45‐VSVG‐GFP and cells were shifted to 40°C for O/N and then incubated at 20°C for 1 h in HEPES buffered serum‐free media followed by temperature shift at 32°C for 15 min in plain DMEM and or containing 50 nM EGF or 10% serum. Coverslips were fixed and stained with VSVG‐ectodomain‐specific monoclonal antibody (red). Representative images are shown in (B). Scale bar = 10 μm. Green fluorescence indicates total VSVG expression whereas red fluorescence shows the surface‐localized pool of VSVG. Bar graphs in (C) display the Red:Green intensity ratio indicative of the fraction VSVG that is secreted to the cell surface. Results are expressed as mean ± SEM; n = 3 biological replicates; P‐values were determined using Mann–Whitney t‐test compared to t0: *P < 0.05.
- D–H
Control (sh Control) and GIV‐depleted (shGIV) HeLa cells were analyzed for EGF‐stimulated secretion of three soluble cargo proteins, MMP2 (D, E), MMP9 (D, F), and Collagen‐Vii RFP (G, H), as detected from the supernatants at indicated time points after EGF stimulation. Results are expressed as mean ± SEM; n = 3 replicates; P‐values were determined using Mann–Whitney t‐test compared to t0: **P < 0.01; ***P < 0.001. Immunoblots are representative of findings from at least three independent repeats.
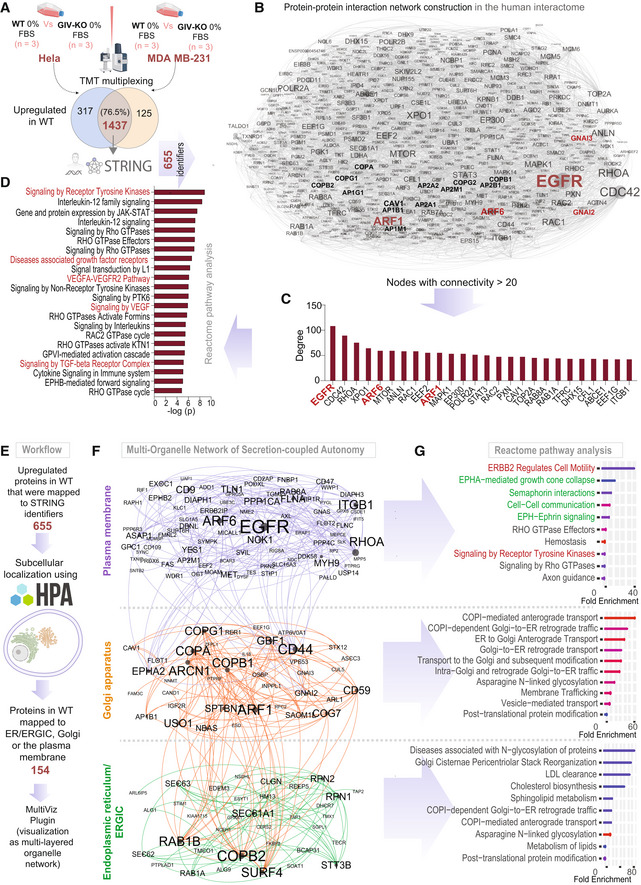
Workflow for comparative proteomics on autonomy enabled vs. disabled cells by tandem mass tag (TMT) multiplex technique followed by mapping of upregulated proteins in WT cells using the STRING database (see Materials and Methods).
A protein–protein interaction (PPI) network shows the interactions between upregulated mapped proteins in WT cells. Node and font sizes correlate positively with the degrees of connectivity.
Bar plot shows the degree distribution of highly connected (degree > 20) nodes in the PPI network in (B).
Reactome pathway analysis of the pathways enriched in the most connected proteins in (C). Red = pathways associated with growth factor signaling.
Workflow for the construction of a multi‐organelle network of autonomy‐enabled cells using subcellular localization of upregulated proteins in the WT cells.
Visualization of a multi‐organelle network of proteins that partake in secretion‐coupled autonomy across three compartments, the plasma membrane, the Golgi, and the ER/ERGIC.
Reactome pathway analyses of the pathways enriched within the three organelles in (F). Red pathways associated with RTK/EGFR signaling and Green pathways associated with multi‐cellular cell–cell communication in the plasma membrane.
References
-
- Arvan P, Zhao X, Ramos‐Castaneda J, Chang A (2002) Secretory pathway quality control operating in Golgi, plasmalemmal, and endosomal systems. Traffic 3: 771–780 - PubMed
Publication types
MeSH terms
Substances
Grants and funding
- T32 CA121938/CA/NCI NIH HHS/United States
- CA100768/NH/NIH HHS/United States
- R01 GM132106/GM/NIGMS NIH HHS/United States
- R01 CA100768/CA/NCI NIH HHS/United States
- R01 CA160911/CA/NCI NIH HHS/United States
- GM132106/NH/NIH HHS/United States
- PDF14298952/KOMEN/Susan G. Komen/United States
- R01 AI141630/AI/NIAID NIH HHS/United States
- CA160911/NH/NIH HHS/United States
- R01 CA238042/CA/NCI NIH HHS/United States
- CA238042/NH/NIH HHS/United States
- AI141630/NH/NIH HHS/United States
- 14POST20050025/AHA/American Heart Association-American Stroke Association/United States
LinkOut - more resources
Full Text Sources
Research Materials
Miscellaneous
