. 2023 Mar 1;133(5):e147087.
doi: 10.1172/JCI147087.

Single-cell RNA sequencing and spatial transcriptomics reveal cancer-associated fibroblasts in glioblastoma with protumoral effects

Affiliations

Single-cell RNA sequencing and spatial transcriptomics reveal cancer-associated fibroblasts in glioblastoma with protumoral effects

Saket Jain et al. J Clin Invest. .

Abstract

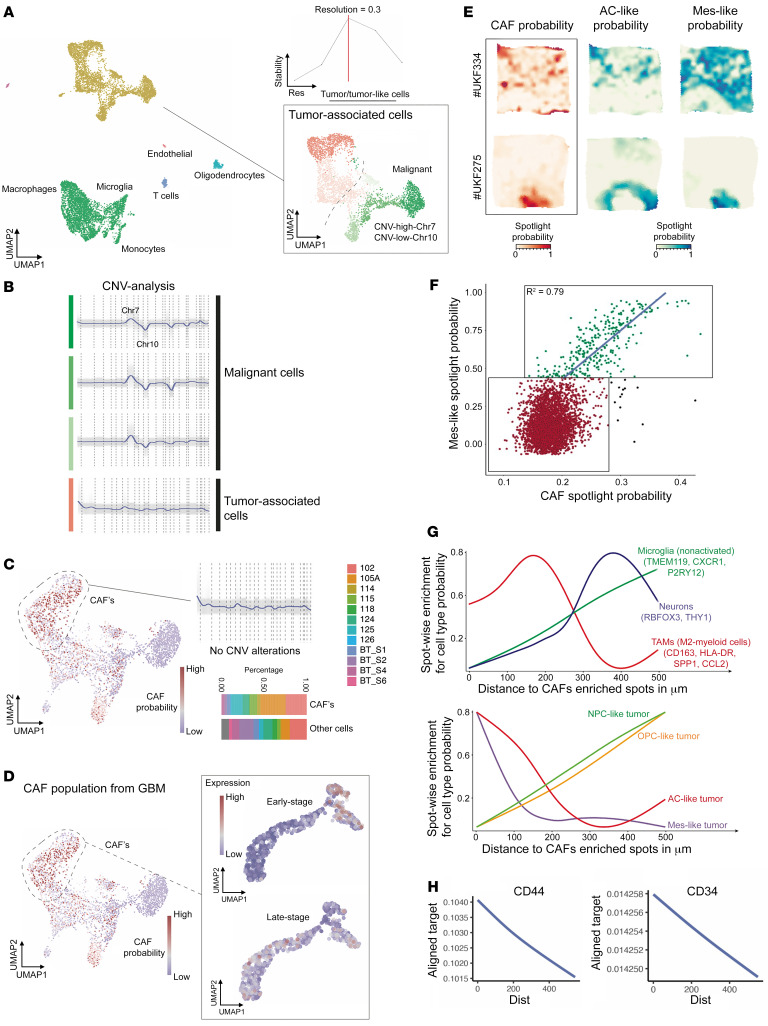
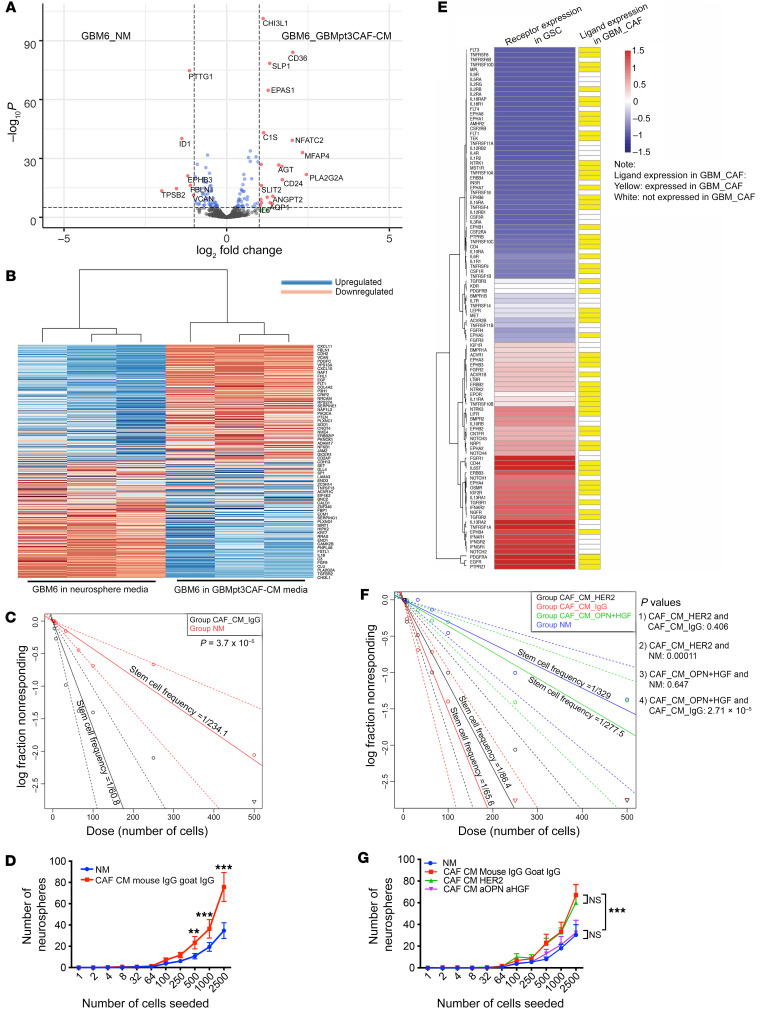
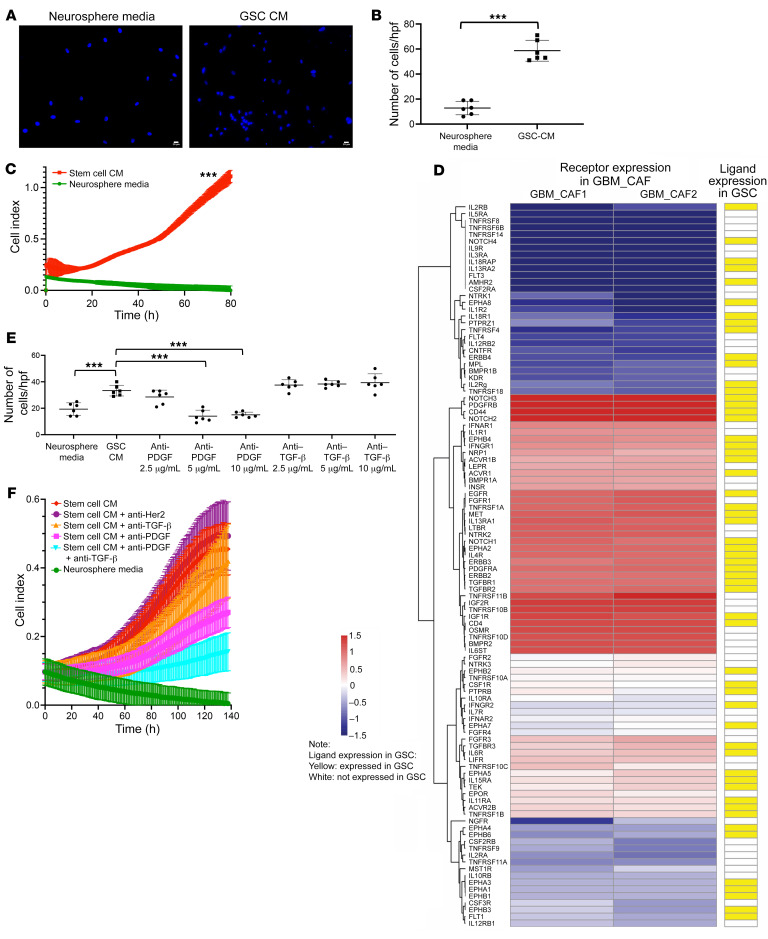
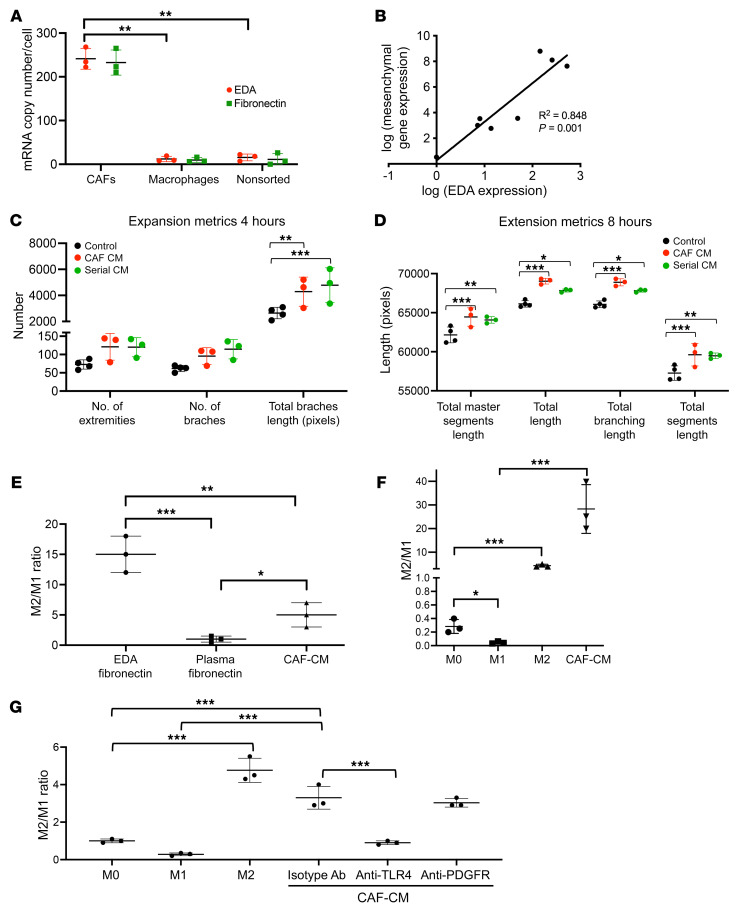
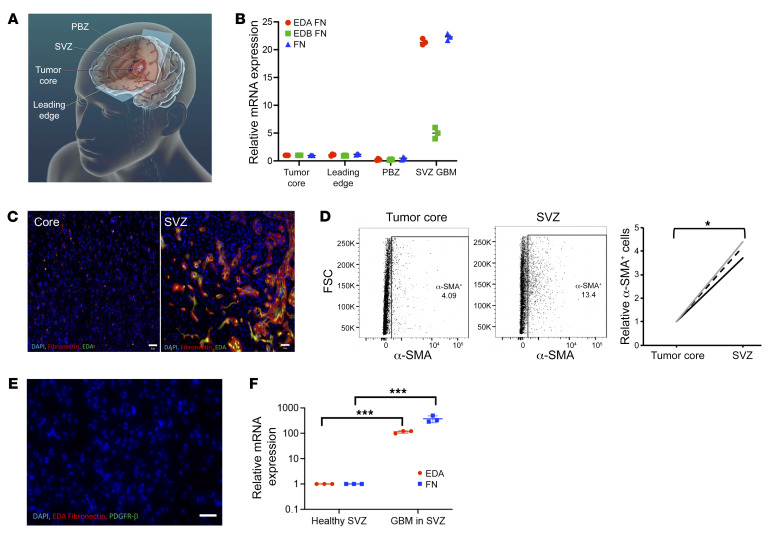
Cancer-associated fibroblasts (CAFs) were presumed absent in glioblastoma given the lack of brain fibroblasts. Serial trypsinization of glioblastoma specimens yielded cells with CAF morphology and single-cell transcriptomic profiles based on their lack of copy number variations (CNVs) and elevated individual cell CAF probability scores derived from the expression of 9 CAF markers and absence of 5 markers from non-CAF stromal cells sharing features with CAFs. Cells without CNVs and with high CAF probability scores were identified in single-cell RNA-Seq of 12 patient glioblastomas. Pseudotime reconstruction revealed that immature CAFs evolved into subtypes, with mature CAFs expressing actin alpha 2, smooth muscle (ACTA2). Spatial transcriptomics from 16 patient glioblastomas confirmed CAF proximity to mesenchymal glioblastoma stem cells (GSCs), endothelial cells, and M2 macrophages. CAFs were chemotactically attracted to GSCs, and CAFs enriched GSCs. We created a resource of inferred crosstalk by mapping expression of receptors to their cognate ligands, identifying PDGF and TGF-β as mediators of GSC effects on CAFs and osteopontin and HGF as mediators of CAF-induced GSC enrichment. CAFs induced M2 macrophage polarization by producing the extra domain A (EDA) fibronectin variant that binds macrophage TLR4. Supplementing GSC-derived xenografts with CAFs enhanced in vivo tumor growth. These findings are among the first to identify glioblastoma CAFs and their GSC interactions, making them an intriguing target.

Keywords: Brain cancer; Fibronectin; Oncology.


Figures

Figure 1
Figure 1. Identification of CAFs in GBM by serial trypsinization.
(A) Segmented images of cells from patient GBM with or without serial trypsinization. Shown are GBMpt3CAF. Scale bars: 100 μm. (B) Using VAMPIRE analysis, we trained a machine-learning logistic regression classifier utilizing breast CAF data (366 1997T cells and 499 2124T cells) and GBM data from GBM6 (803 cells), GBM43 (350 cells), and U251 (685 cells). For testing, 159 cells with serial trypsinization and 1,187 cells without serial trypsinization were assessed, revealing that 77% of GBMpt3CAF cells from serial trypsinization of GBM exhibited fibroblast morphology, defined using 1997T and 2124T, compared with just 23% of these cells exhibiting GBM morphology, defined using GBM6, GBM43 and U251. In contrast, only 18% of cells from this patient not undergoing serial trypsinization had fibroblast morphology. P < 0.001, Fisher’s exact test. (C) Serially trypsinized cells from patient GBMs (GBMpt1CAF and GBMpt2CAF) exhibited transcriptomic profiles similar to those of breast CAFs and dermal fibroblasts but distinct from brain pericytes, as assessed by bulk RNA-Seq. Heatmap is based on log2 (fold change) and significant P adjusted values. (DG) Results from scRNA-Seq of 4,385 serially trypsinized cells from GBMpt4CAF with UMAP showing (D) CAF probability scores based on CAF marker expression and stromal marker absences; (E) CNV revealing tumor cells with CNV alterations (cyan) and stromal cells without CNV alterations (red); and (F) cells deemed CAFs (navy) after tumor cells with CNV changes were removed from cells with high CAF probability scores. CAFs were in cluster containing mostly CAFs (top left) or cluster (lower left) associated with tumor cells but distinct from them based on CNV. (G and H) Pseudotime reconstruction of scRNA-Seq data using a minimum spanning tree (MST) approach revealed that early CAFs evolved into 2 subtypes (G), with heatmaps showing temporal gene expression during this process (H). ***P < 0.001.
Figure 2
Figure 2. Identification of CAFs in GBM by scRNA-Seq of patient GBMs.
(AD) scRNA-Seq results from 12 patient GBMs (30, 31) were analyzed using mutual nearest neighbor horizontal integration followed by SNN clustering. (A) Optimal number of clusters was determined by the cluster stability score (upper right) resulting in 18 robust cell clusters. While most stromal cells clustered away from tumor cells, some stromal cells clustered close to tumor cells. (B) Green cells were tumor cells based on CNV analysis, while red cells were stromal. (C) CAF probability scores based on exclusive gene signatures and defined exclusion criteria were computed (left side). CAFs exhibited no CNV alterations (upper right) and were identified in each of the 12 patients (lower right). (D) Presence of early versus late-stage CAF subtypes was evaluated in cells with high CAF probability scores, with late-stage CAFs predominating over early stage CAFs in these 12 patients. (EH) Deconvolution of spatially resolved transcriptomics was performed. (E) Surface plots obtained from 6 × 6 mm tissue samples revealing that CAFs (left) spatially correlated with the MES and astrocyte-like (AC-like) GBM cell signatures (30). Two examples of low overlap (top) and high overlap (bottom) are demonstrated. (F) Spatial correlation between CAFs and mes-GBM cells was significant (P < 0.001, Pearson’s R2 = 0.79). (G and H) Line diagrams show the spatial relationship between CAFs and other cell types or states (tumor subtypes). The x axis represents the relative distance to CAFs. The y axis shows the cell type/state probability of a particular gene set or spotlight probability. The spatial distance of CAFs to different cell types or states was computed based on ranked cell-type probability. If high cell probability values are displayed at a short distance (dist) from CAFs, the likelihood of a spatial relationship is high, as occurred for (G) mes- and AC-GBM cells and M2 TAMs and (H) CD44+ GSCs and CD34+ endothelial cells.
Figure 3
Figure 3. CAFs induce protumoral effects on GSCs.
Multiplex transcriptomic analysis using the NanoString nCounter platform revealed cancer progression genes upregulated by GBMpt3CAF CM in GBM6 GSCs. (A) Volcano plot showing significantly (P < 0.05) up- (right of rightmost vertical dashed line) and downregulated genes (left of leftmost vertical dashed line). (B) Heatmap showing significantly (P < 0.05) up- and downregulated genes. (C) Limiting dilution sphere-formation assay represented by Poisson’s distribution shows increased GSC frequency with GBM6 cells in CAF_CM (P = 3.7 × 10⁻⁵). (D) Limiting dilution sphere-formation assay showing that CAF_CM increases neurosphere formation (2,500 cells: P < 0.0001; 1,000 cells: P = 0.001; 500 cells: P < 0.0067). (E) Receptor expressions in GBMpt1CAFs and GBMpt2CAFs (Supplemental Table 3) were mapped to their cognate ligands/agonists expressed by GBM6 neurospheres (37) based on a database of 491 receptor-ligand interactions (67). Shown are cognate pairs coexpressed by GBM CAFs and GSCs for which FPKM of the ligand is greater than 0.05 and read counts of the receptor are greater than 10 (174 CAF ligands with receptors expressed by GSCs). (F) Limiting dilution sphere-formation assay represented by Poisson’s distribution shows that the increased GSC frequency in CAF_CM is mitigated by combining anti-HGF and anti-OPN (P values on graph). GSC frequency was not mitigated by HER2 antibody in CAF_CM. (G) Limiting dilution sphere-formation assay showing that induction of neurosphere formation by CAF_CM is mitigated by combining anti-HGF and anti-OPN (2,500 cells: P < 0.0001; 1,000 cells: P = 0.009; 500 cells: P = 0.04). Sphere-formation was not mitigated by anti-HER2 in CAF_CM (P = 0.7–0.8). ANOVA with post hoc Tukey’s test. For limiting dilution sphere-forming assays, log-fraction plots of the limiting dilution model fitted to the data are shown. The slope of the line is the log-active cell fraction. Dotted line shows 95% CI. Data value with zero negative response at a particular dose is represented by a downward pointing triangle. **P < 0.01; ***P < 0.001.
Figure 4
Figure 4. GSCs mediate CAF invasion and proliferation via PDGF and TGF-β pathways.
Compared with NM, CM from GBM6 stem cell–enriched neurospheres (A and B) attracted more GBMpt1CAFs in chemotaxis assays (n = 6/group; P < 0.001, t test) and (C) stimulated GBMpt5CAF proliferation (P < 0.001 at all time points; n = 5/group; t test). Scale bars: 20 μm. (D) We mapped the expression of receptors expressed by GBMpt1CAFs and GBMpt2CAFs (Supplemental Table 2) to that of their cognate ligands/agonists expressed by GBM6 neurospheres (37) based on a database of 491 known receptor-ligand interactions (67). Shown are cognate pairs coexpressed by GBM CAFs and GSCs for which FPKM of the ligand is greater than 0.05 and read counts of the receptor are greater than 10, which represented 189 GSC ligands with receptors expressed by CAFs. (E) Chemotaxis of GBMpt1CAFs toward GBM6 neurosphere CM was abrogated by neutralizing antibodies against PDGF (P < 0.001 at 5 and 10 μg/mL), but not TGF-β. TGF-β–neutralizing antibodies did not abrogate invasion at 2.5–10 μg/mL (P = 0.3–0.7). PDGF-neutralizing antibodies reduced the number of invading cells at 5 and 10 μg/mL (P < 0.001; n = 6/group). ANOVA with post hoc Tukey’s test. (F) PDGF-neutralizing antibodies minimally reduced and TGF-β antibodies did not alter GBM43 GSC CM-induced GBMpt5CAF proliferation (PDGF: P = 0.1–0.5 from 0–119 hours, P = 0.02–0.047 from 120–140 hours; TGF-β: P = 0.2–0.6 from 0–140 hours), while combining these antibodies reduced GBM43 GSC CM-induced GBMpt5CAF proliferation (P = 0.01–0.04 from 105–119 hours, P = 0.007–0.009 from 120–140 hours, both antibodies versus no antibodies in GBM43 GSC CM; P = 0.02–0.04 from 120–140 hours, both antibodies versus anti-PDGF; P = 0.01–0.04 from 100–119 hours and P = 0.006–0.009 from 120–140 hours, both antibodies versus anti–TGF-β). HER2 antibodies exerted no effect (P = 0.6–0.8 from 0–140 hours) on GBM43 GSC CM-induced GBMpt5CAF proliferation. n = 5/group; ANOVA with post hoc Tukey’s test. ***P < 0.001.
Figure 5
Figure 5. Effect of GBM CAFs on the tumor microenvironment in culture assays.
(A) qPCR revealed elevated expression of total and EDA splice variant of FN in CAF-like cells isolated by serial trypsinization of patient GBMs relative to (a) CD11b+ TAMs (P = 0.008) and (b) a tumor cell–enriched population obtained by flow sorting a freshly resected GBM to eliminate CD11b+, CD31+, and CD3+ cells (P = 0.007; n = 3/group). Ct values were normalized to GAPDH. (B) EDA expression correlated with aggregate expression of 5 MES genes (Supplemental Table 6) as assessed by qPCR of newly diagnosed GBM patient specimens (n = 8; P = 0.0012). GBMpt4CAF CM increased (C) total branch length (P = 0.003) and (D) total master segment length (P < 0.001), total length (P < 0.001), total branching length (P < 0.001), and total segment length (P < 0.001). Serial CM from GBM cells grown in CAF CM did not increase these metrics compared with that of HUVECs in CAF CM (P = 0.1-0.9; n = 6/group). (EG) GBMpt2CAF_CM caused M2 macrophage polarization based on ratio of qPCR gene expression of 3 M2 genes (ARG1, TGFB1, and MMP9) to 3 M1 genes (NOS2, CXCL10, and IL1B). (E) CAF_CM and CAF-produced EDA caused more M2 polarization of cultured macrophages derived from circulating human monocytes than plasma FN lacking the EDA splice variant (n = 3/group; P = 0.04, CAF_CM versus plasma FN; P < 0.001, EDA versus plasma FN; P = 0.003, CAF_CM versus EDA). (F) CAF_CM drove more M2 polarization of THP-1 immortalized monocytes differentiated into macrophages followed by incubation in CAF_CM than a cytokine-positive control that drives M2 polarization (n = 3/group; P < 0.001). (G) Effects of CAF CM on M2 polarization of cultured macrophages derived from human monocytes isolated from peripheral blood were reduced by a blocking antibody against EDA receptor TLR4 (n = 3/group; P < 0.001). All P values were generated by ANOVA with post hoc Tukey’s test statistical analysis. *P < 0.05; **P < 0.01; ***P < 0.001.
Figure 6
Figure 6. Regional variation of CAF localization in GBM.
(A) Schematic showing where site-directed biopsies from patient GBMs were taken. (B) qPCR revealed that SVZ GBM had 22-fold increased expression of EDA (P < 0.001), 22-fold increased total FN expression (P < 0.001), and 5-fold increased EDB expression (P = 0.02) compared with the tumor core (n = 3/group ANOVA with post hoc Tukey’s test). (C) Immunofluorescence confirmed elevated EDA (green) and total FN (red) in SVZ GBM compared with the tumor core. Scale bars: 30 μm. (D) Flow cytometry for CAF marker α-SMA reveals elevation in the SVZ compared with the tumor core (n = 3 paired specimens; P = 0.02 paired t test). (E) Immunofluorescence revealed no PDGFR-α or EDA staining in the SVZ of a GBM patient whose tumor did not involve the SVZ. Original magnification, ×100. Scale bar: 30 μm. (F) Total and EDA FN expression by qPCR was elevated in SVZ GBM but virtually undetectable in tumor-free SVZ from epilepsy surgery (P < 0.001; t test; n = 3). *P < 0.05; ***P < 0.001.
Figure 7
Figure 7. CAFs induce GBM tumor growth intracranially in vivo.
(A) Kaplan-Meier curve showing intracranial implantation of 3.5 × 10⁴ GBM6 neurospheres with 5 × 10³ GBMpt3CAFs reduced survival compared with mice receiving 4.0 × 10⁴ GBM6 neurospheres, a threshold not associated with tumor formation in most mice (n = 10/group; P = 0.03). Compared with mice receiving 105 GBM6 cells in neurospheres (higher number used to generate tumors), intracranial implantation of 3.5 × 10⁴ GBM6 neurospheres with 5 × 10³ CAFs upregulated cancer progression genes as determined by NanoString nCounter multiplex analysis using a PanCancer progression codeset, and as seen by (B) volcano plot showing significantly (P < 0.05) up- (to the right of rightmost vertical dashed line) and downregulated genes (to the left of leftmost vertical dashed line). (C) Heatmap showing significantly (P < 0.05) up- and downregulated genes constructed based on the log2 (fold change) and significant P adjusted value. (D) Pathway analysis showing that CAFs upregulated HIF-1 signaling, EMT, and cell proliferation pathways in GBM6 tumors (P < 0.003). (E) Immunofluorescence images (×20 magnification) showing increased vasculature, labeled via rhodamine B-dextran perfusion in sections from mice with GBM6+CAFs, quantified by (F) total vessel area/hpf (P = 0.02); P = 0.0002) (3 mice/group; 8 fields/mouse; t test). (G) CAFs increased the percentage of macrophages that were CD206+ M2 protumoral macrophages in GBM6 neurosphere-derived tumors (P = 0.0096; t test). Scale bar: 20 μM. *P < 0.05; **P < 0.01; ***P < 0.001.

References

    1. Stupp R, et al. Improving survival in molecularly selected glioblastoma. Lancet. 2019;393(10172):615–617. doi: 10.1016/S0140-6736(18)33211-2. - DOI - PubMed
    1. Quail DF, Joyce JA. The microenvironmental landscape of brain tumors. Cancer Cell. 2017;31(3):326–341. doi: 10.1016/j.ccell.2017.02.009. - DOI - PMC - PubMed
    1. Bhowmick NA, et al. Stromal fibroblasts in cancer initiation and progression. Nature. 2004;432(7015):332–337. doi: 10.1038/nature03096. - DOI - PMC - PubMed
    1. LeBleu VS, Neilson EG. Origin and functional heterogeneity of fibroblasts. FASEB J. 2020;34(3):3519–3536. doi: 10.1096/fj.201903188R. - DOI - PubMed
    1. Clavreul A, et al. Isolation of a new cell population in the glioblastoma microenvironment. J Neurooncol. 2012;106(3):493–504. doi: 10.1007/s11060-011-0701-7. - DOI - PubMed

Publication types