

Pseudomonas aeruginosa LecB suppresses immune responses by inhibiting transendothelial migration
- PMID: 36856136
- PMCID: PMC10074054
- DOI: 10.15252/embr.202255971
Pseudomonas aeruginosa LecB suppresses immune responses by inhibiting transendothelial migration
Abstract
Pseudomonas aeruginosa is a Gram-negative bacterium causing morbidity and mortality in immuno-compromised humans. It produces a lectin, LecB, that is considered a major virulence factor, however, its impact on the immune system remains incompletely understood. Here we show that LecB binds to endothelial cells in human skin and mice and disrupts the transendothelial passage of leukocytes in vitro. It impairs the migration of dendritic cells into the paracortex of lymph nodes leading to a reduced antigen-specific T cell response. Under the effect of the lectin, endothelial cells undergo profound cellular changes resulting in endocytosis and degradation of the junctional protein VE-cadherin, formation of an actin rim, and arrested cell motility. This likely negatively impacts the capacity of endothelial cells to respond to extracellular stimuli and to generate the intercellular gaps for allowing leukocyte diapedesis. A LecB inhibitor can restore dendritic cell migration and T cell activation, underlining the importance of LecB antagonism to reactivate the immune response against P. aeruginosa infection.
Keywords: bacterial lectin; dendritic cells; lymphatics; migration; skin.
© 2023 The Authors. Published under the terms of the CC BY NC ND 4.0 license.
Conflict of interest statement
The authors declare that they have no conflict of interest.
Figures

- A
Flow cytometry gating strategy to identify the leukocytes emigrating from human skin explants into cell culture medium.
- B
Human skin explants were cultured in complete medium for 3 days in the absence (nontreated, NT) or presence of LecB or LecA, emigrated cells counted and identified by flow cytometry (panel A).
- C
As for panel (B) with DH445 and/or LecB added to the culture medium, normalized to the untreated condition.
- D
Epifluorescence imaging of human skin cross‐sections after incubation of skin explant in culture with LecB‐A488 and then stained for CD31, HLA‐DR and cell nuclei (DAPI). Arrows point to CD31+ endothelial cells bound by LecB‐A488.
- E
Flow cytometry of LecB‐A488 binding to ex vivo isolated CD31+ CD146+ podoplanin (Pdpn)− blood and CD31+ CD146− Pdpn+ lymphatic endothelial cells in the absence or presence of different concentrations of the LecB inhibitor DH445.


- A
Schematic illustration of the endothelial transmigration assay and its analysis.
- B
The graph shows the number of human peripheral blood mononuclear cells (PBMC), blood‐isolated lymphocytes or monocytes transmigrated across the human CMEC/D3 endothelial cell barrier in the presence of LecB, relative to the nontreated (NT) condition.
- C
The graph shows the number of the indicated leukocytes remaining on the endothelial monolayer.
- D
Confocal images of the CMEC/D3 cells stained for VE‐cadherin for the indicated experimental conditions.
- E
Confocal images of monolayers of HUVECs, nontreated (NT) or exposed to LecB for 1 or 3 h, were fixed and stained for VE‐cadherin, F‐actin, focal adhesion kinase (FAK), and nuclei with DAPI.
- F
Left: Western blot analysis of VE‐cadherin and α‐tubulin in HUVEC lysates treated with LecB for the indicated times. Right: Densitometric quantification of the western blot of VE‐cadherin relative to α‐tubulin.

- A
Confocal images of the indicated endothelial cells lines, exposed to LecB‐A488 for the indicated times before fixation and coloring with the nuclear dye Hoechst. Arrows identify cells with internalized LecB.
- B
Top: HUVECs were stained with VE‐cadherin, DAPI, F‐actin and FAK, and the cell's perimembranous and intracellular areas were identified on bright‐field images. Bottom: The pixels of fluorescence of VE‐cadherin, F‐actin, FAK in these subcellular areas were determined for each cell based on phase contrast images using Fiji (ImageJ software) and normalized for cell surface area. For the intracellular VE‐cadherin measures, the DAPI+ nuclear area was subtracted. The graphs depict these measures for each imaged cell.
- A
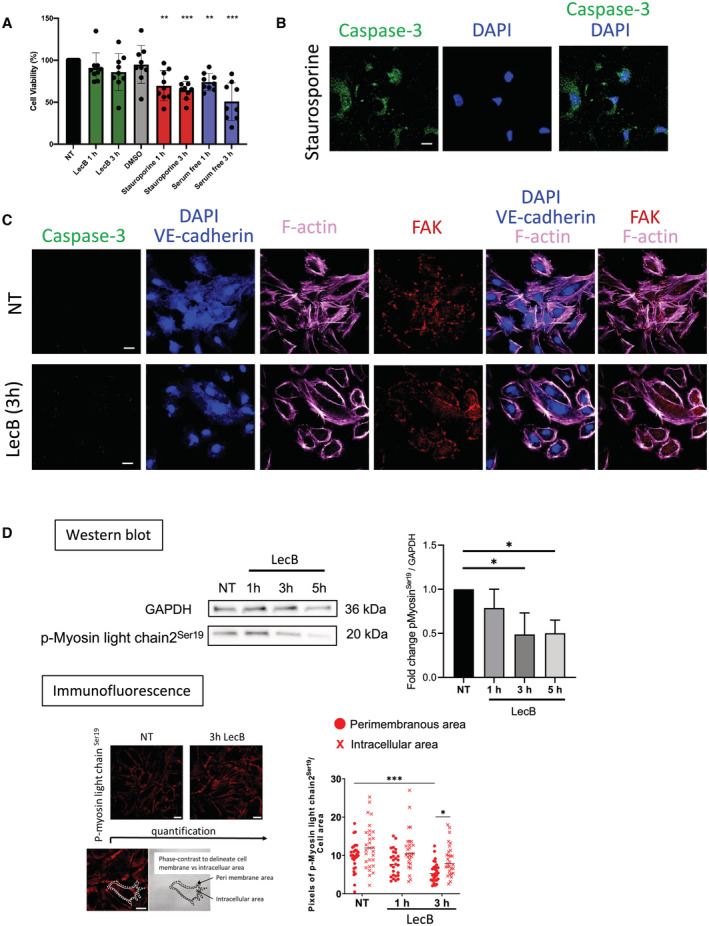
HUVECs were left untreated (NT), or incubated with LecB, DMSO, Staurosporine in DMSO and in serum‐free medium for the indicated times, and cell viability assessed using the MTT assay.
- B
HUVECs undergoing apoptosis with Staurosporine were imaged for caspase‐3, and nuclei stained with DAPI.
- C
Untreated (NT) or LecB‐treated HUVECs were stained for the indicated proteins and caspase‐3 to exclude imaging apoptotic cells.
- D
Western blot analysis of p‐Myosin light chain2Ser19 and GAPDH in HUVEC lysates treated with LecB for the indicated times. Densitometric quantification of the western blot of p‐Myosin light chain2Ser19 relative to GAPDH. Below: Imaging and quantification of p‐Myosin light chain2Ser19 immunofluorescence of HUVECs untreated (NT) or treated for 3 h with LecB. The cell's perimembranous and intracellular areas were identified on the bright field cell images. The pixels in the subcellular areas for each cell image was determined using Fiji (ImageJ software) and normalized for cell surface area.

- A
Whole mount confocal immunofluorescence of ear skin from Prox1‐cre ERT2 tdTomato stop‐flox (iProx1 tdT ) after injection with LecB‐A488 or saline (nontreated, NT). Arrows point to tdTomato+ lymphatic vessels bound by LecB‐A488.
- B
Confocal imaging of LN sections after LecB‐A488 injection and stained for chloride channel calcium‐activated 1 (CLCA1), CD31 and cell nuclei (DAPI). Insets on the right show close‐ups of the subcapsular and the medullary areas.
- C
Top: Flow cytometry gating strategy to identify LN stromal cell subsets among live CD45‐TER‐119 cells. Bottom: Flow cytometry histograms of green fluorescence for the identified stromal subsets after LecB‐A488 (red line) or saline (gray curve) injection.
- D
The graph depicts the median fluorescence intensity (MFI) of green fluorescence of LecB‐A488 versus saline of the cells analyzed in panel B.

- A
Confocal imaging of a popliteal LN section 4 h after injection of LecB‐A488, stained for PNAd+ HEVs with cell nuclei colored with DAPI. Scale bars represent 200 μm in whole LN images and 50 μm in close‐ups.
- B
Top: Flow cytometry gating strategy to identify LN marginal lymphatic sinus and subcapsular lymphatic sinus macrophages (MSM and SSM, respectively) as well as other macrophage subsets (F4/80+CD169− and F4/80−CD169−). Bottom: Flow cytometry histograms of green fluorescence for the macrophages subsets after LecB‐A488 (orange line) or saline (gray curve) ear injection.
- C
Top: Flow cytometry gating strategy to identify LN‐resident and skin‐derived dendritic cells (DCs) as well as B and T cells. Bottom: Flow cytometry histograms of green fluorescence after LecB‐A488 ear injection for B cells, T cells (red line) as well as the DC subsets (green line), the gray curve represents the saline control.
- D
The graph depicts the median fluorescence intensity (MFI) of green fluorescence of LecB‐A488 versus saline of the cells analyzed in panels (A) and (B). The data are expressed as ± SEM with each point representing the data collected from two pooled auricular LNs of one mouse. **P < 0.01 as determined by the Wilcoxon–Mann–Whitney test.
- A
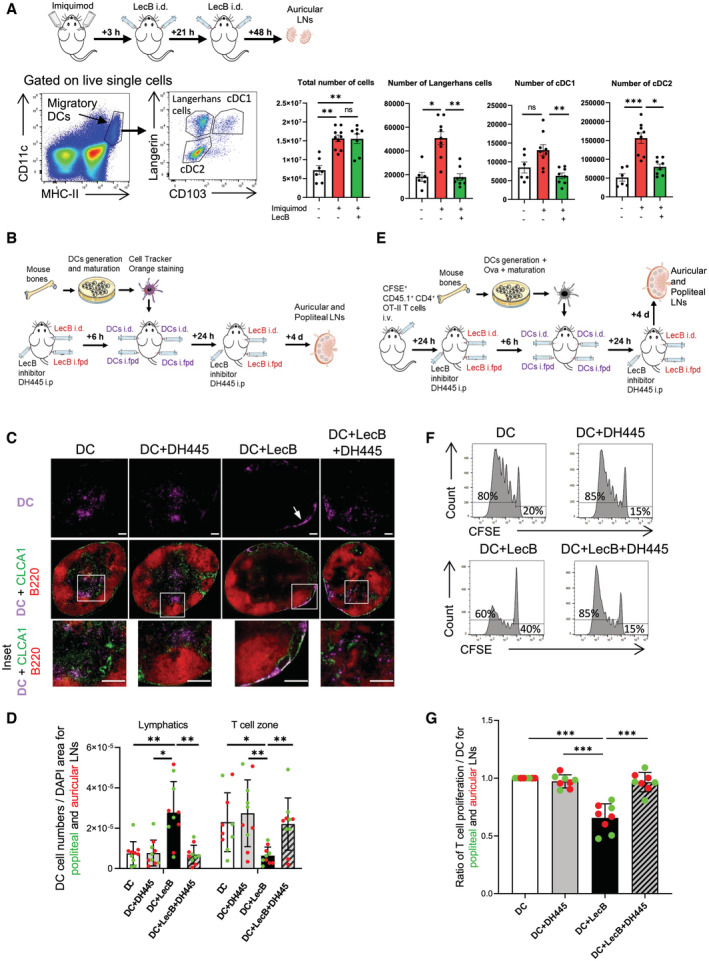
Schematic illustration of the experiment to assess inhibition of skin DCs migration to draining auricular LNs by intradermal LecB injection after mobilization by imiquimod (Aldara cream). Left: gating strategy to identify Langerhans cells, cDC1 and cDC2 subsets among the migratory DCs. Right: Graphs depict total auricular LN cell numbers, number of LCs, cDC1, and cDC2 without and with imiquimod application in the absence or presence of LecB.
- B
Schematic illustration of the experiment of panels (C, D).
- C
Epifluorescent imaging of LN sections stained for chloride channel calcium‐activated 1 (CLCA1), expressed by the lymphatic endothelial cells, and B220+ B cells residing in the LN cortex. DCs are visualized by their Cell Tracker Orange staining. Arrow points to DCs associated with a subcapsular lymphatic sinus. Insets show close‐ups of DCs in the T cell paracortex (DC, DC+DH445, DC+LecB+DH445) or in the subcapsular lymphatic sinus (DC+LecB).
- D
The graph shows the DC numbers associated with CLCA1+ lymphatics or the B220‐ T cell zone per LN section normalized for DAPI+ area.
- E
Schematic illustration of the experiment of panels (F, G).
- F
Representative flow cytometry profiles of CFSE of donor CD45.1+ CD3+ CD4+ ova‐specific T cells in the different recipient mice. The proportion of proliferating versus CFSE+ undivided T cells is noted.
- G
The graph depicts the proportion proliferating T cells of the different experimental condition relative to the DC‐only control condition.

- A
Schematic illustration of the experiment to target DEC‐205+ skin DCs and Langerhans cells and test the effect of LecB on migration to the draining LNs. Flow cytometry gating strategy to identify Langerhans cells (LCs) and cDC1 subsets among the migratory DCs. DEC‐205‐647 targeting was determined among two cell types.
- B
Graphs depict the number of DEC‐205+ cells among the Langerhans cells (LCs) and cDC1 without and with imiquimod application in the absence or presence of LecB. The data are expressed as ± SEM with each data point representing two auricular LNs of one mouse. ns, nonsignificant, **P < 0.01, by Kruskal–Wallis test.
References
-
- Avichezer D, Gilboa‐Garber N (1987) PA‐II, the L‐fucose and D‐mannose binding lectin of Pseudomonas aeruginosa stimulates human peripheral lymphocytes and murine splenocytes. FEBS Lett 216: 62–66 - PubMed
-
- Bansal A, Chand T, Kumar R (2016) Pseudomonas species as an uncommon culprit in transbronchial needle aspiration of mediastinal lymph node. J Assoc Chest Physicians 4: 91–93
-
- Birukov KG, Bochkov VN, Birukova AA, Kawkitinarong K, Rios A, Leitner A, Verin AD, Bokoch GM, Leitinger N, Garcia JG (2004) Epoxycyclopentenone‐containing oxidized phospholipids restore endothelial barrier function via Cdc42 and Rac. Circ Res 95: 892–901 - PubMed
Publication types
MeSH terms
Substances
Grants and funding
- ANR-20-CE15-0019-01/Agence Nationale de la Recherche (ANR)
- 42523VF/Campus France (Agence Française pour la Promotion de l'Enseignement Supérieur, l'Accueil et la Mobilité Internationale)
- EXC-294/Deutsche Forschungsgemeinschaft (DFG)
- 57445444/Deutscher Akademischer Austauschdienst France (DAAD France)
- 33-7532.20/Ministerium für Wissenschaft, Forschung und Kunst Baden-Württemberg (MWK)
LinkOut - more resources
Full Text Sources
