. 2023 Apr;14(2):1083-1095.
doi: 10.1002/jcsm.13198. Epub 2023 Mar 1.

Gene polymorphisms associated with heterogeneity and senescence characteristics of sarcopenia in chronic obstructive pulmonary disease

Affiliations

Gene polymorphisms associated with heterogeneity and senescence characteristics of sarcopenia in chronic obstructive pulmonary disease

Amy H Attaway et al. J Cachexia Sarcopenia Muscle. 2023 Apr.

Abstract

Background: Sarcopenia, or loss of skeletal muscle mass and decreased contractile strength, contributes to morbidity and mortality in patients with chronic obstructive pulmonary disease (COPD). The severity of sarcopenia in COPD is variable, and there are limited data to explain phenotype heterogeneity. Others have shown that COPD patients with sarcopenia have several hallmarks of cellular senescence, a potential mechanism of primary (age-related) sarcopenia. We tested if genetic contributors explain the variability in sarcopenic phenotype and accelerated senescence in COPD.

Methods: To identify gene variants [single nucleotide polymorphisms (SNPs)] associated with sarcopenia in COPD, we performed a genome-wide association study (GWAS) of fat free mass index (FFMI) in 32 426 non-Hispanic White (NHW) UK Biobank participants with COPD. Several SNPs within the fat mass and obesity-associated (FTO) gene were associated with sarcopenia that were validated in an independent COPDGene cohort (n = 3656). Leucocyte telomere length quantified in the UK Biobank cohort was used as a marker of senescence. Experimental validation was done by genetic depletion of FTO in murine skeletal myotubes exposed to prolonged intermittent hypoxia or chronic hypoxia because hypoxia contributes to sarcopenia in COPD. Molecular biomarkers for senescence were also quantified with FTO depletion in murine myotubes.

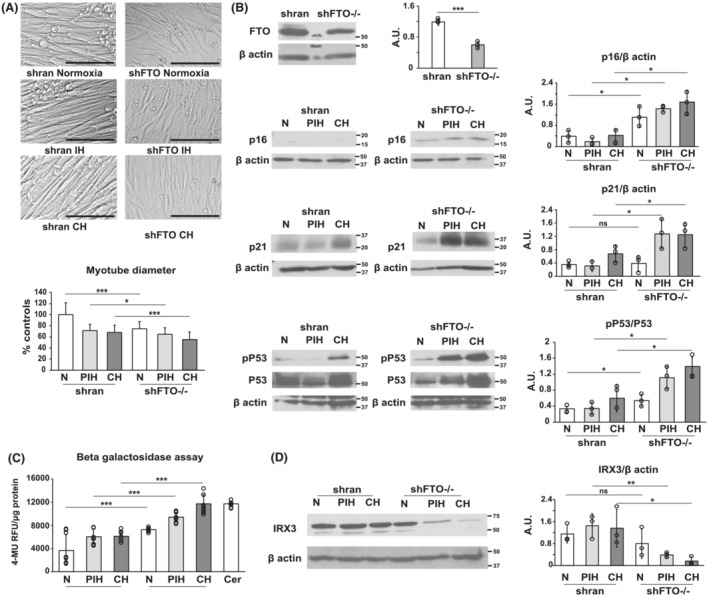
Results: Multiple SNPs located in the FTO gene were associated with sarcopenia in addition to novel SNPs both within and in proximity to the gene AC090771.2, which transcribes long non-coding RNA (lncRNA). To replicate our findings, we performed a GWAS of FFMI in NHW subjects from COPDGene. The SNP most significantly associated with FFMI was on chromosome (chr) 16, rs1558902A > T in the FTO gene (β = 0.151, SE = 0.021, P = 1.40 × 10⁻¹² for UK Biobank |β= 0.220, SE = 0.041, P = 9.99 × 10⁻⁸ for COPDGene) and chr 18 SNP rs11664369C > T nearest to the AC090771.2 gene (β = 0.129, SE = 0.024, P = 4.64 × 10⁻⁸ for UK Biobank |β = 0.203, SE = 0.045, P = 6.38 × 10⁻⁶ for COPDGene). Lower handgrip strength, a measure of muscle strength, but not FFMI was associated with reduced telomere length in the UK Biobank. Experimentally, in vitro knockdown of FTO lowered myotube diameter and induced a senescence-associated molecular phenotype, which was worsened by prolonged intermittent hypoxia and chronic hypoxia.

Conclusions: Genetic polymorphisms of FTO and AC090771.2 were associated with sarcopenia in COPD in independent cohorts. Knockdown of FTO in murine myotubes caused a molecular phenotype consistent with senescence that was exacerbated by hypoxia, a common condition in COPD. Genetic variation may interact with hypoxia and contribute to variable severity of sarcopenia and skeletal muscle molecular senescence phenotype in COPD.

Keywords: Fat mass and obesity gene; Gene knockout; Genetic variability; Murine myotubes; Prolonged intermittent hypoxia; Sarcopenia in COPD.


Conflict of interest statement

No other conflicts of interest.

Figures

Figure 1
Figure 1
Manhattan plots of genes associated with sarcopenia in the UK Biobank. (A) Manhattan plot of genes associated with sarcopenia (defined by FFMI) in the UK Biobank cohort of COPD subjects. Manhattan plot showing P values for SNPs analysed in the UK Biobank cohort of COPD subjects and fat‐free mass index (FFMI). Gene names are identified. The grey dashed line indicates the threshold for genome‐wide significance (P value < 5 × 10−8). (B) Manhattan plot of genes associated with FFMI in the UK Biobank cohort of COPD subjects. Manhattan plot showing P values for SNPs analysed in the UK Biobank cohort of COPD subjects and fat‐free mass index (FFMI). Linear regression was performed. Gene names are identified. The grey dashed line indicates the threshold for genome‐wide significance (P value < 5 × 10−8). (C) Manhattan plot of genes associated with ASMI in the UK Biobank cohort of COPD subjects. Manhattan plot showing P values for SNPs analysed in the UK Biobank cohort of COPD subjects and appendicular skeletal muscle index (ASMI). Linear regression was performed. Gene names are identified. The grey dashed line indicates the threshold for genome‐wide significance (P value < 5 × 10−8). (D) Manhattan plot of genes associated with basal metabolic rate in the UK Biobank cohort of COPD subjects. Manhattan plot showing P values for SNPs analysed in the UK Biobank cohort of COPD subjects and basal metabolic rate. Linear regression was performed. Gene names are identified. The grey dashed line indicates the threshold for genome‐wide significance (P value < 5 × 10−8).
Figure 2
Figure 2
LocusZoom plot of the FTO gene from the UK Biobank. P values of SNPs associated with the FTO gene (log10 scale) for continuous variable FFMI from the UK Biobank. SNP rs7188250 is indicated with a purple arrow. Plot generated with LocusZoom (http://csg.sph.umich.edu/locuszoom/).
Figure 3
Figure 3
PheWAS plots of phenotypes from the UK Biobank. (A) PheWAS plot of phenotypes associated with the FTO gene from the UK Biobank cohort of COPD subjects. PheWAS plot showing P values for phenotypes analysed in the UK Biobank cohort of COPD subjects for the FTO gene. Linear regression was performed. Phenotype names are identified on the x‐axis. Ankle spacing represents ankle width. Arm measures include arm fat mass, fat‐free mass and total mass. Average acceleration represents the physical activity measured by an accelerometer. Cylindrical power represents an eye measurement (autorefraction). FEV1, forced expiratory volume in 1 s; FVC, forced vital capacity. Fraction acceleration represents the acceleration intensity distribution also measured by an accelerometer. BMD, bone mineral density. Heel measures include bone mineral density and heel quantitative ultrasound index. Leg measures include leg fat mass, fat‐free mass and total mass. LogMAR is a visual acuity measure. MCV, mean corpuscular volume. Mean single‐to‐noise ratio is a hearing test. Overall acceleration average represents the average physical activity measured by an accelerometer. Trunk measures represent bone mineral density, fat mass, fat‐free mass and total mass. Three‐millimetre eye measures represent visual acuity measures. Whole‐body measures were zoomed in on to demonstrate significant associations with whole body fat‐free mass, which was used to calculate FFMI in our analysis. (B) PheWAS plot of phenotypes associated with AC090771.1 from the UK Biobank cohort of COPD subjects. PheWAS plot showing P values for phenotypes analysed in the UK Biobank cohort of COPD subjects for the AC090771.1 gene. Linear regression was performed. Phenotype names are identified on the x‐axis. Arm measures include arm fat mass, fat‐free mass and total mass. Average acceleration represents the physical activity measured by an accelerometer. Cylindrical power represents an eye measurement (autorefraction). FEV1 = forced expiratory volume in 1 second. FVC = forced vital capacity. Fraction acceleration represents the acceleration intensity distribution also measured by an accelerometer. BMD, bone mineral density. Heel measures include bone mineral density and heel quantitative ultrasound index. Leg measures include leg fat mass, fat‐free mass and total mass. LogMAR is a visual acuity measure. MCV, mean corpuscular volume. Mean single‐to‐noise ratio is a hearing test. Overall acceleration average represents the average physical activity measured by an accelerometer. Trunk measures represent bone mineral density, fat mass, fat‐free mass and total mass. Three‐millimetre and 6‐mm eye measures represent visual acuity measures. Whole‐body measures were zoomed in on to demonstrate significant associations with whole body fat‐free mass, which was used to calculate FFMI in our analysis.
Figure 4
Figure 4
FTO knockdown in an in vitro model of skeletal muscle results in a sarcopenic phenotype. (A) Representative photomicrographs of differentiated myotubes (shrandom and shFTO) exposed to normoxia (N), prolonged intermittent hypoxia (PIH: 8 h hypoxia/16 h normoxia) and chronic hypoxia (CH) for 72 h. Scale bar is 100 μm. Myotube diameter of differentiated myotubes (shrandom and shFTO) for groups N, PIH and CH. All data mean ± SD from 80 myotubes in four fields for each biologic replicate (n = 3). (B) Representative immunoblots and densitometry of shFTO knockdown. Representative immunoblots and densitometry of biomarkers for senescence: p16 normalized to β‐actin, p21 normalized to β‐actin and phospho‐p53 normalized to total p53. (C) Senescence‐associated β‐galactosidase activity was quantified and expressed as 4‐methylumbelliferone (4‐MU) fluorescence normalized to protein content shran cells exposed to N, PIH and CH, and FTO knockdown cells exposed to N, PIH and CH. Myotubes treated with 100 mM of ceramide serves as a positive control. (D) Representative immunoblots and densitometry of IRX3 normalized to β‐actin. *P < 0.01, **Pp < 0.01, ***P < 0.001 as t‐tests comparing the same groups in shrandom versus shFTO.

References

    1. van Bakel SIJ, Gosker HR, Langen RC, Schols A. Towards personalized management of sarcopenia in COPD. Int J Chron Obstruct Pulmon Dis 2021;16:25–40. - PMC - PubMed
    1. Augustin IML, Franssen FME, Houben‐Wilke S, Janssen DJA, Gaffron S, Pennings HJ, Smeenk FWJM, Pieters WR, Hoogerwerf A, Michels AJ, van Merode F, Wouters EFM, Spruit MA. Multidimensional outcome assessment of pulmonary rehabilitation in traits‐based clusters of COPD patients. PLoS ONE 2022;17:e0263657. - PMC - PubMed
    1. Pei YF, Liu YZ, Yang XL, Zhang H, Feng GJ, Wei XT, Zhang L. The genetic architecture of appendicular lean mass characterized by association analysis in the UK Biobank study. Commun Biol 2020;3:608. - PMC - PubMed
    1. Wan ES, Cho MH, Boutaoui N, Klanderman BJ, Sylvia JS, Ziniti JP, Won S, Lange C, Pillai SG, Anderson WH, Kong X, Lomas DA, Bakke PS, Gulsvik A, Regan EA, Murphy JR, Make BJ, Crapo JD, Wouters EF, Celli BR, Silverman EK, DeMeo D, Evaluation of Chronic Obstructive Pulmonary Disease Longitudinally to Identify Predictive Surrogate End‐Points (ECLIPSE) , Norway‐Bergen cohort , National Emphysema Treatment Trial , COPD Gene investigators . Genome‐wide association analysis of body mass in chronic obstructive pulmonary disease. Am J Respir Cell Mol Biol 2011;45:304–310. - PMC - PubMed
    1. Rabinovich RA, Vilaró J. Structural and functional changes of peripheral muscles in chronic obstructive pulmonary disease patients. Curr Opin Pulm Med 2010;16:123–133. - PMC - PubMed

Publication types