Co-expression prognostic-related genes signature base on propofol and sevoflurane anesthesia predict prognosis and immunotherapy response in glioblastoma
- PMID: 36856519
- PMCID: PMC9979995
- DOI: 10.1080/07853890.2023.2171109
Co-expression prognostic-related genes signature base on propofol and sevoflurane anesthesia predict prognosis and immunotherapy response in glioblastoma
Abstract
Objectives: Anesthetic drugs had been reported may impact the bio-behavior of the tumor. Propofol and sevoflurane are common anesthetics in the operation for glioblastoma (GBM). This study aims to establish a co-expression prognostic-related genes signature base on propofol and sevoflurane anesthesia to predict prognosis and immunotherapy response in GBM.
Method: GPM tissues with different anesthetics gene expression profiles (GSE179004) were obtained from the Gene Expression Omnibus (GEO) database. Core modules and central genes associated with propofol and sevoflurane anesthesia were identified by weighted gene coexpression network analysis (WGCNA) and establish a risk score prognostic model. Immune cell signature analysis in TCGA datasets was predicted via CIBERSORT. At last, serum methylation level of O6-methylguanine-DNA methyltransferase (MGMT) promoter was detected in GPM patient in different time during perioperative period.
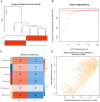
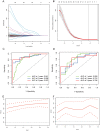
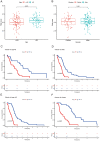
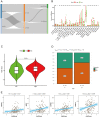
Results: The burlywood1 group screened was significantly associated with sevoflurane-treated GBM tissue. 22 independent prognostic differential genes were construct a prognostic-related genes risk score in GBM, and showed good predictive ability. The risk score was strongly correlated with the age of the patients, but not with the sex of the patients. In addition, the differential responses to immunotherapy in high and low risk groups were analyzed, indicating that sevoflurane signature genes were consistent in the classification of gliomas. High-risk patients have high T-cell damage score and are less sensitive to immunotherapy. At last, serum methylation level of MGMT promoter was decreased in GBM patients during propofol and sevoflurane anesthesia.
Conclusions: Propofol and sevoflurane anesthesia associated impact on the gene expression of GBM, included the methylation level of MGMT promoter. Propofol and sevoflurane anesthesia-based risk score prognostic model, which has good prognostic power and is an independent prognostic factor in GBM patients. Therefore, this model can be used as a new biomarker for judging the prognosis of GBM patients.KEY MESSAGESPropofol and sevoflurane anesthesia-based risk score prognostic model has good prognostic power and is an independent prognostic factor in GBM patients.High Propofol and sevoflurane anesthesia-based risk score GBM patients have high T-cell damage scores and are less sensitive to immunotherapy.Serum methylation level of MGMT promoter decrease during propofol and sevoflurane anesthesia in GBM patients.
Keywords: Glioblastoma; MGMT; prognosis; propofol; sevoflurane.
Conflict of interest statement
No potential conflict of interest was reported by the author(s).
Figures


References
-
- McKinnon C, Nandhabalan M, Murray SA, et al. Glioblastoma: clinical presentation, diagnosis, and management. BMJ. 2021;374:n1560. - PubMed
-
- Lah TT, Novak M, Breznik B.. Brain malignancies: glioblastoma and brain metastases. Semin Cancer Biol. 2020;60:262–273. - PubMed
-
- Ma R, Taphoorn MJB, Plaha P.. Advances in the management of glioblastoma. J Neurol Neurosurg Psychiatry. 2021;92(10):1103–1111. - PubMed
Publication types
MeSH terms
Substances
LinkOut - more resources
Full Text Sources
Other Literature Sources
Medical
Research Materials
