. 2023 Apr;37(4):e22835.
doi: 10.1096/fj.202200785RR.

Na/K-ATPase signaling tonically inhibits sodium reabsorption in the renal proximal tubule

Affiliations

Na/K-ATPase signaling tonically inhibits sodium reabsorption in the renal proximal tubule

Shreya T Mukherji et al. FASEB J. 2023 Apr.

Abstract

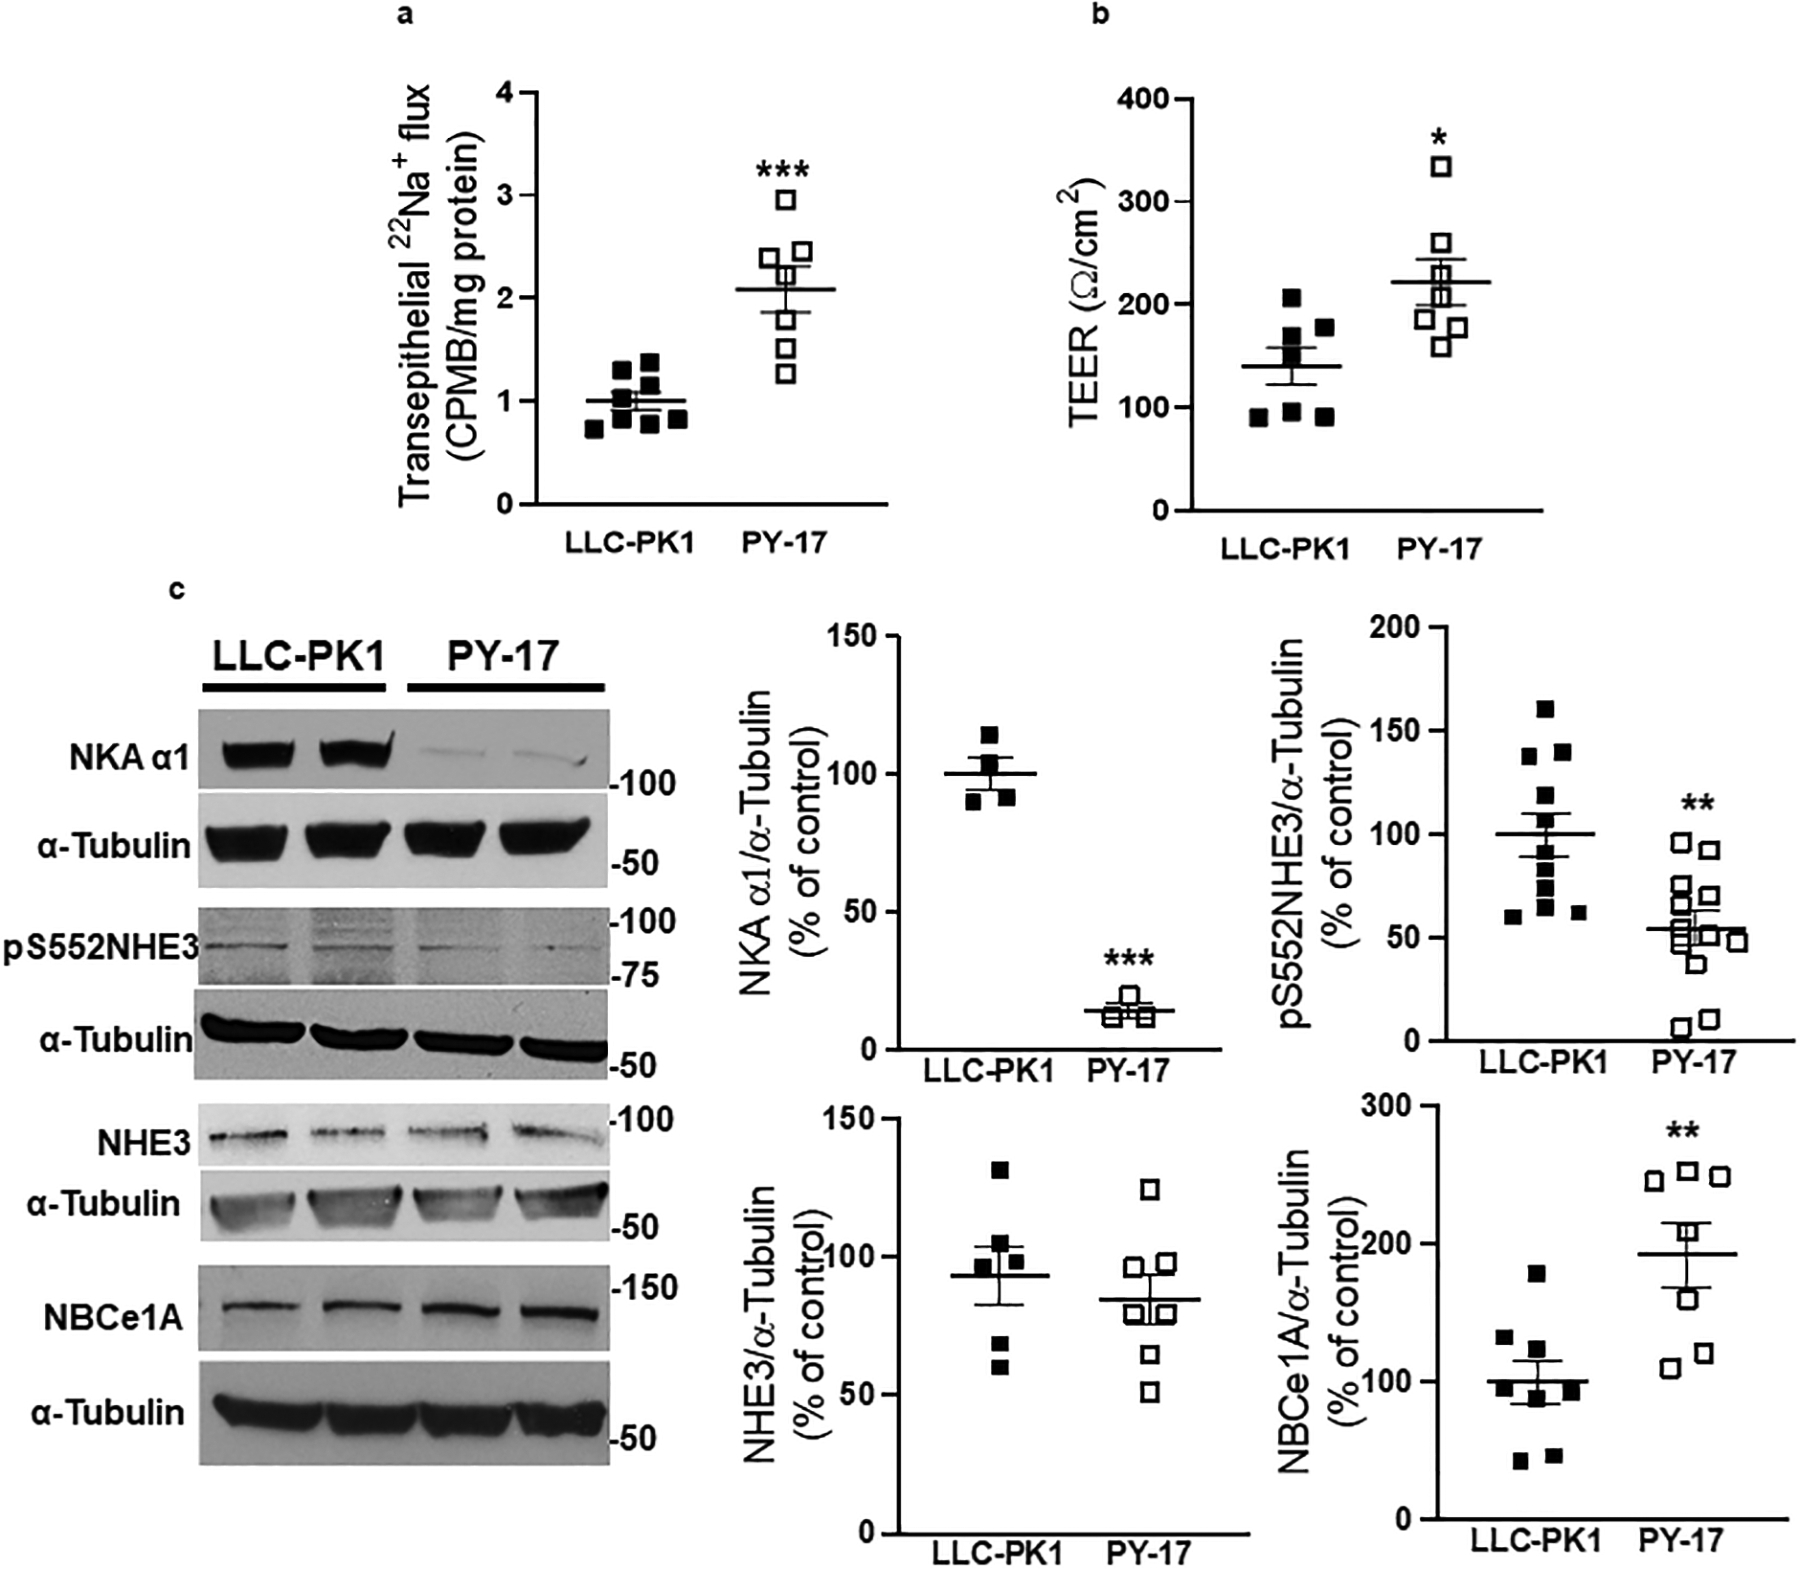
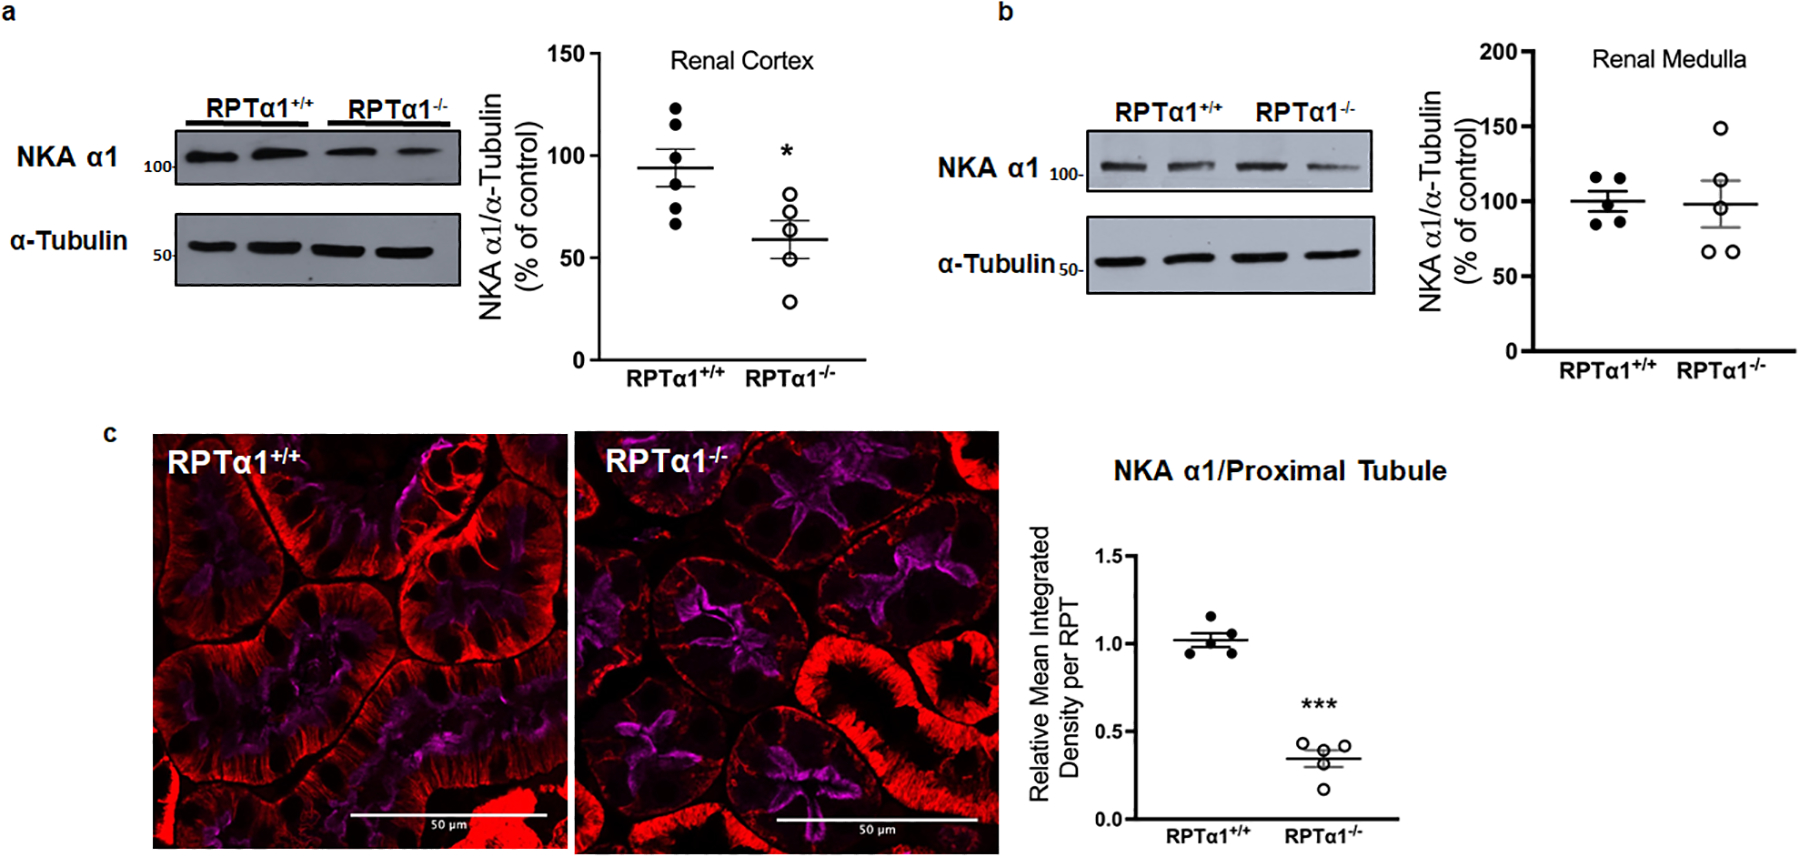
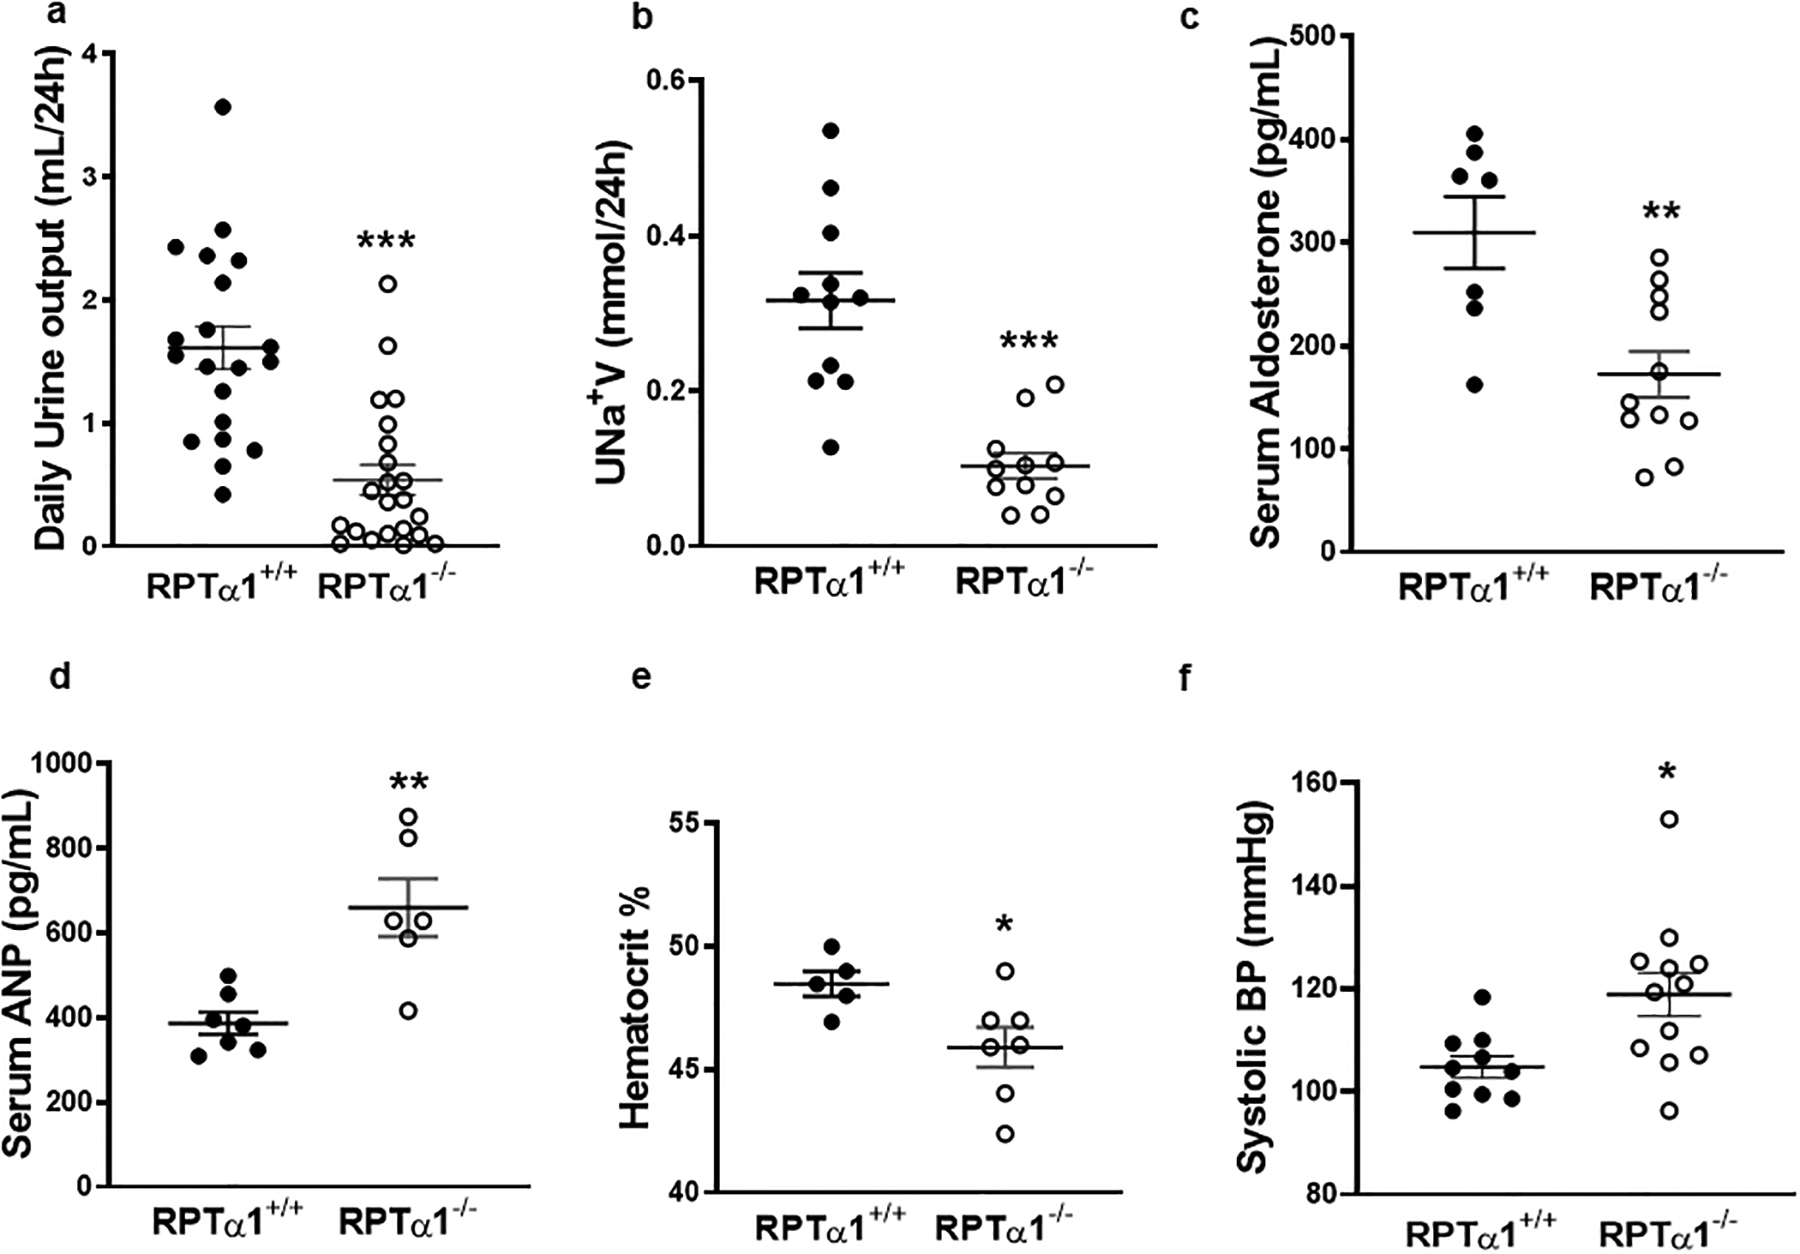
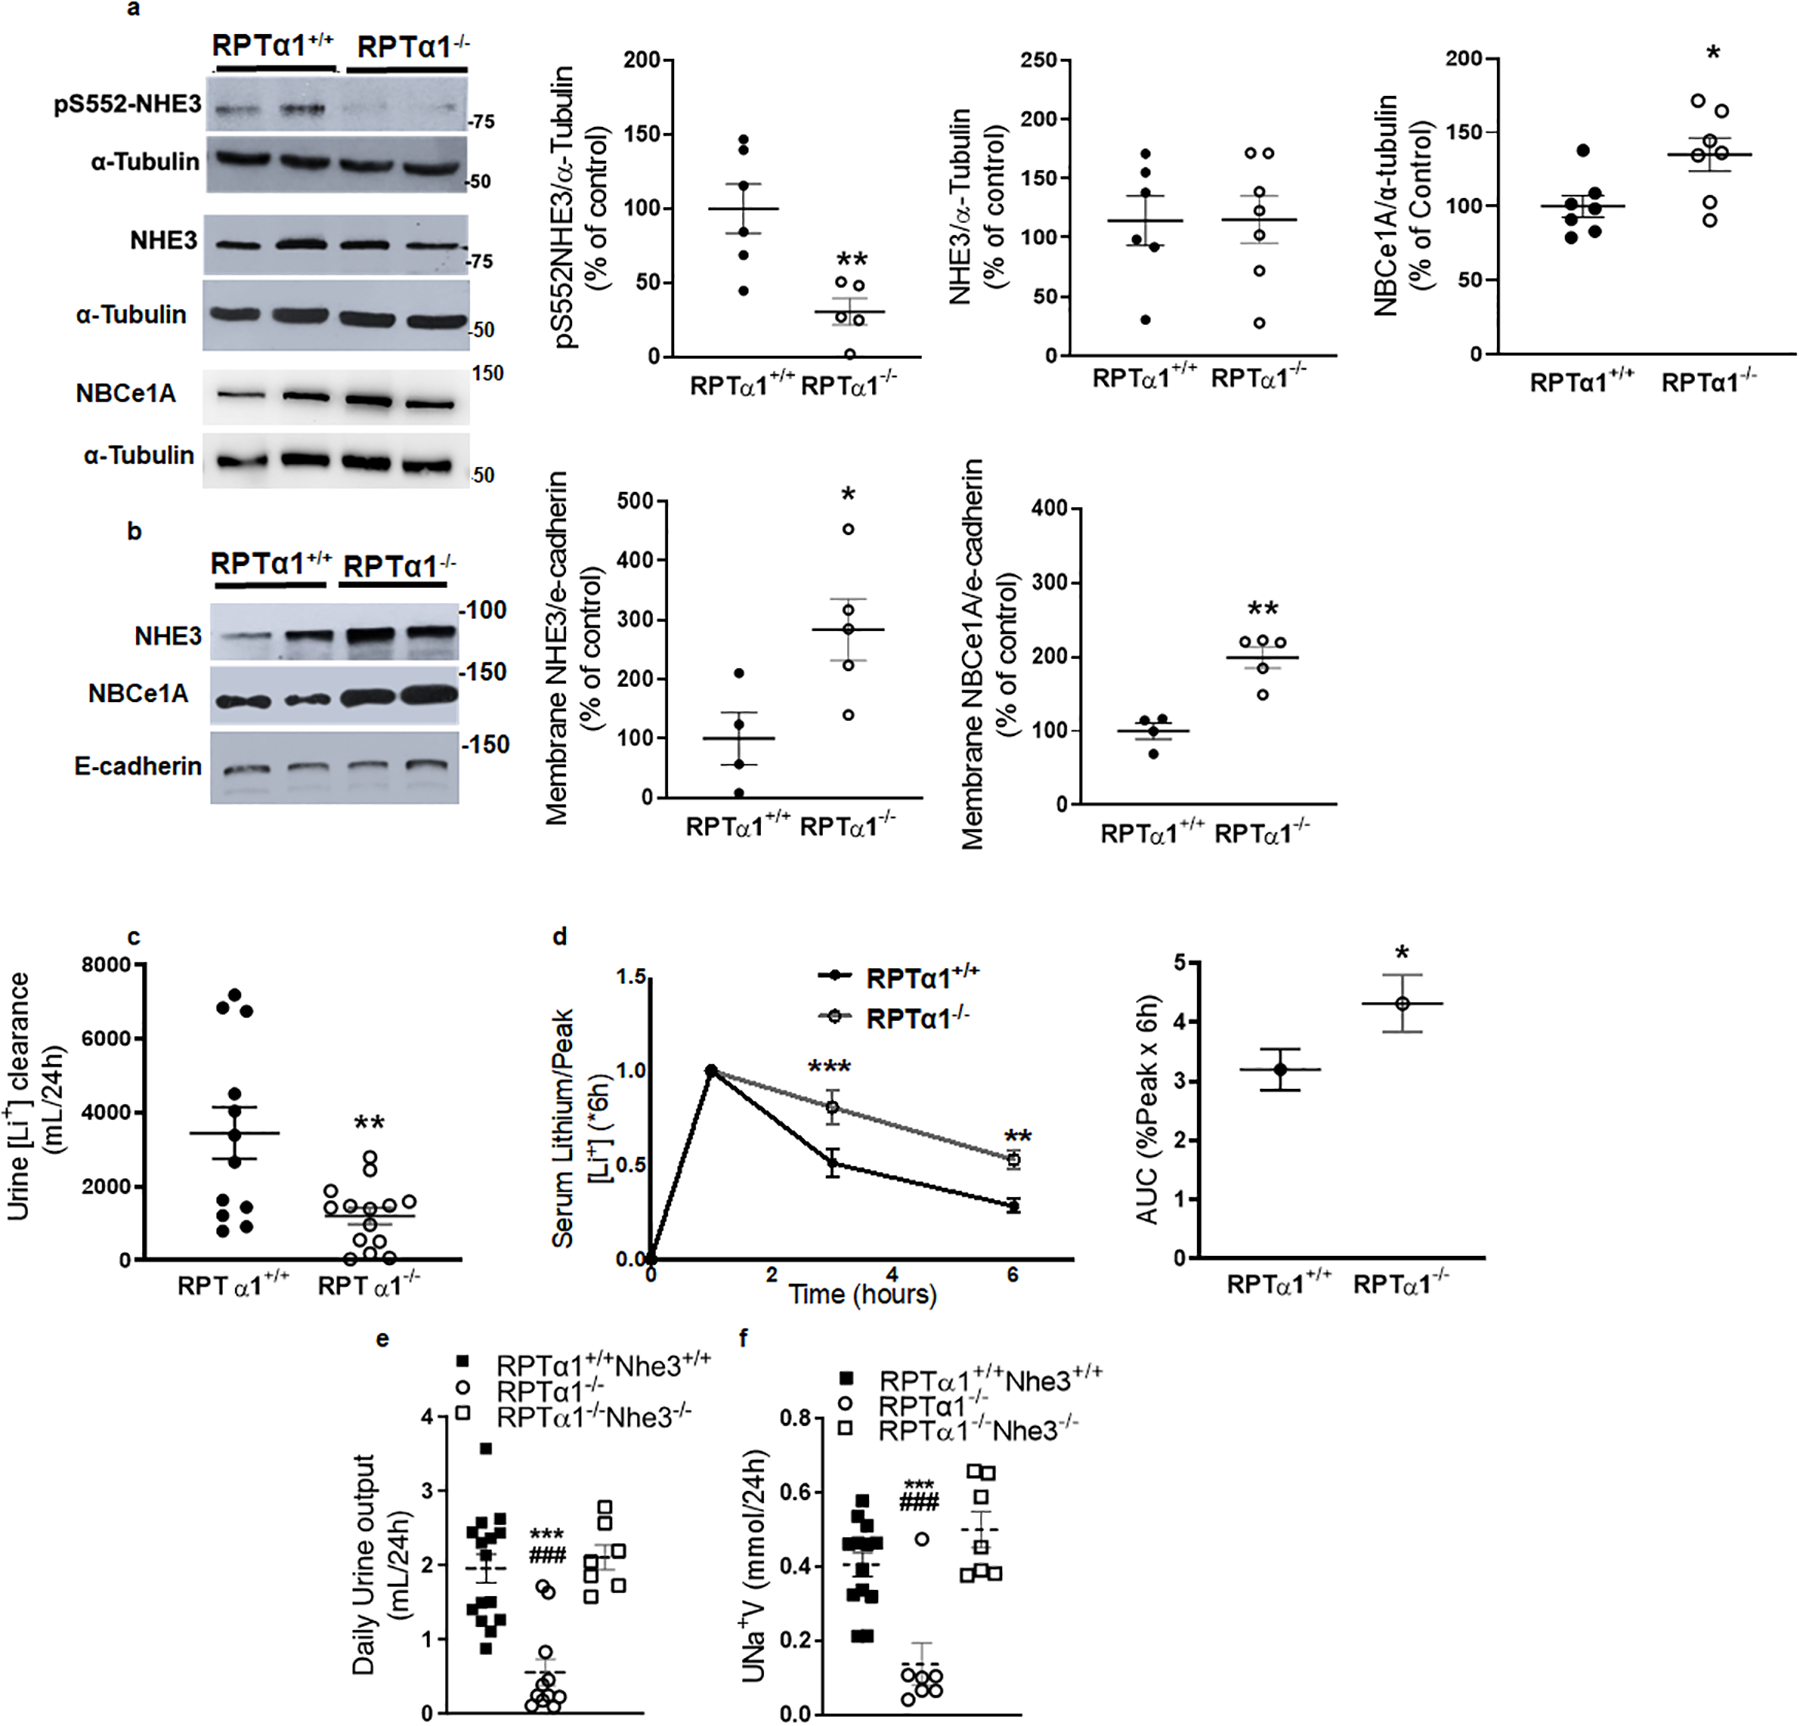
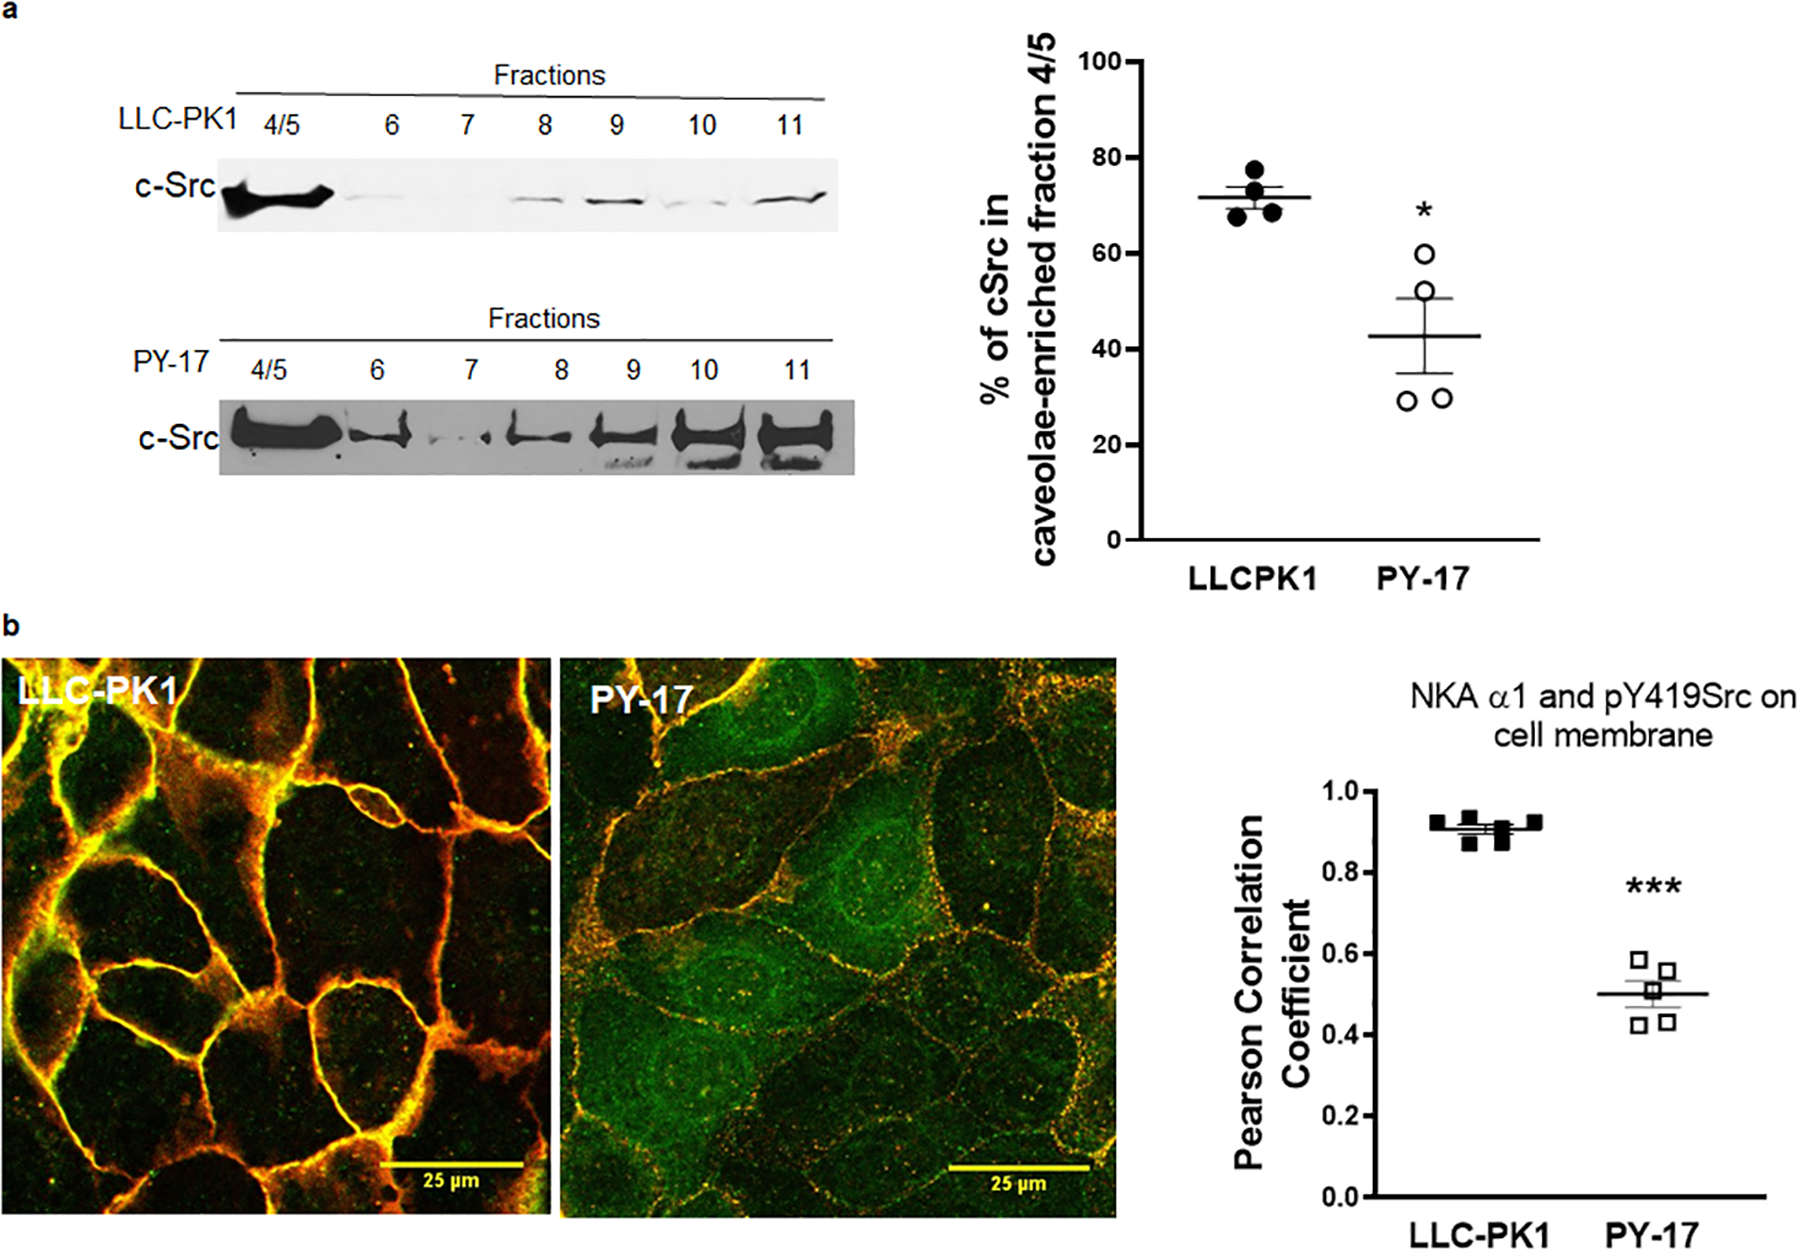
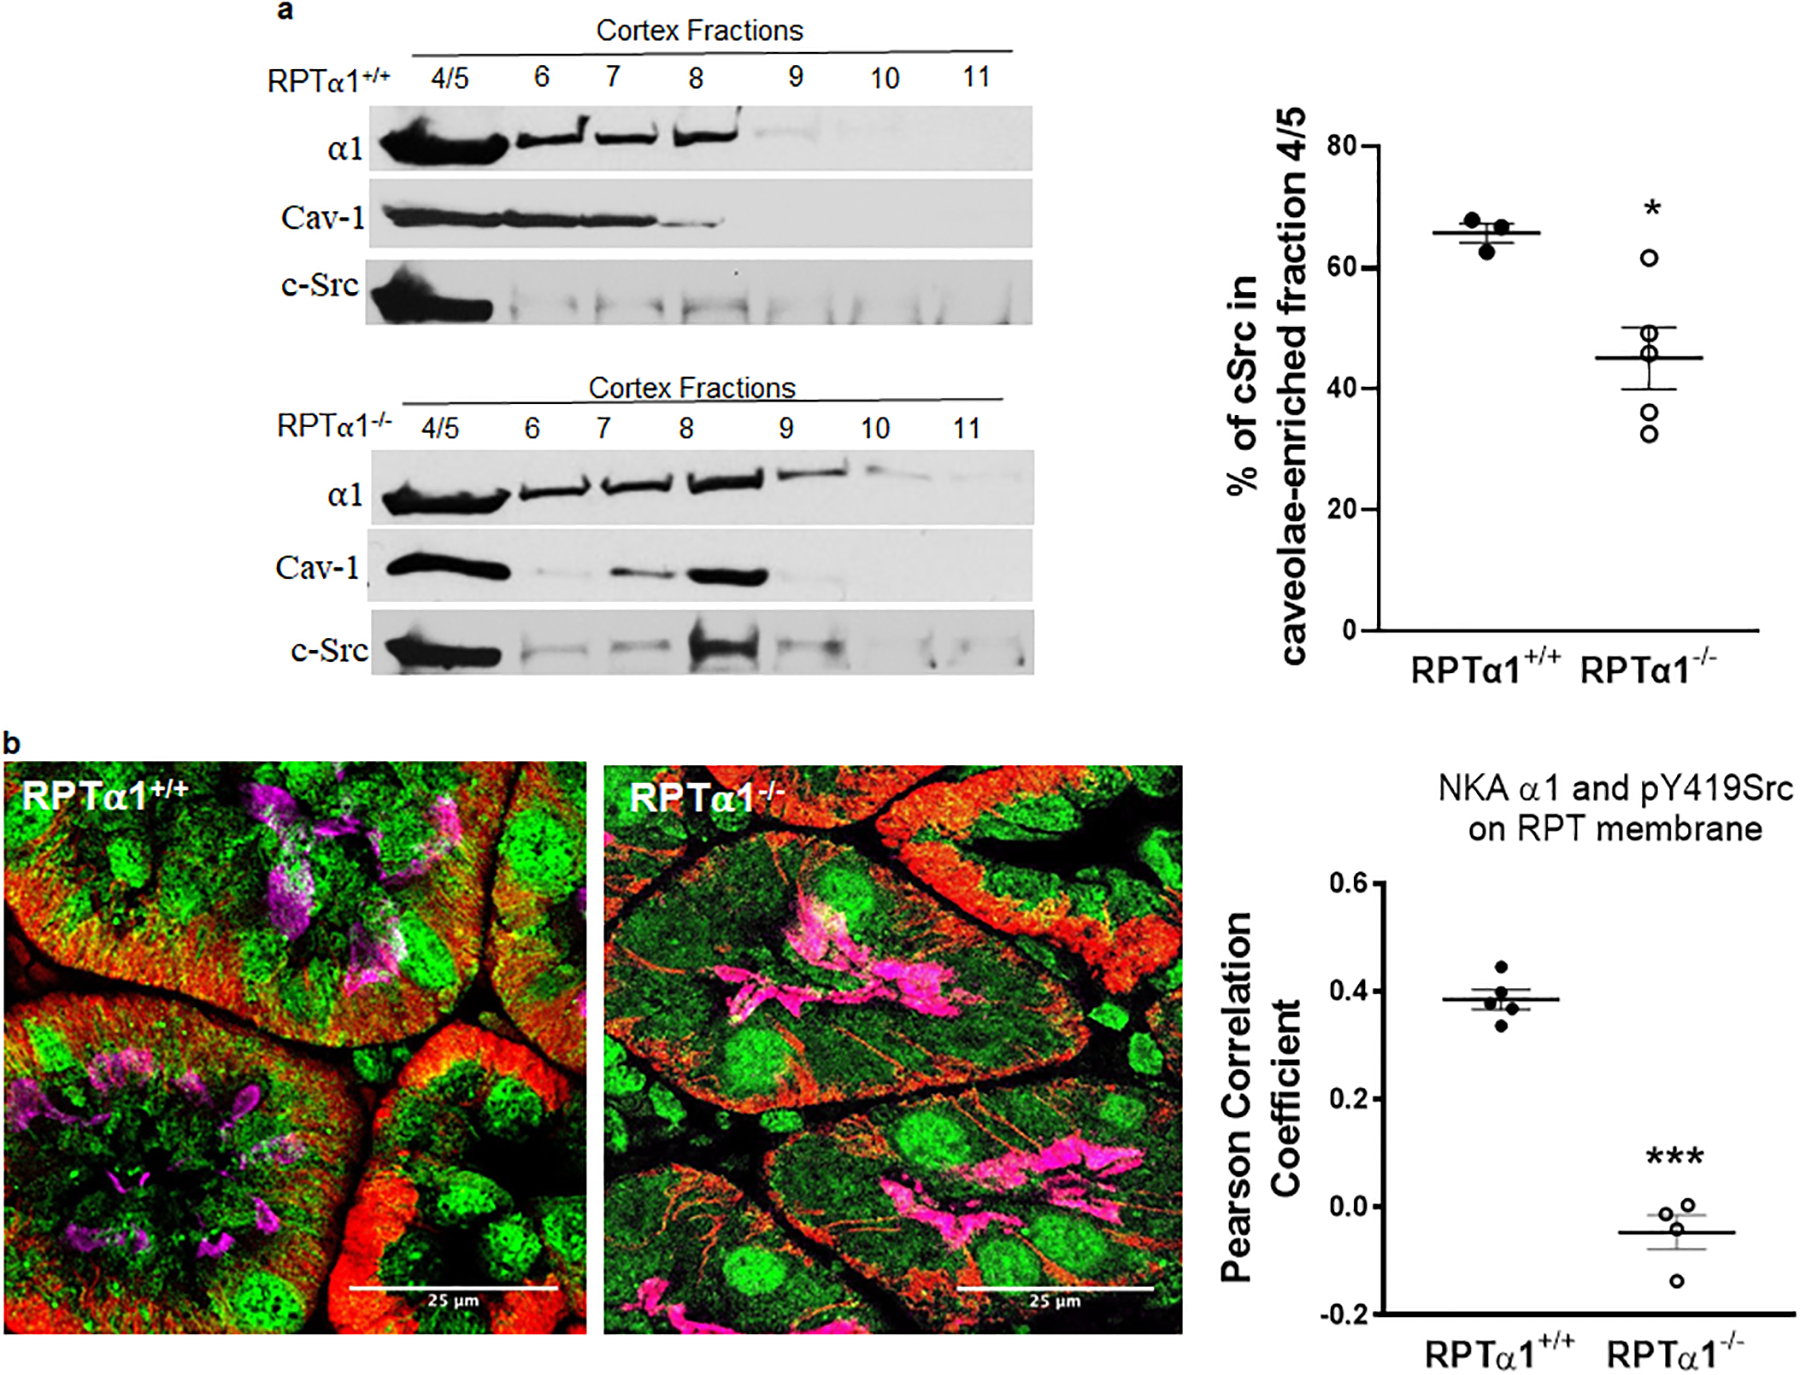
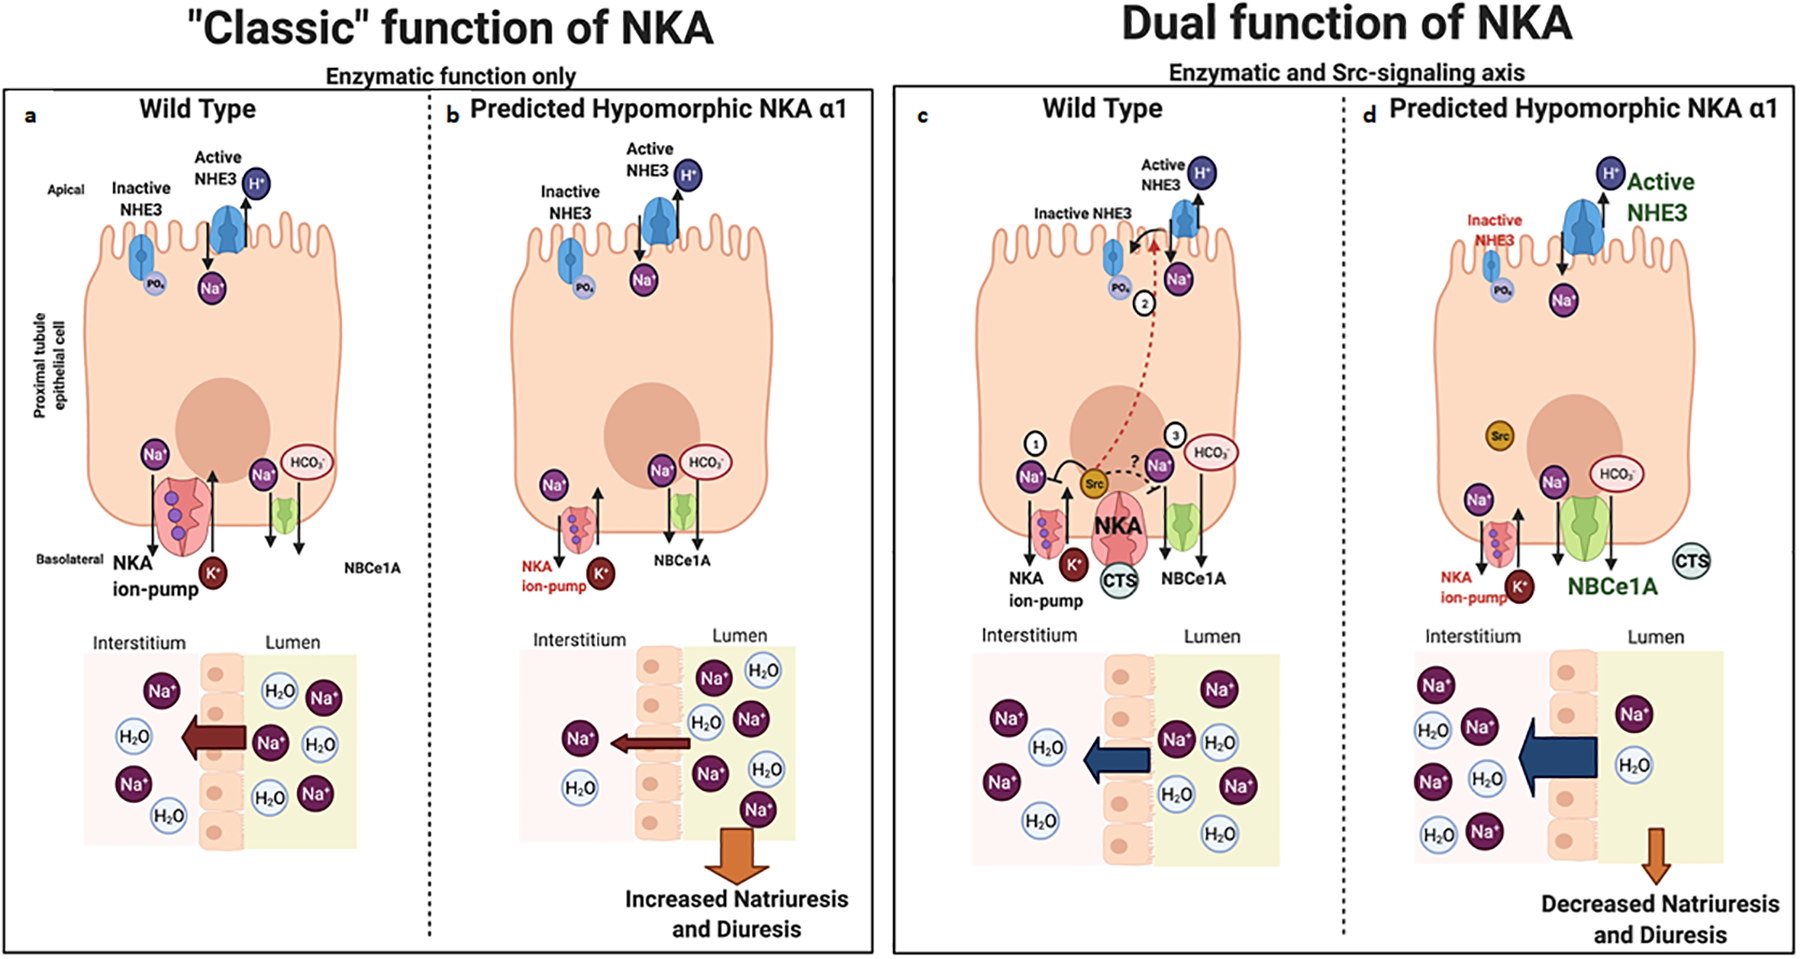
Through its classic ATP-dependent ion-pumping function, basolateral Na/K-ATPase (NKA) generates the Na+ gradient that drives apical Na+ reabsorption in the renal proximal tubule (RPT), primarily through the Na+ /H+ exchanger (NHE3). Accordingly, activation of NKA-mediated ion transport decreases natriuresis through activation of basolateral (NKA) and apical (NHE3) Na+ reabsorption. In contrast, activation of the more recently discovered NKA signaling function triggers cellular redistribution of RPT NKA and NHE3 and decreases Na+ reabsorption. We used gene targeting to test the respective contributions of NKA signaling and ion pumping to the overall regulation of RPT Na+ reabsorption. Knockdown of RPT NKA in cells and mice increased membrane NHE3 and Na+ /HCO3 - cotransporter (NBCe1A). Urine output and absolute Na+ excretion decreased by 65%, driven by increased RPT Na+ reabsorption (as indicated by decreased lithium clearance and unchanged glomerular filtration rate), and accompanied by elevated blood pressure. This hyper reabsorptive phenotype was rescued upon crossing with RPT NHE3-/- mice, confirming the importance of NKA/NHE3 coupling. Hence, NKA signaling exerts a tonic inhibition on Na+ reabsorption by regulating key apical and basolateral Na+ transporters. This action, lifted upon NKA genetic suppression, tonically counteracts NKA's ATP-driven function of basolateral Na+ reabsorption. Strikingly, NKA signaling is not only physiologically relevant but it also appears to be functionally dominant over NKA ion pumping in the control of RPT reabsorption.

Keywords: Na/K-ATPase; proximal tubule; salt-sensitive hypertension; signaling; sodium transport.


Conflict of interest statement

DISCLOSURES

The authors declare no conflicts of interest.

Figures

FIGURE 1.
FIGURE 1.. Genetic ablation of NKA α1 (90%) in renal epithelial cells elicits increased transepithelial Na+ transport, decreased NHE3 phosphorylation (pS552, inactivation), and increased total NBCe1A protein.
Transepithelial 22Na-flux (relative to average of control LLC-PK1 cells, n=8) (a) and Transepithelial Electrical Resistance (TEER) were measured in polarized monolayers of NKA knockdown (PY-17) or parental wild type LLC-PK1 cells (b). Representative films from western blots for NKA α1, pS552-NHE3, total NHE3, and total NBCe1A and their respective protein quantitation (c). All quantifications were normalized to α-tubulin followed by normalization to average of control values per gel. Results are presented as mean±SEM, and data were analyzed using Student’s t-test. *p< 0.05, **p<0.01 and ***p<0.001 versus LLC-PK1.
FIGURE 2.
FIGURE 2.. NKA α1 protein expression in the kidneys of RPT α1 hypomorphic mice (RPTα1−/−).
Representative western blots and quantification of NKA α1 in renal cortex homogenates from RPTα1−/− and RPTα1+/+ mice (a). Representative western blots and quantification of NKA α1 in renal medulla homogenates from RPTα1−/− and RPTα1+/+ mice (b). All quantifications were normalized to α-tubulin followed by normalization to the average of control values in each gel. Representative immunostaining of RPT for NKA α1 (red), RPT brush-border marker Villin-1 (magenta), in kidney cross-section and quantitation of NKA α1 in villin-1-stained RPT (n=5) for RPTα1−/− and RPTα1+/+ (c). Scale bar: 50 μm. Adult 4-month RPTα1−/− and RPTα1+/+ controls were used. Results are presented as mean±SEM and data were analyzed by a Student’s t-test. *p< 0.05, ***p<0.001 versus RPTα1+/+
FIGURE 3.
FIGURE 3.. Renal sodium handling in RPTα1−/− mice.
Four-month-old male and female mice were used to assess daily urine output (a) and absolute Na+ excretion (UNa+V) expressed as UNa+V = Urine [Na+] (mmol/mL) × Urine volume (mL/24h) (b). Serum aldosterone (c), serum atrial natriuretic peptide (ANP) (d), hematocrit (e), and systolic blood pressure (f) were measured in 4-month-old male mice of the indicated genotype. Results are presented as mean ± SEM. Data were analyzed by Student’s t-test. *p < 0.05, **p<0.01, and ***p<0.001 versus RPTα1+/+.
FIGURE 4.
FIGURE 4.. RPT Na+ transporters and Na+ reabsorption in RPTα1−/−.
Protein expression and corresponding representative films from western blots for pS552-NHE3, total NHE3, and total NBCe1A proteins in RPTα1+/+ and RPTα1−/− mouse renal cortex homogenates. All quantifications were normalized to α-tubulin followed by normalization to average of control values (a). Protein expression and corresponding representative films from western blots for NHE3 and NBCe1A in membranes isolated from renal cortex of RPTα1+/+ and RPTα1−/− mouse kidneys. All quantifications were normalized to E-cadherin (membrane protein marker) followed by normalization to average of control values (b). Urine Li+ clearance as a functional marker for RPT Na+ reabsorption function in 4-month male mice of the indicated genotype (n=11–14) (c). Serum Li+ clearance (CLi+) curve and quantification of area under the curve (AUC) are shown (d). The CLi+ curve and AUC are normalized to peak dose in serum measured at 1hr (n=6–8, 4-month male). (e) Daily urine output measured in 4-month male mice using metabolic cage and (f) Absolute Na+ excretion (UNa+V) RPTα1−/−Nhe3−/− mice compared to RPTα1−/− and controls (RPTα1+/+Nhe3+/+). UNa+V = Urine [Na+] (mmol/mL) × Urine volume (mL/24h). Results are presented as mean ±SEM and data were analyzed by Student’s t-test (a-d) or one-way ANOVA followed by Tukey’s multiple comparisons test (e-f). *p<0.05, **<p<0.01, and ***p<0.001 vs RPTα1+/+or RPTα1+/+NHE3+/+, ### p<0.001 vs RPTα1−/−NHE3−/−.
FIGURE 5.
FIGURE 5.. Loss of NKA α1 leads to dismantlement of NKA/Src receptor complex in RPT cells.
Representative western blot for c-Src (n=4) in caveolin-enriched fractions (4/5) together with fractions 6–11 obtained after sucrose-density fractionation in LLC-PK1 and PY-17 cells and the respective quantitation of percentage of signals from caveolin-enriched fraction against total signal (a). Representative immunofluorescent staining for NKA α1 (red) and phosphoTyr419-Src (green) in LLC-PK1 and PY-17 cells and quantification of the Pearson correlation coefficient of their colocalization on RPT cell membrane (b). Scale bar: 25μm. Results are presented as mean±SEM and data were analyzed by t-test. *p< 0.05, *** p<0.001.
FIGURE 6.
FIGURE 6.. Loss of NKA α1 leads to dismantlement of NKA/Src receptor complex in RPTα1−/− mouse kidney.
Representative western blot for NKA α1 (n=2), caveolin-1 (n=3–4), and c-Src (n=3–4) in caveolin-enriched fractions (4/5) together with fractions 6–11 obtained after sucrose-density fractionation of renal cortices from RPTα1+/+ and RPTα1−/− and the respective quantitation of percentage of signals from caveolin-enriched fraction against total signal (a). Representative immunostaining for NKA α1 (red), phosphoTyr419-Src (green), and villin-1 (magenta) in kidney cross-sections from RPTα1+/+ and RPTα1−/− and the quantification of the Pearson correlation coefficient of their colocalization on RPT membrane (b). Scale bar: 25 μm. Results are presented as mean±SEM and data were analyzed by t-test. *p< 0.05, ***p<0.001 versus RPTα1+/+.
FIGURE 7
FIGURE 7. Classic vs dual function of NKA in RPT Na+ reabsorption and corresponding predicted phenotype of the hypomorphic RPTα1−/− mouse.
The classical role of basolateral NKA in RPT Na+ transport is that of solely an enzymatic ion-pump that drives the Na+ gradient and transport. The apical NHE3 exchanger is the major route for Na+ reabsorption in the RPT, with basolateral NBCe1A playing a more modest role (a). Based on this classical role, a knockdown of NKA α1 in RPT would be expected to result in hypo-absorption of Na+ and water, and increased natriuresis and diuresis in the hypomorphic RPTα1−/− mice (b). According to the dual function model of NKA, NKA/Src receptor-mediated signaling plays a counteractive role over its enzymatic function such that stimulation of NKA/Src signaling by endogenous ligands such as cardiotonic steroids (CTS) leads to internalization of basolateral NKA ion-pump (1), stimulates phosphorylation-mediated inactivation of apical NHE3 prior to internalization (2), and decreases membrane expression of basolateral NBCe1A as an independent mechanism or secondary to NHE3 reduction (3) leading to tonic inhibition of RPT Na+ reabsorption (c). Based on the dual function of NKA, a loss of NKA/Src receptor function in the hypomorphic RPTα1−/− mouse would be expected to result in a dismantled NKA/Src receptor complex leading to an increased membrane expression of RPT NHE3 and NBCe1A, and thereby promoting reabsorption of Na+ and water (d). The hyper-absorptive phenotype of the hypomorphic RPTα1−/− mice is consistent with the dual function model, and further indicates that NKA/Src receptor is functionally dominant over the classic enzymatic NKA function in RPT Na+ reabsorption. CTS: cardiotonic steroids; NKA: Na+/K+-ATPase; NBCe1A: electrogenic Na+/HCO3 cotransporter, isoform 1A; NHE3: Na+/H+ exchanger 3. Created with BioRender.com

Similar articles

Cited by

References

    1. McDonough AA. Mechanisms of proximal tubule sodium transport regulation that link extracellular fluid volume and blood pressure. Am J Physiol Regul Integr Comp Physiol. 2010; 298:R851–861. - PMC - PubMed
    1. McDonough AA, Nguyen MT. Maintaining Balance Under Pressure: Integrated Regulation of Renal Transporters During Hypertension. Hypertension. 2015; 66:450–455. - PMC - PubMed
    1. Cheval L, Doucet A. Measurement of Na-K-ATPase-mediated rubidium influx in single segments of rat nephron. Am J Physiol. 1990; 259:F111–121. - PubMed
    1. Kurtz I, Zhu Q. Structure, function, and regulation of the SLC4 NBCe1 transporter and its role in causing proximal renal tubular acidosis. Curr Opin Nephrol Hypertens. 2013; 22:572–583. - PMC - PubMed
    1. Sciortino CM, Romero MF. Cation and voltage dependence of rat kidney electrogenic Na(+)-HCO(−)(3) cotransporter, rkNBC, expressed in oocytes. Am J Physiol. 1999; 277:F611–623. - PubMed

Publication types

LinkOut - more resources