Trends in Prevalence and Incidence of Alopecia Areata, Alopecia Totalis, and Alopecia Universalis Among Adults and Children in a US Employer-Sponsored Insured Population
- PMID: 36857069
- PMCID: PMC9979012
- DOI: 10.1001/jamadermatol.2023.0002
Trends in Prevalence and Incidence of Alopecia Areata, Alopecia Totalis, and Alopecia Universalis Among Adults and Children in a US Employer-Sponsored Insured Population
Abstract
Importance: Alopecia areata (AA) is characterized by nonscarring hair loss of the scalp, face, and/or body. Alopecia totalis (AT) and alopecia universalis (AU) involve complete loss of the scalp and body hair, respectively. The epidemiology of AA in the US remains unclear, having previously been extrapolated from older studies that were limited to specific geographic areas or clinical settings, or from self-reported data.
Objective: To estimate the annual prevalence and incidence of AA and AT and/or AU (AT/AU) in the US.
Design, setting, and participants: This retrospective, population-based cohort study was conducted from January 2016 to December 2019 and included enrollees in the IBM MarketScan Commercial Claims and Encounters and Medicare Supplemental databases and their dependents, with plan enrollment during each study calendar year and the year prior.
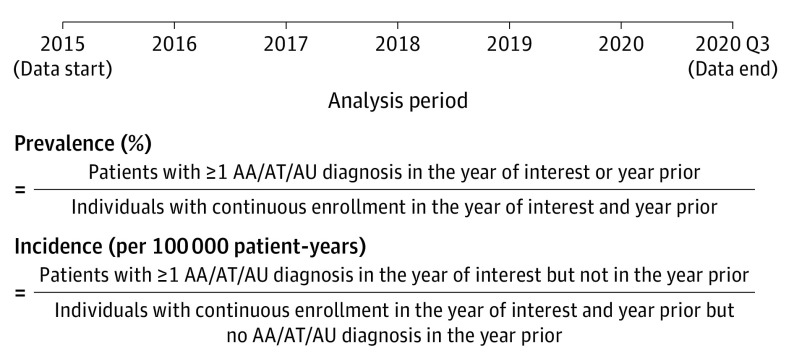
Exposures: Prevalent cases were identified by 1 or more claims for AA or AT/AU (International Statistical Classification of Diseases, Tenth Revision, Clinical Modification [ICD-10-CM] codes L63.x, L63.0, L63.1) during each year of interest or the year prior. Incident cases were identified by 1 or more claims for AA or AT/AU during a specific year and no diagnosis the year prior.
Main outcomes and measures: Annual incidence and prevalence rates were calculated and stratified by age, sex, and region. National employer-sponsored insurance population estimates were obtained using population-based weights.
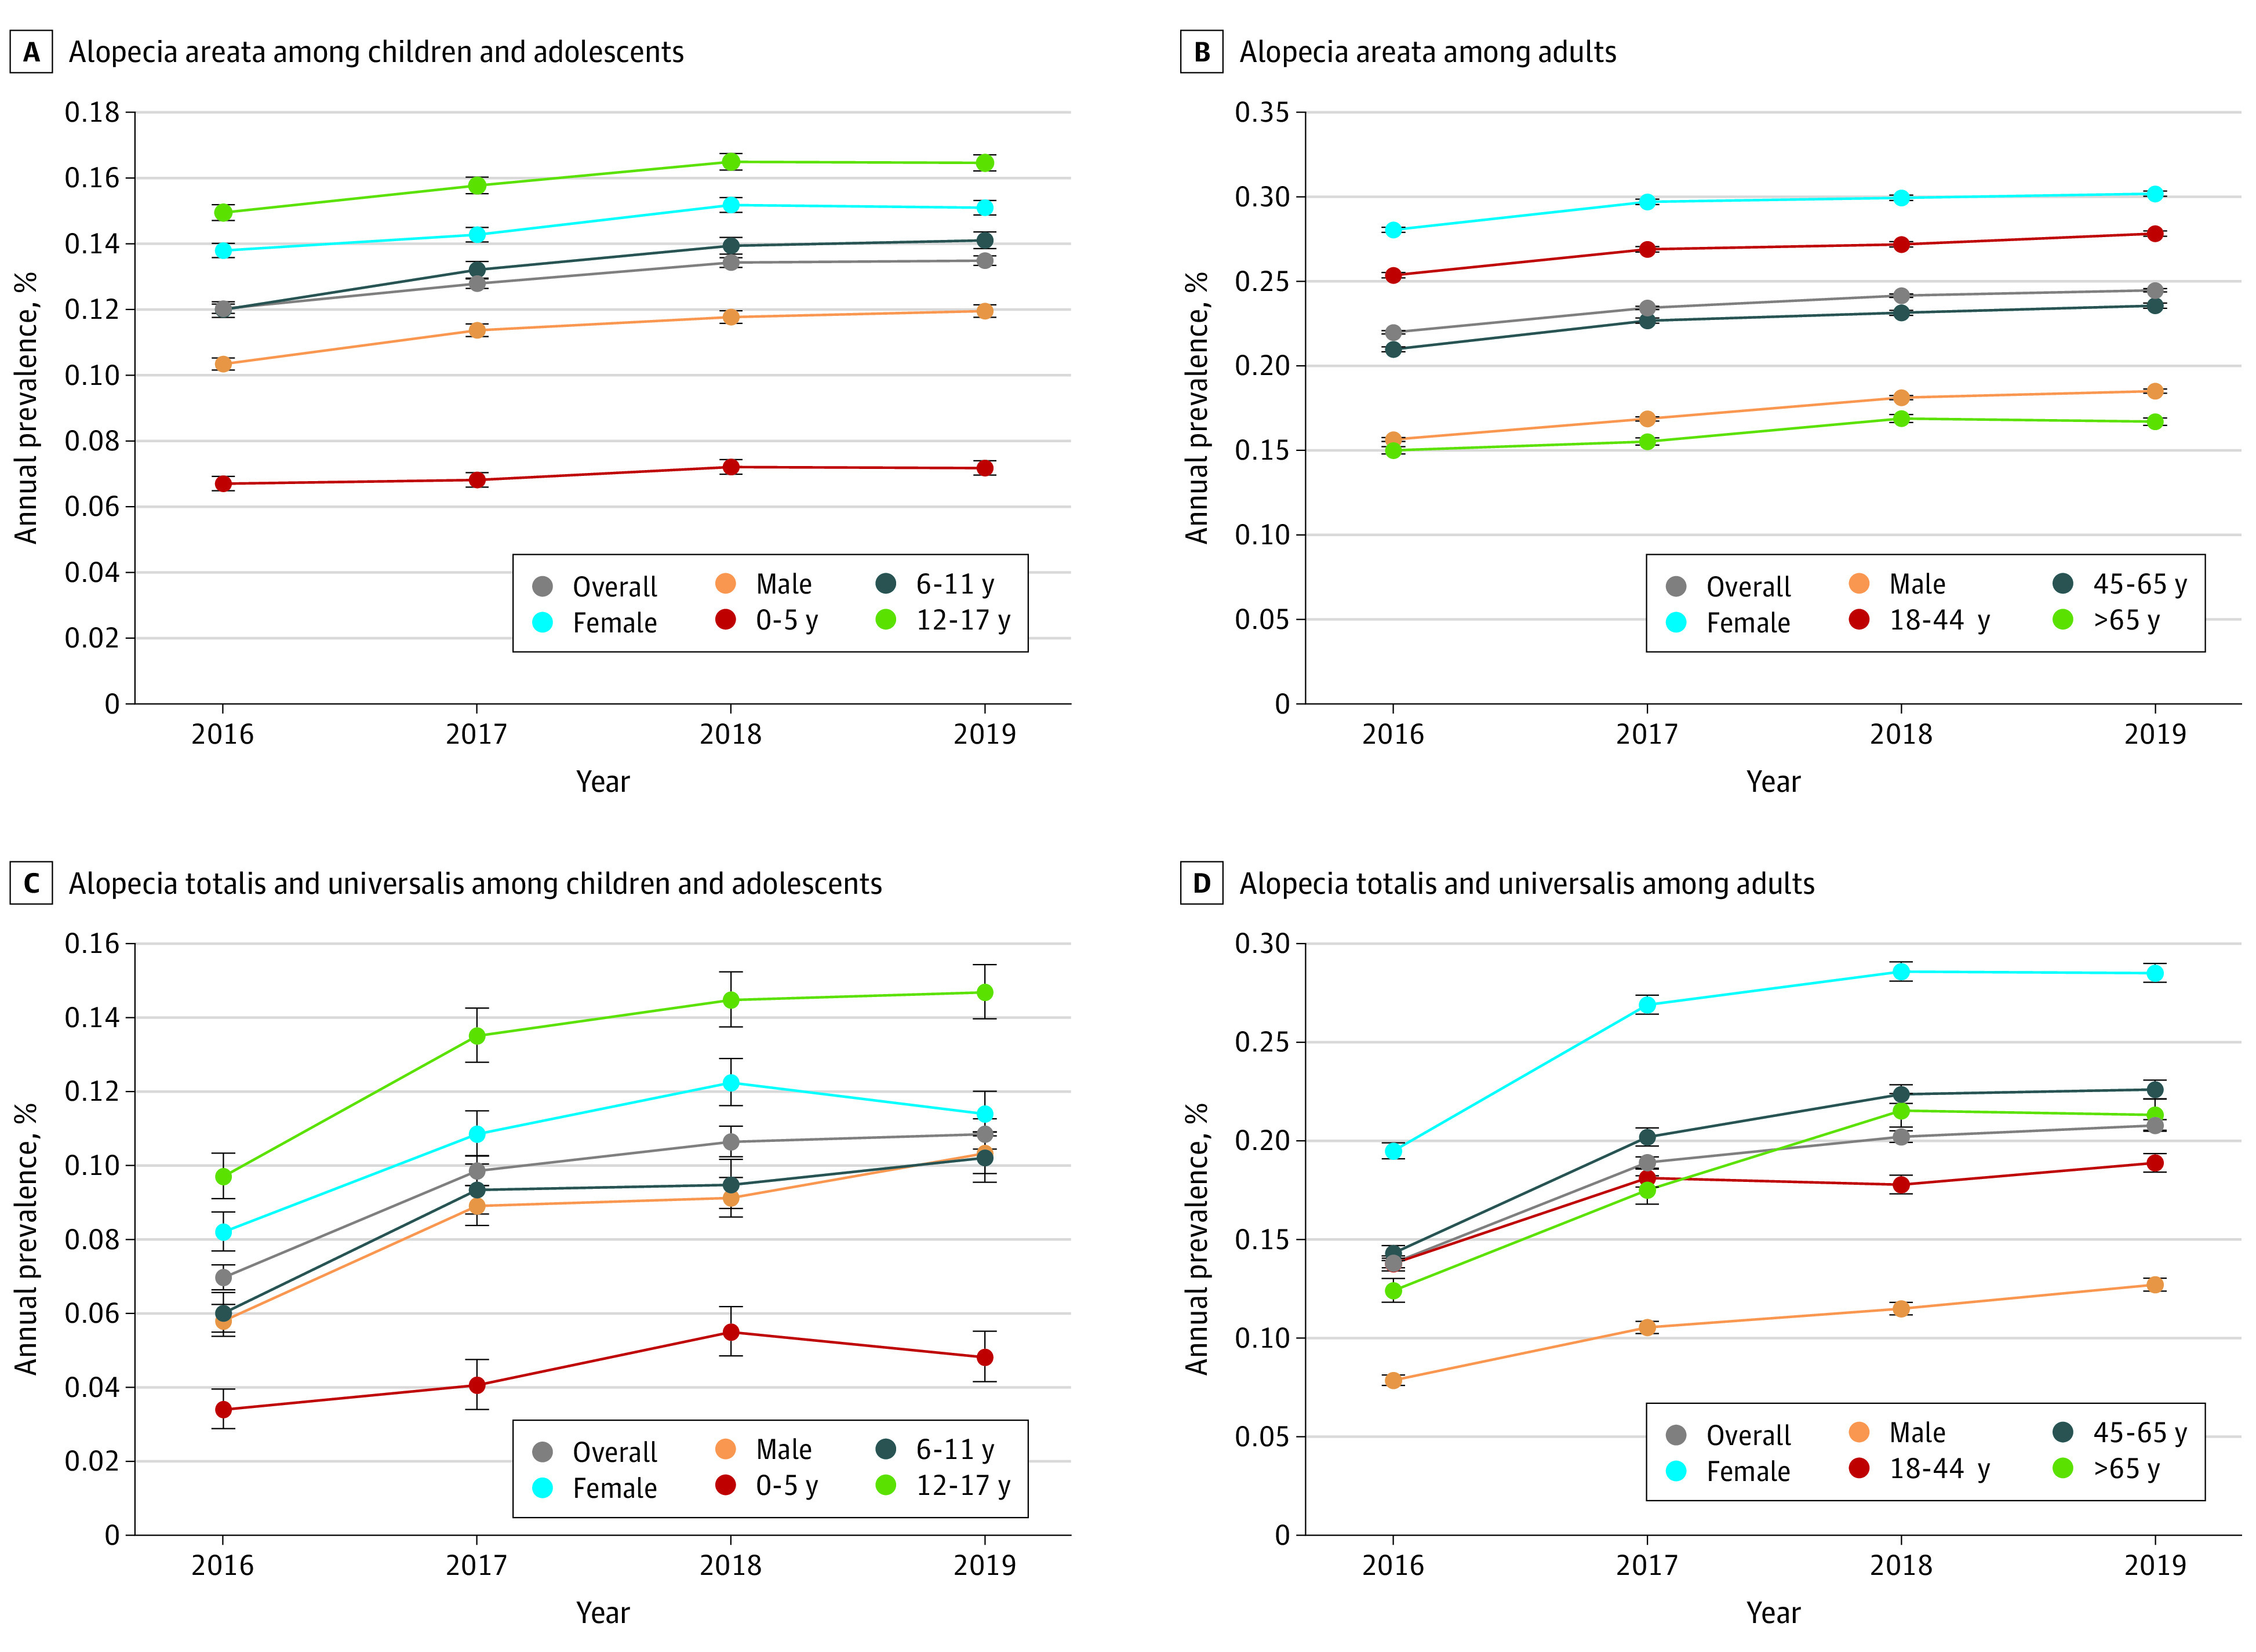
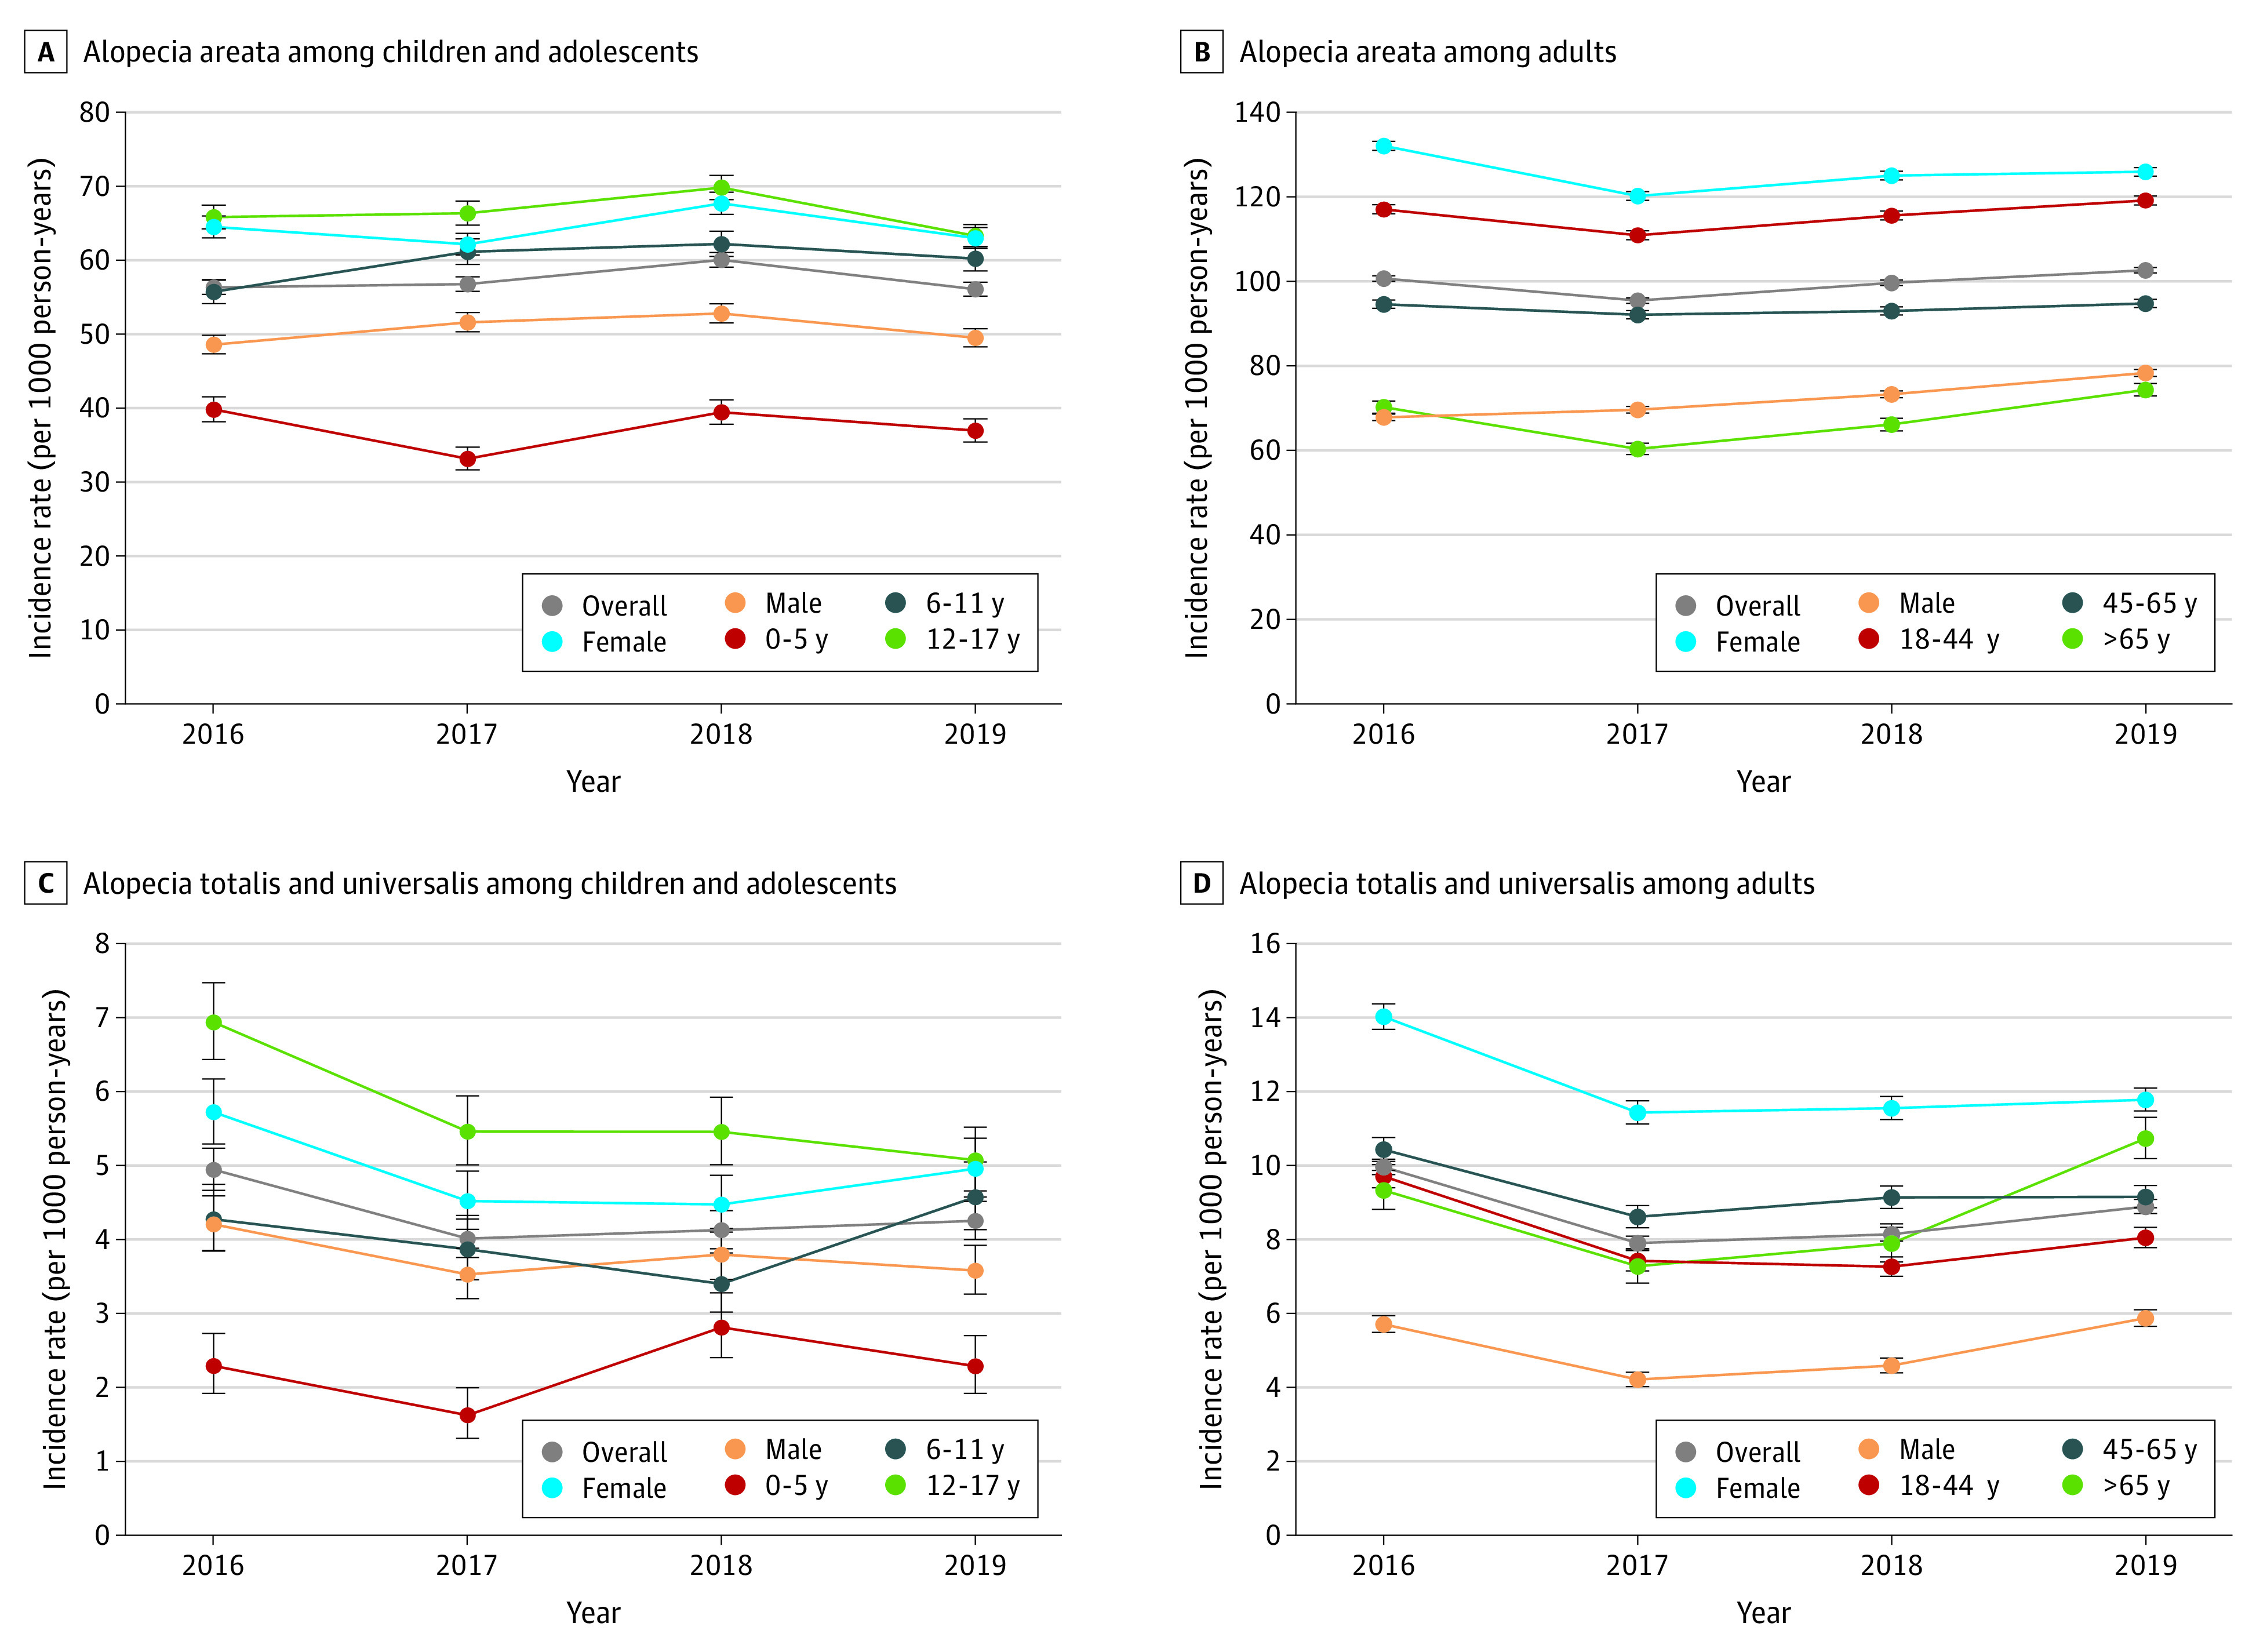
Results: Among eligible patients (2016: n = 18 368 [mean (SD) age, 40.6 (17.9) years; 12 295 women (66.9%)]; 2017: n = 14 372 [mean (SD) age, 39.6 (17.7) years; 9195 women (64.0%)]; 2018: n = 14 231 [mean (SD) age, 38.9 (17.3) years; 8998 women (63.2%)]; 2019: n = 13 455 [mean (SD) age, 39.1 (17.4) years; 8322 women (61.9%)]), AA prevalence increased from 0.199% (95% CI, 0.198%-0.200%) in 2016 to 0.222% (95% CI, 0.221%-0.223%) in 2019. Roughly 5% to 10% of prevalent and incident cases of AA were AT/AU. The prevalence of AT/AU increased from 0.012% (95% CI, 0.012%-0.013%) to 0.019% (95% CI, 0.018%-0.019%) from 2016 to 2019. Incidence of AA per 100 000 person-years ranged from 87.39 (95% CI, 86.84-87.96) in 2017 to 92.90 (95% CI, 92.35-93.45) in 2019. Incidence of AT/AU ranged from 7.09 (95% CI, 6.94-7.25) in 2017 to 8.92 (95% CI, 8.75-9.09) in 2016. Prevalence and incidence of AA and AT/AU were higher among female vs male individuals, adults vs children and adolescents, and in the Northeast vs other regions.
Conclusions and relevance: The results of this cohort study suggest that these recent AA prevalence and incidence estimates could help improve current understanding of the disease burden. Further research is warranted to elucidate subpopulation differences and trends in AA in the broader US population.
Conflict of interest statement
Figures
Comment in
-
Characterizing Epidemiology and Burden of Disease in Alopecia Areata-Making It Count.JAMA Dermatol. 2023 Apr 1;159(4):369-370. doi: 10.1001/jamadermatol.2023.0001. JAMA Dermatol. 2023. PMID: 36857064 No abstract available.
References
-
- McMichael AJ. The genetic epidemiology and autoimmune pathogenesis of alopecia areata. J Eur Acad Dermatol Venereol. 1997;9(1):36-43. doi:10.1111/j.1468-3083.1997.tb00225.x - DOI
-
- Gip L, Lodin A, Molin L. Alopecia areata: a follow-up investigation of outpatient material. Acta Derm Venereol. 1969;49(2):180-188. - PubMed