. 2023 Mar 1;64(3):1.
doi: 10.1167/iovs.64.3.1.

The Saccade Main Sequence in Patients With Retinitis Pigmentosa and Advanced Age-Related Macular Degeneration

Affiliations

The Saccade Main Sequence in Patients With Retinitis Pigmentosa and Advanced Age-Related Macular Degeneration

Leslie Guadron et al. Invest Ophthalmol Vis Sci. .

Abstract

Purpose: Most eye-movement studies in patients with visual field defects have examined the strategies that patients use while exploring a visual scene, but they have not investigated saccade kinematics. In healthy vision, saccade trajectories follow the remarkably stereotyped "main sequence": saccade duration increases linearly with saccade amplitude; peak velocity also increases linearly for small amplitudes, but approaches a saturation limit for large amplitudes. Recent theories propose that these relationships reflect the brain's attempt to optimize vision when planning eye movements. Therefore, in patients with bilateral retinal damage, saccadic behavior might differ to optimize vision under the constraints imposed by the visual field defects.

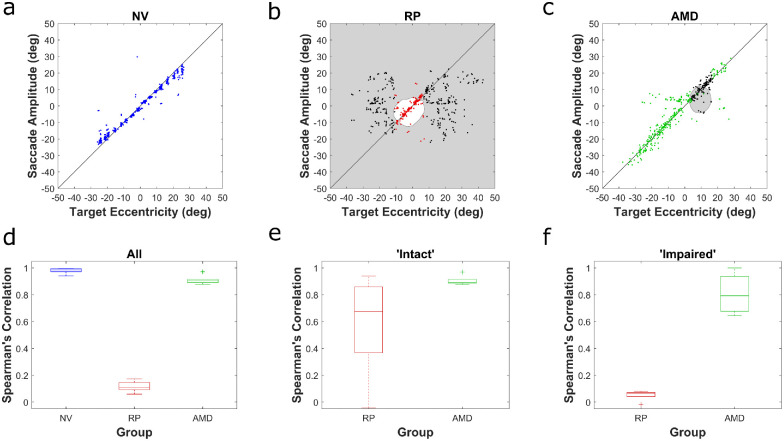
Methods: We compared saccadic behavior of patients with central vision loss, due to age-related macular degeneration (AMD), and patients with peripheral vision loss, due to retinitis pigmentosa (RP), to that of controls with normal vision (NV) using a horizontal saccade task.

Results: Both patient groups demonstrated deficits in saccade reaction times and target localization behavior, as well as altered saccade kinematics. Saccades were generally slower and the shape of the velocity profiles were often atypical, especially in the patients with RP. In the patients with AMD, the changes were far less dramatic. For both groups, saccade kinematics were affected most when the target was in the subjects' blind field.

Conclusions: We conclude that defects of the central and peripheral retina have distinct effects on the saccade main sequence, and that visual inputs play an important role in planning the kinematics of a saccade.


Conflict of interest statement

Disclosure: L. Guadron, (N); S.A. Titchener, (N); C.J. Abbott, (N); L.N. Ayton, (N); J. van Opstal, (N); M.A. Petoe, (N); J. Goossens, (N)

Figures

Figure 1.
Figure 1.
Visual field estimation. (a, b) Near infrared images from a patient with RP (S10; a) and a patient with AMD (S3; b) showing their retinal lesions in the right and left eyes. (c, d) The areas of residual vision in each of the two eyes of a patient with RP as inferred from Goldmann perimetry c and the location of scotomas in a patient with AMD as inferred from multi-modal imaging d. The PRL for monocular viewing with the right eye (OD; red x) and left eye (OS; blue +) was estimated with MAIA. (e, f) Area of residual binocular vision relative to the fovea (patient with RP; assuming both eyes foveate the same point) or relative to the PRL of the dominant eye (patient with AMD; assuming alignment of the foveal axes).
Figure 2.
Figure 2.
Example traces. Horizontal movements of the left (blue) and right (red) eye of single participants with NV, RP, and AMD (S15, S10, and S3, respectively). Each plot shows two trials with responses to the same stimulus. Dashed lines indicate the stimulus locations relative the cyclopean eye. Targets appeared at 9 degrees (a, b, c) or 22 degrees (d, e, f) to the right of the central fixation point. For the patients, either the targets at 22 degrees (patient with RP) or the targets at 9 degrees to the right (patient with AMD) were in their impaired visual field just prior to the first saccade. Data are from odd trials with targets at unpredictable, pseudo-random locations. Note scaling differences between the panels.
Figure 3.
Figure 3.
End points primary saccades. (a, b, c) Single subject data from participants with NV, RP, and AMD (same three participants as in Fig. 2). Saccade amplitude as a function of target eccentricity relative to the fovea or the PRL just before saccade onset. Positive eccentricities/amplitudes are for targets/movements to the right; negative eccentricities/amplitudes are for targets/movements to the left. Data are pooled across left and right eyes. Insets illustrate the two-dimensional visual field defects, with the gray area representing impaired sensitivity in both eyes. Black dots: Target was in the impaired visual field of both eyes at movement onset. Colored dots: Target was in the intact visual field of at least one of the two eyes. (d, e, f) Boxplots showing Spearman's rank correlations between target eccentricity and saccade amplitude in each group. On each box, the central mark indicates the median, and the bottom and top edges of the box indicate the 25th and 75th percentiles, respectively. The whiskers extend to the most extreme data points not considered outliers, and the outliers (defined as any value that is more than 1.5 times the interquartile range away from the bottom or top of the box) are plotted individually using the “+” symbol.
Figure 4.
Figure 4.
Residual visual fields and scotomas. (a) Area of residual visual field in the right (OD) and left (OS) eye relative to the fovea (and measured eye position) in all five participants with RP. (b) Location of scotomas in the right and left eye relative to the PRL of the corresponding eye (and measured eye position) in all six participants with AMD. Areas of residual vision (RP) or vision loss (AMD) for the two eyes combined were estimated from the monocular fields and the measured position of the eyes on a sample-to-sample basis. Here, we show them, for illustration purposes, relative to the PRL of the dominant eye assuming that both foveas are directed toward the same point in space.
Figure 5.
Figure 5.
End points largest goal-directed saccades. (a, b, c) Single subject data. (d, e, f) Box plots showing Spearman's rank correlations between saccade amplitude and target eccentricity in each group. Same participants and format as in Figure 3.
Figure 6.
Figure 6.
Reaction times and search times. Distribution of reaction times of primary saccades (a) and search times (b) in the odd trials (unpredictable target location). Primary saccades had to have a minimum latency of 80 ms and be directed away from the fixation point. Search time was measured from stimulus onset to the end point of best-landing saccade before the button press indicating that the subject had found the target. Colors represent different subjects, triangles the corresponding median reaction time or median search duration. Data are pooled across target locations. Note that the y-axis scales for NV differ from those for RP and AMD in the reaction time plots.
Figure 7.
Figure 7.
Main sequence of first saccades. Boxplots of median saccade duration and peak velocity versus saccade amplitude comparing the saccade kinematics in the RP (red) and AMD (green) patient group with the NV (blue) control group. Control data in a, b and c, d are duplicates. Median durations and peak velocities were determined in 2-degree-wide (overlapping) amplitude bins for each subject's eye and each saccade direction. Bin width was reduced to 1 degree for the first, 1-degree bin to better capture the steep increase in peak velocity in this amplitude range. Boxes are shifted to the left (NV) and right (RP/AMD) of the actual bin center for clarity. Black asterisks: Wilcoxon rank sum test, P < 0.05. Superimposed are mixed effects regression lines (marginal means). Data are from odd trials with targets at unpredictable, pseudo-random locations.
Figure 8.
Figure 8.
Saccades with multi-peaked velocity profiles. (a) Eye displacement (blue) and eye velocity (red) profiles of amplitude-matched saccades in three different amplitude ranges (4, 9, and 18 degrees). Data are from the same three participants as in Figure 2. Thick darker traces: selected examples of saccades with two or more velocity peaks. (b) Boxplots showing the percentage of saccades with multi-peaked velocity profiles as a function of saccade amplitude in the RP (red) and AMD (green) patient groups compared with the NV (blue) control group. Black asterisks: Wilcoxon rank sum test P < 0.05. Solid curves: Mixed effects regression lines (marginal means).
Figure 9.
Figure 9.
First saccades of patients with RP into their intact visual field. (a, b) Saccade and target both within the intact visual field. (c, d) Saccades of the same participants still directed to a location within the intact visual field but now for trials in which the target was located outside this region (e.g. on the contralateral side) and presumably not seen. Same format as Figure 7. Data are from saccades made in odd trials with targets at unpredictable, pseudo-random locations. Saccades with multi-peaked velocity profiles were excluded.
Figure 10.
Figure 10.
First saccades of patients with AMD into the intact and impaired visual field. (a, b) Saccade and target both within the intact visual field. (c, d) Saccade and target both within the subjects’ scotoma. Same format as Figure 7. Data are from saccades made in odd trials with targets at unpredictable, pseudo-random locations. Saccades with multi-peaked velocity profiles were excluded.

References

    1. Bahill AT, Clark MR, Stark L. Dynamic overshoot in saccadic eye movements is caused by neurological control signal reversals. Exp Neurol. 1975; 48: 107–122. - PubMed
    1. Leigh RJ, Kennard C. Using saccades as a research tool in the clinical neurosciences. Brain. 2004; 127: 460–477. - PubMed
    1. Ramat S, Leigh RJ, Zee DS, Optican LM. What clinical disorders tell us about the neural control of saccadic eye movements. Brain. 2007; 130: 10–35. - PubMed
    1. Harris CM, Wolpert DM. Signal-Dependent Noise Determines Motor Planning. Lett to Nat. 1998; 394: 780–784. - PubMed
    1. Harris CM, Wolpert DM. The main sequence of saccades optimizes speed-accuracy trade-off. Biol Cybern. 2006; 95: 21–29. - PMC - PubMed

Publication types