. 2023 May 1;34(5):ar40.
doi: 10.1091/mbc.E22-09-0402. Epub 2023 Mar 1.

An evolutionarily conserved bimodular domain anchors ZC3HC1 and its yeast homologue Pml39p to the nuclear basket

Affiliations

An evolutionarily conserved bimodular domain anchors ZC3HC1 and its yeast homologue Pml39p to the nuclear basket

Philip Gunkel et al. Mol Biol Cell. .

Abstract

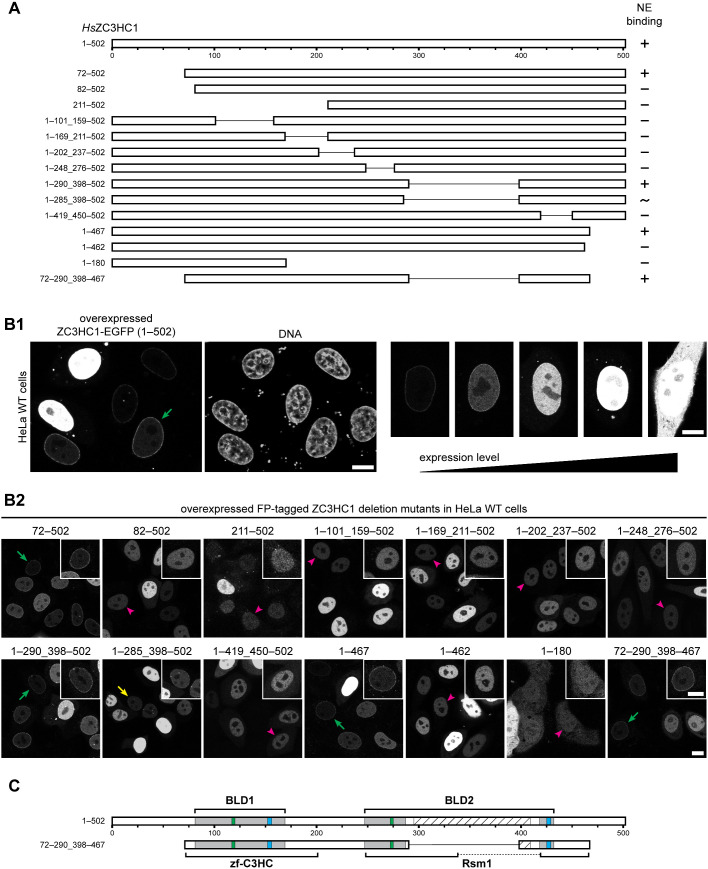
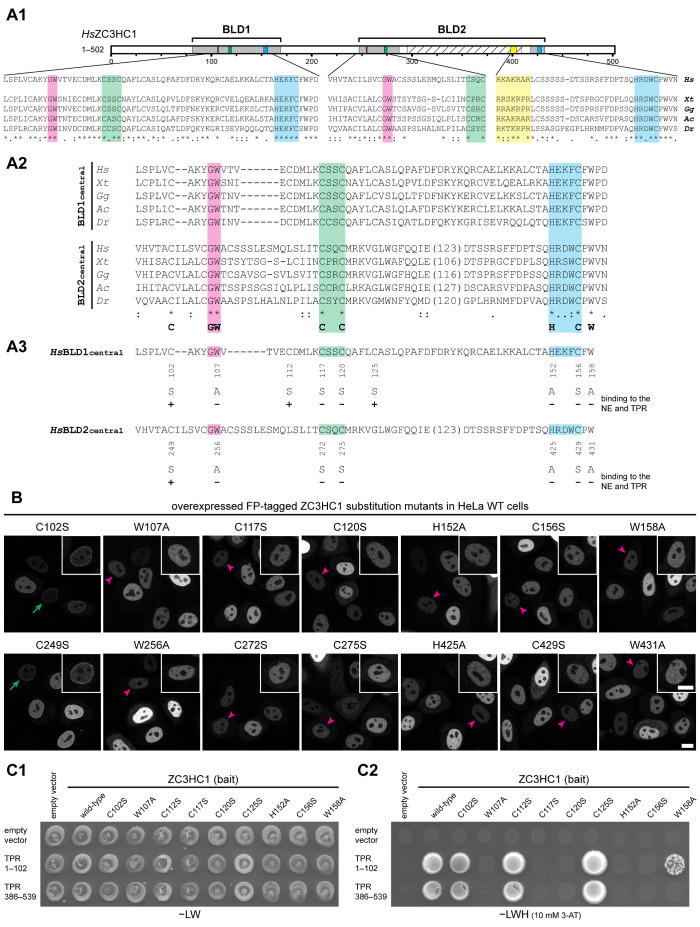
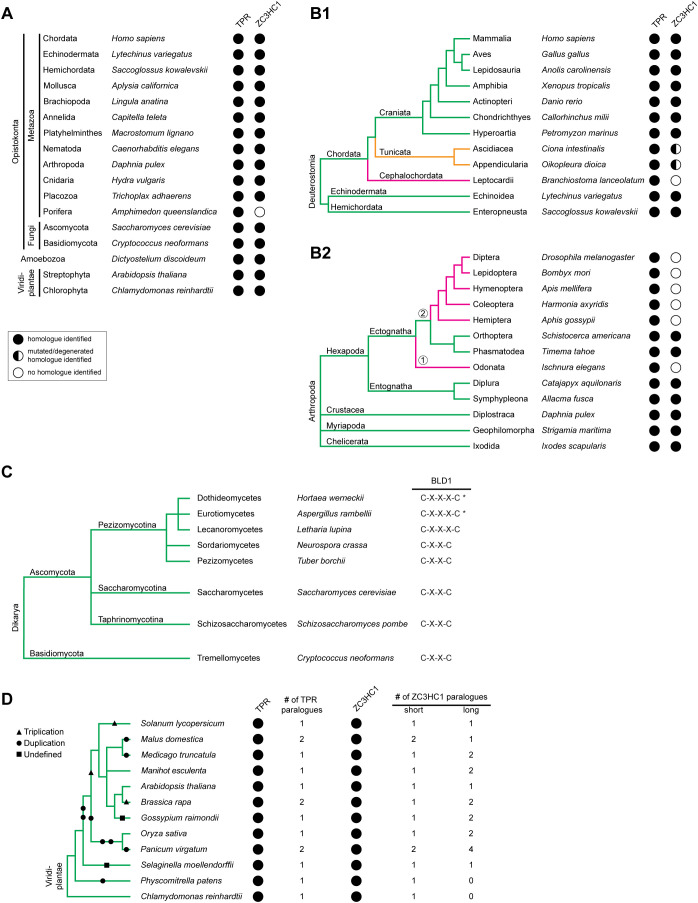
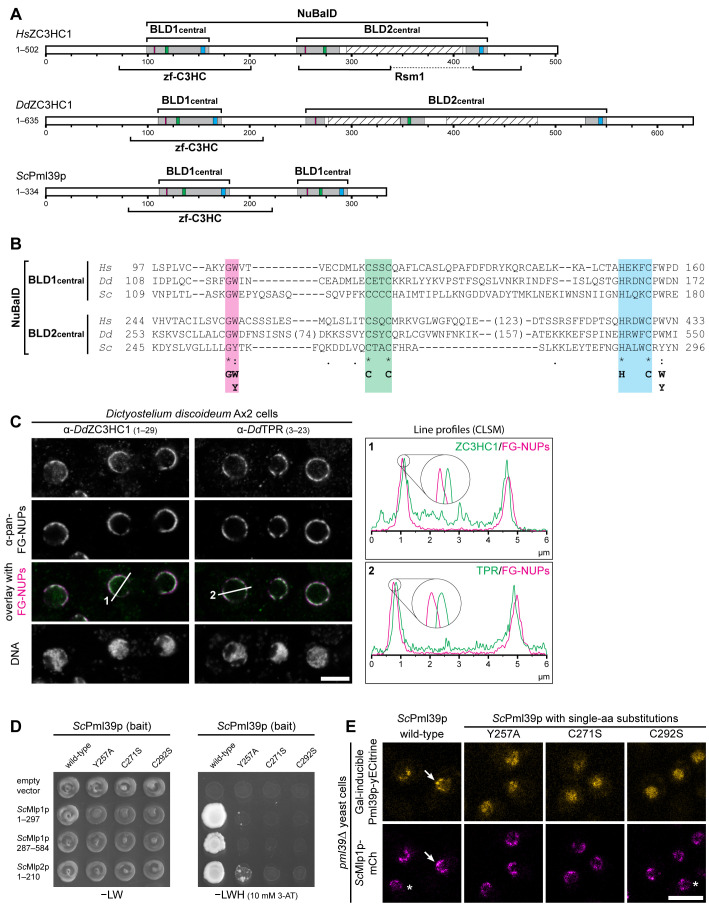
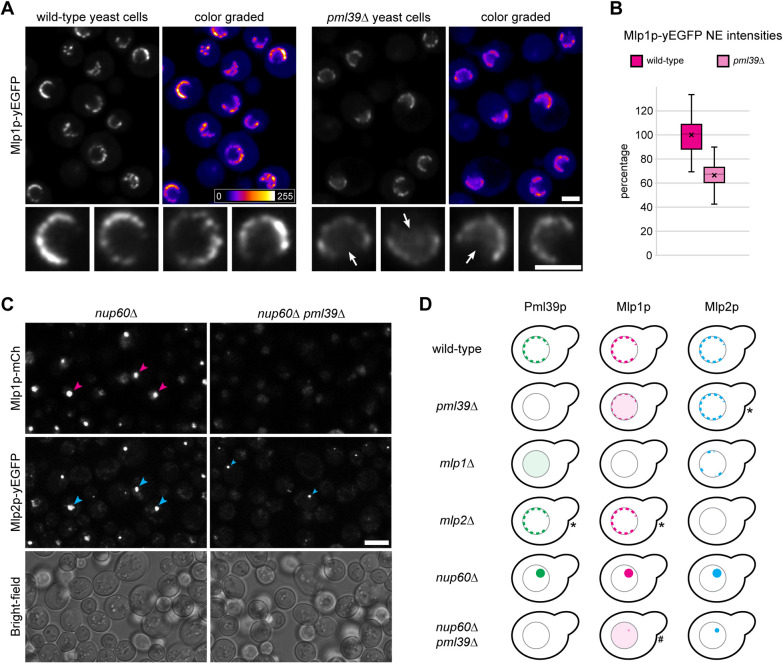
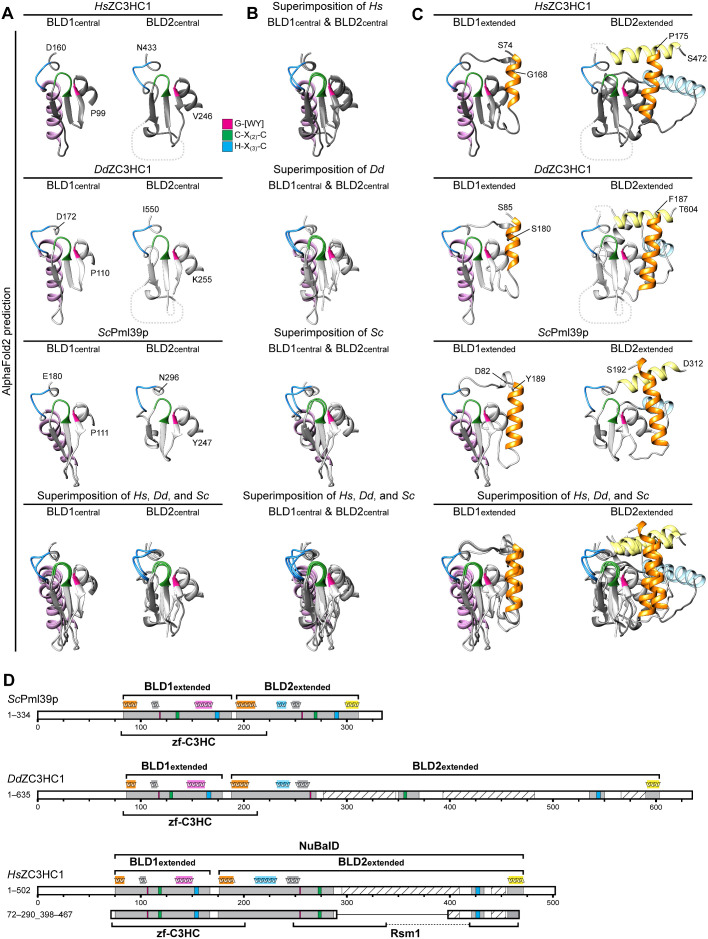
The proteins ZC3HC1 and TPR are structural components of the nuclear basket (NB), a fibrillar structure attached to the nucleoplasmic side of the nuclear pore complex (NPC). ZC3HC1 initially binds to the NB in a TPR-dependent manner and can subsequently recruit additional TPR polypeptides to this structure. Here, we examined the molecular properties of ZC3HC1 that enable its initial binding to the NB and TPR. We report the identification and definition of a nuclear basket-interaction domain (NuBaID) of HsZC3HC1 that comprises two similarly built modules, both essential for binding the NB-resident TPR. We show that such a bimodular construction is evolutionarily conserved, which we further investigated in Dictyostelium discoideum and Saccharomyces cerevisiae. Presenting ScPml39p as the ZC3HC1 homologue in budding yeast, we show that the bimodular NuBaID of Pml39p is essential for binding to the yeast NB and its TPR homologues ScMlp1p and ScMlp2p, and we further demonstrate that Pml39p enables linkage between subpopulations of Mlp1p. We eventually delineate the common NuBaID of the human, amoebic, and yeast homologue as the defining structural entity of a unique protein not found in all but likely present in most taxa of the eukaryotic realm.


Figures

FIGURE 1:
FIGURE 1:
A tandem arrangement of two predicted zinc ion binding modules is essential for the association of ZC3HC1 with NBs. (A) Schematic depiction, drawn to scale, of expression vector–encoded HsZC3HC1 and deletion mutants (see Supplemental Table 1). NB-binding ability is indicated (+, binding visible; −, no binding visible; ∼, unclear or only traces of binding visible). These ratings pertained to cells that expressed lower levels of the recombinant protein, as exemplified in B. (B) Fluorescence microscopy of wild-type (WT) HeLa P2 cells transiently transfected with the vectors shown in A. Bars, 10 µm. (B1) Examples of cells in which NE association of an NB binding–competent version of ZC3HC1, here represented by the WT protein, was discernible only at lower expression levels (green arrow). (B2) Examples of cells with ZC3HC1 mutants ectopically expressed in different amounts. Representative cells with low expression levels are marked, indicating apparent presence at the NE (green arrows), only trace amounts (yellow arrow), or no signal at the NE (magenta arrowheads). Insets show the magnified and signal-enhanced images of the marked cells. As an aside, note that mutant 1–180, lacking the nuclear localization signal (NLS) of ZC3HC1 (Ouyang et al., 2003), shows only slight nuclear enrichment. (C) Schematic depiction of the central regions of the two BLDs of ZC3HC1, relative to the simple schemes of the WT and mutant 72–290_398–467 in A. Green and blue boxes represent the positions of the C-X(2)-C and H-X(3)-C sequence elements, respectively. Gray regions represent the initially approximated expanse of each BLD (Higashi et al., 2005; Kokoszynska et al., 2008). The outer boundaries of BLD1 are defined by R81 and M169, the outer boundaries of BLD2 by T247 and V432, and the inner boundaries of BLD2 by I287 and F418. The hatched box, corresponding to D295–S409, represents an insertion predicted to be largely disordered, except for the P322–S329 region. Brackets represent the expanse of regions comprising the Pfam database motifs zf-C3HC and Rsm1, as specified in the Conserved Domain Database (https://www.ncbi.nlm.nih.gov/cdd/). Note that ZC3HC1 mutants lacking any part of the C-X(2)-C or H-X(3)-C peptide sequences did not bind to the NE.
FIGURE 2:
FIGURE 2:
Specific amino acids within both BLDs of ZC3HC1 are essential for the initial binding to TPR. (A) Schematic depiction of the two BLDs, sequence alignments of representative vertebrate homologues, and an overview of the single-aa-substitution mutants of FP-tagged HsZC3HC1. (A1) Schemes of the two HsZC3HC1 BLDs and alignment of the vertebrate homologue sequence segments corresponding to the minimal central region of each BLD, including the G-W, C-X(2)-C, and H-X(3)-C peptides, and some flanking residues. Sequences are from the human homologue (Hs), amphibians (Xenopus tropicalis, Xt), birds (Gallus gallus, Gg), reptiles (Anolis carolinensis, Ac), and fish (Danio rerio, Dr). Areas highlighted in addition to those in Figure 1C represent G-W dipeptides (magenta) and the NLS (yellow). (A2) Alignments between sequences representing the central BLD1 region and corresponding BLD2 segments but excluding the BLD2-specific sequence insertions (variable lengths in brackets). The bottom line provides a minimal sequence signature identical for both BLDs in these vertebrate homologues. The HsZC3HC1 BLD1 and BLD2 sequences shown represent L97–D160 and V244–N433, respectively. The inner boundaries flanking the BLD2 insertion correspond to E288 and D412. (A3) Individual aa substitutions within the BLD regions and their effects on NE binding and TPR interaction. (B) Fluorescence microscopy of WT HeLa cells transiently transfected with a selection of expression vectors encoding full-length HsZC3HC1 mutants, each carboxy-terminally tagged with EGFP and carrying one of the single-aa substitutions specified in A3. Representative cells with low expression levels are marked as in Figure 1B2 by green arrows and magenta arrowheads, with insets showing the magnified and signal-enhanced images of the marked cells. Bar, 10 µm. (C) Y2H experiments analyzing the interaction of the single-aa-substitution mutants of HsZC3HC1 with two HsTPR segments that include ZC3HC1 interaction domains. (C1) Representative colony growth of diploid cells expressing TPR segments together with WT ZC3HC1 or some of its mutants. Cells were grown on a selection medium lacking leucine and tryptophan (−LW). (C2) Visualization of Y2H interactions after replica-plating onto –LW selection medium also lacking histidine (−LWH) and supplemented with 3-AT. Note that those single-aa-substitution mutants of ZC3HC1 that did not impair NE association in HeLa cells (e.g., C102S, C112S, and C125S) allowed colony growth when paired with the ZC3HC1-binding domains of TPR. By contrast, no colony growth was observed for the mutants incapable of associating with the NE (e.g., C117S, C120S, and C156S). Further note that mutant W158A, which associated with the NE in ZC3HC1 KO cells (Supplemental Figure S2B2) but not in WT cells (as shown in B), was capable of an attenuated TPR interaction (see also Supplemental Figure S2E).
FIGURE 3:
FIGURE 3:
Distribution of ZC3HC1 and its homologues among eukaryotes. (A) Selection of eukaryotic phyla and divisions with representative species in which ZC3HC1 homologues were identified by sequence database mining. The presence of TPR homologues is depicted for comparison. Taxonomy is mostly according to the NCBI taxonomy database (Schoch et al., 2020; https://www.ncbi.nlm.nih.gov/taxonomy). Note that ZC3HC1 homologues exist in most animal phyla and the divisions of fungi, amoeba, and green plants. Among the listed animal phyla, ZC3HC1 was undetectable only in the sponges. (B) Exemplifying cladograms of the clade Deuterostomia and the phylum Arthropoda, illustrating the evolutionary fate of ZC3HC1 in some subphyla. (B1) Cladogram of the Deuterostomia, based on phylogenetic trees and former cladograms (e.g., Delsuc et al., 2018), listing the phyla Echinodermata, Hemichordata, and Chordata, the chordate subphyla Craniata, Tunicata, and Cephalochordata, and a selection of classes and species. Note that ZC3HC1 homologues were undetectable in the Cephalochordata, while homologues in the Tunicata harbor various mutations that differ between different classes and orders, but would all prevent HsZC3HC1 from binding to the NB and TPR. (B2) Cladogram of the phylum Arthropoda, deduced from a phylogenetic tree (Sasaki et al., 2013), listing the subphyla Hexapoda, Crustacea, Myriapoda, and Chelicerata, and a selection of orders and species. Note that ZC3HC1 homologues were undetectable in the infraclass Paleoptera (①), here represented by the order Odonata, and are similarly absent in most orders of the infraclass Neoptera (②). However, ZC3HC1 homologues are present in the orders Orthoptera and Phasmatodea, suggesting that at least two independent events led to the disappearance of the ZC3HC1 gene, or its alteration beyond recognition, in the other insects. (C) Cladogram of the subkingdom Dikarya, representing an excerpt of a previous cladogram (Spatafora et al., 2017), with its divisions Basidiomycota and Ascomycota. For the Ascomycota, three subdivisions are listed, i.e. the Pezizomycotina, Saccharomycotina, and Taphrinomycotina, together with some of their classes and representative species. While most fungal ZC3HC1 homologues possess the C-X(2)-C tetrapeptide as part of their BLD1 zinc finger, some Pezizomycotina classes feature a C-X(3)-C instead. However, even though the C-X(3)-C pentapeptide is predominant in the classes Eurotiomycetes and Dothideomycetes, a few of their orders feature only sequences with C-X(2)-C. These classes are therefore marked with an asterisk. (D) Cladogram of the kingdom Viridiplantae, representing an excerpt of a phylogenetic tree (Panchy et al., 2016; Wang et al., 2020), including some green plant orders in which genome duplication events did or did not occur. Representative species and genome duplication (circles), triplication (triangles), and undefined polyploidization events (squares) are indicated. Several genome duplications led to six ZC3HC1 and two TPR paralogues in the order Poales, here represented by the switchgrass Panicum virgatum. By contrast, in other orders, the additional ZC3HC1 gene appears to have been inactivated again, for example, in the spreading earth moss Physcomitrella patens.
FIGURE 4:
FIGURE 4:
NB- and TPR/Mlp-interacting ZC3HC1 homologues with a conserved NuBaID signature exist in S. cerevisiae and D. discoideum. (A) Schematic depiction of DdZC3HC1 and ScPml39p, compared to HsZC3HC1. The highlighted regions of the two BLDs, together representing the bimodular NuBaID, correspond to those in Figures 1C and 2A1. The boxes in magenta now depict positions that can read either G-W or G-Y, the latter dipeptide part of the Pml39p BLD2. The known NLS of HsZC3HC1 and the unknown, only conjecturable NLS of the two other homologues appear differently positioned and are not depicted here. The expanse of the minimal central region of each HsZC3HC1 BLD is as specified in Figure 2A2. The central regions of DdZC3HC1 BLD1 and BLD2 shown here comprise I108–N172 and K253–I550, respectively. The inner boundaries flanking two apparent insertions within DdZC3HC1 BLD2 here correspond to S273 and D348, and to K371 and A529. Parts of these insertions were predicted to be mostly unstructured, except for V418–N433, and to range from N277 to K347 and N393 to S482 (hatched boxes). For ScPml39p, the central BLD1 and BLD2 regions presented here comprise V109–E180 and K245–N296, respectively. Brackets indicate regions to which a zf-C3HC or Rsm1 motif has been attributed to date. So far, no Rsm1 motif has been assigned to DdZC3HC1 and ScPml39p. (B) Sequence alignments of the central regions of the BLDs, according to those in Figure 2A2. The minimal sequence signature shared by the two BLDs in all three proteins is depicted. (C) Double-labeling IFM of D. discoideum Ax2 cells with pan-FG-NUPs antibodies and antibodies for either DdZC3HC1 or DdTPR, with the focal plane approximately at the equator of most nuclei. DNA staining is shown for reference. Section lines across the nuclei, marked 1 and 2 in the overlay micrographs, were analyzed by ImageJ, with line profiles plotted. Note that the 4× enlarged line profiles from both sides of the corresponding nuclei reveal the offset location of DdZC3HC1 and DdTPR toward the nuclear interior, relative to the immunolabeled FG-repeat nucleoporins of the NPCs. Bar, 5 µm. (D) Representative Y2H data, obtained by expressing segments of Mlp1p and Mlp2p with either intact Pml39p or a selection of Pml39p mutants with single-aa substitutions in the NuBaID. Experiments were performed as described in Figure 2C. Note that while a robust Y2H interaction occurred between intact Pml39p and distinct parts of the Mlps, no colony growth was observed for Pml39p mutants such as Y257A, C271S, and C292S. (E) Live-cell imaging of pml39∆ yeast cells endogenously expressing mCherry-tagged Mlp1p and, upon induced ectopic expression, either yECitrine-tagged WT Pml39p or a selection of the likewise tagged mutants with single-aa substitutions. Note that the newly synthesized intact Pml39p primarily accumulated at the NE (arrow). By contrast, the Pml39p mutants were distributed throughout the nuclear interior. Asterisks mark a few cells in which Pml39p expression was not detected. Bar, 5 µm.
FIGURE 5:
FIGURE 5:
Absence of Pml39p results in reduced amounts of NE-associated Mlp1p in pml39∆ cells and prevents Mlp1p from accumulating in nuclear clusters in nup60∆ pml39∆ cells. (A) Live-cell fluorescence microscopy of PML39wt and pml39∆ yeast cells endogenously expressing all Mlp1p as yEGFP-tagged polypeptides. The two strains, grown as asynchronous populations, were analyzed in parallel with identical microscope settings. Representative overview images are also shown color graded, together with a color lookup table. Some nuclei of the overviews are also shown at higher magnification. Note that the yEGFP signal intensities at the NEs of the pml39∆ cells were, on average, conspicuously reduced compared to the PML39wt cells. Often, some Mlp1p-yEGFP appeared instead distributed throughout the nuclear interior of the pml39∆ cells (arrows). Bars, 2 µm. (B) Quantification of yEGFP signals from tagged Mlp1p at the NEs of PML39wt and pml39∆ cells. The data represent the mean results of two separate experiments conducted on different days and evaluated independently. For each experiment (n = 50 nuclei per strain), PML39wt and pml39∆ cell populations were grown in parallel under identical conditions (see Supplemental Figure S7C1 for the individual data sets). Box plots display the relative signal intensity values, with the arithmetic means marked by x and the means for the PML39wt cells set to 100%. SDs are provided. Note that the mean Mlp1p-yEGFP signal yields for the NEs of the pml39∆ cells were generally reduced significantly. While the signal intensities between individual nuclei differed notably, such variation was less pronounced in the pml39∆ cells than in the PML39wt cells. (C) Live-cell imaging of nup60∆ and nup60pml39∆ cells endogenously expressing mCherry-tagged Mlp1p and yEGFP-tagged Mlp2p. Bright-field micrographs are shown as a reference. Note that both Mlps were no longer attached to the NPCs in the nup60∆ cells. Instead, the Mlps were often focally accumulated, together with Pml39p (Supplemental Figure S7E), within prominent nuclear clusters (magenta and large blue arrowheads). By contrast, in the nup60pml39∆ cells, Mlp1p was hardly or no longer detectable as part of such nuclear clusters, while Mlp2p could still be found in foci (small blue arrowheads) that were then typically much smaller. Bar, 5 µm. (D) Schematic depiction of the subcellular distribution of FP-tagged Mlp and Pml39 polypeptides in yeast KO strains. Contrary to most strains, the outcome for a few strains, marked here by asterisks, appeared to vary moderately between experimental replicates. Such ambiguity pertained to some minor reduction in the amounts of (i) NE-associated Mlp2p in the pml39∆ cells, (ii) NE-associated Pml39p in the mlp2∆ cells, and (iii) NE-associated Mlp1p in the mlp2∆ cells. However, such reductions were noted in only some replicates and occasionally appeared to correlate with cell culture growth phases. A hash marks the nup60pml39∆ strain, as we technically could not unequivocally exclude the possibility that trace amounts of Mlp1p, apart from the bulk of Mlp1p distributed throughout the nucleoplasm, may still occur associated with the small Mlp2p foci in this strain.
FIGURE 6:
FIGURE 6:
Tertiary structure predictions by AlphaFold2 uncover striking similarities between the BLDs of HsZC3HC1, DdZC3HC1, and ScPml39p and allow the redefinition of their boundaries. (A) Structures predicted for the central regions of the BLD1 and BLD2 of HsZC3HC1, DdZC3HC1, and ScPml39p. The outer boundaries of the central part of BLD1 shown here are P99 and D160 for HsZC3HC1, P110 and D172 for DdZC3HC1, and P111 and E180 for ScPml39p. The outer boundaries of the central part of BLD2 here correspond to V246 and N433 for HsZC3HC1, K255 and I550 for DdZC3HC1, and Y247 and N296 for ScPml39p. Having blinded out the AlphaFold2 prediction for the major loop-like BLD2 insertion of HsZC3HC1 and the two major insertions of DdZC3HC1 BLD2, the inner BLD2 boundaries shown here correspond to I287 and F418 for HsZC3HC1, and to I270 and K350, and I370 and E535, respectively, for DdZC3HC1. However, the relative positions of the blinded-out loops are depicted as dashed lines (not to scale). The HsZC3HC1 and ScPml39p structures, here and in B and C, were obtained from the AlphaFold database. The structure for the sequence-corrected version of DdZC3HC1 (accession number ON368701) was determined using the AlphaFold2 source code. The sequence elements C-X(2)-C and H-X(3)-C, assumed to be involved in zinc ion coordination, and the G-[WY] dipeptide are colored as in Figure 4A. Note the similarities between the central BLD1 structures of the homologues and those between the central BLD2 structures. Also note the BLD1-specific α-helix, colored in light pink. (B) Superimposition of the central parts of BLD1 and BLD2 onto each other. Aside from the evolutionarily conserved BLD1-specific α-helix, the structural similarity between the other central parts of both BLDs, which are considered involved in zinc ion coordination, appears evident. (C) Structural predictions for essentially the entire BLD1 and BLD2 modules as newly defined in our study. An additional residue was appended to each boundary to facilitate recognition. The BLD1 of HsZC3HC1, comprising K75–F167, is thus presented as S74–G168. The HsZC3HC1 BLD2, comprising A176–S471, is shown as P175–S472, yet with the major loop and now also a smaller second loop between I434 and E455 blinded out as in A. Accordingly, the BLD1 of DdZC3HC1 is presented as S85–S180, instead of N86–F179, and its BLD2 as F187–T604, instead of Q188–S603. Again, the two major loops within the amoebic BLD2 have been blinded out, as was a smaller loop between V551 and I589. BLD1 and BLD2 of ScPml39p, defined as L83–E188 and S193–E311, are presented correspondingly as D82–Y189 and S192–D312. The BLD1-specific α-helix is again colored in light pink, while the α-helices specific for the BLD2 of all three homologues are shown in light yellow and light blue. The α-helix common to the N-terminal boundary of both BLDs is highlighted in orange. As an aside, note that all segments shown here primarily comprise residues for which AlphaFold2 assigned, with only a few exceptions, a high per-residue confidence score of at least 70, mostly exceeding 90. (D) Schematic depiction of HsZC3HC1, DdZC3HC1, and ScPml39p with the newly defined BLD boundaries. These schemes depict an additional minor insertion within the BLD2 of HsZC3HC1 (I434–E455) and DdZC3HC1 (V551–I589), with the predicted unstructured regions (S440–A454 of HsZC3HC1, G566–S590 of DdZC3HC1) again shown as hatched. For simplification, other potentially unstructured regions beyond the outer BLD boundaries and found in all three homologues are not highlighted. The schematic indications of the α-helices above the scheme for each homologue represent the relative positions of the α-helices correspondingly colored in C. According to the novel BLD delineations, the zf-C3HC motif of the Pfam database would now comprise sequences encompassing the entire BLD1 and part of BLD2. The Rsm1 motif, assigned to HsZC3HC1 and not to DdZC3HC1 or ScPml39p, corresponds only to parts of the BLD2 and its loop-like insertions. Finally, note that the minimal NE binding–competent HsZC3HC1 mutant 72–290_398–467, schematically depicted here for comparison, comprises, with the exception of the four residues 468–471, the newly defined BLD regions in their entirety.

References

    1. Aherrahrou R, Reinberger T, Werner J, Otto M, Al-Hasani J, Munoz-Venegas ML, Civelek M, Schunkert H, Kessler T, Erdmann J, et al. (2021). Deficiency of ZC3HC1 increases vascular smooth muscle cell migration, proliferation and neointima formation following injury. bioRxiv 10.1101/2021.09.29.462212. - DOI
    1. Aksenova V, Smith A, Lee H, Bhat P, Esnault C, Chen S, Iben J, Kaufhold R, Yau KC, Echeverria C, et al. (2020). Nucleoporin TPR is an integral component of the TREX-2 mRNA export pathway. Nat Commun 11, 4577. - PMC - PubMed
    1. Anderson JT, Willis JH, Mitchell-Olds T (2011). Evolutionary genetics of plant adaptation. Trends Genet 27, 258–266. - PMC - PubMed
    1. Ashkenazy-Titelman A, Shav-Tal Y, Kehlenbach RH (2020). Into the basket and beyond: the journey of mRNA through the nuclear pore complex. Biochem J 477, 23–44. - PubMed
    1. Austad SN, Hoffman JM (2018). Is antagonistic pleiotropy ubiquitous in aging biology? Evol Med Public Health 2018, 287–294. - PMC - PubMed

MeSH terms

Substances

LinkOut - more resources