. 2023 Mar 28;42(3):112189.
doi: 10.1016/j.celrep.2023.112189. Epub 2023 Feb 17.

SARS-CoV-2 Spike protein induces TLR4-mediated long-term cognitive dysfunction recapitulating post-COVID-19 syndrome in mice

Affiliations

SARS-CoV-2 Spike protein induces TLR4-mediated long-term cognitive dysfunction recapitulating post-COVID-19 syndrome in mice

Fabricia L Fontes-Dantas et al. Cell Rep. .

Abstract

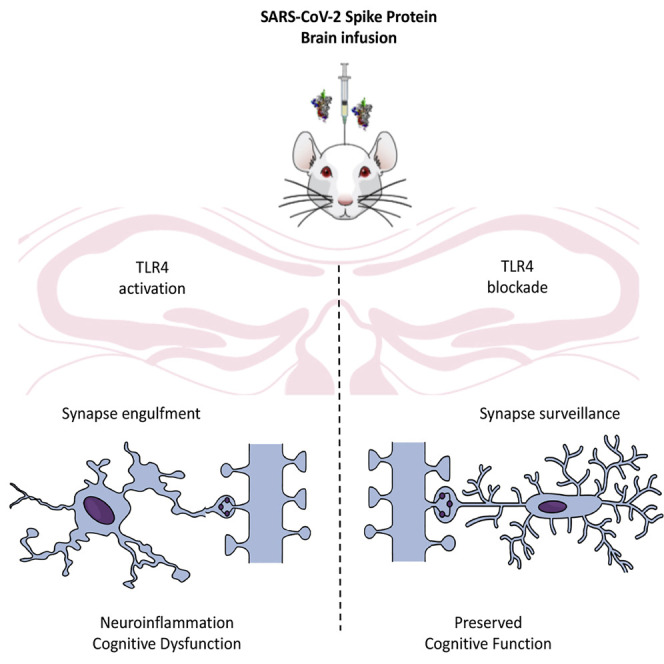
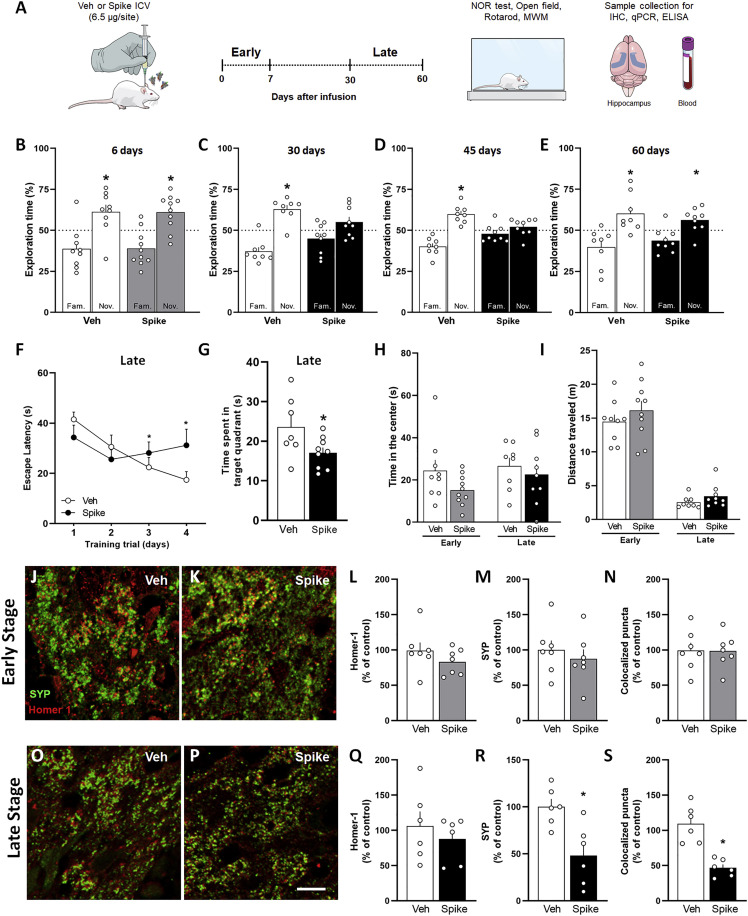
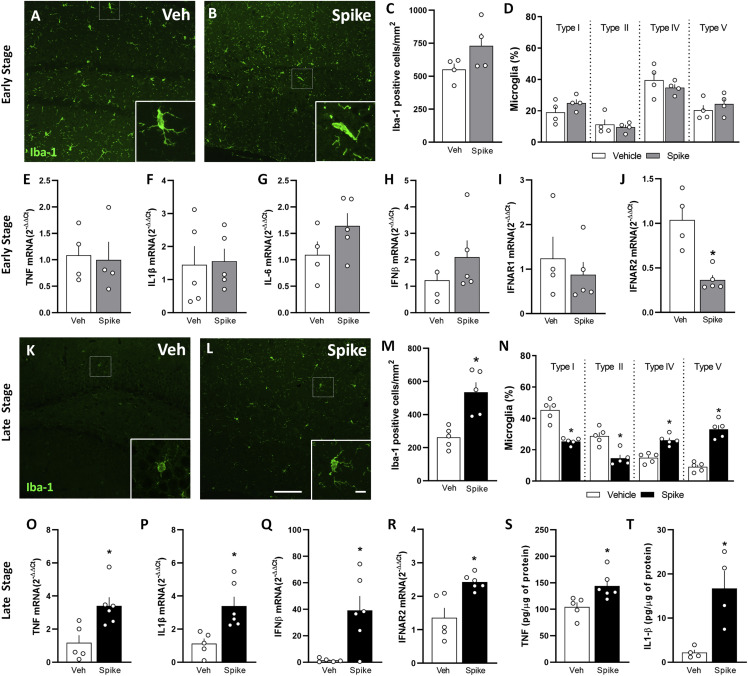
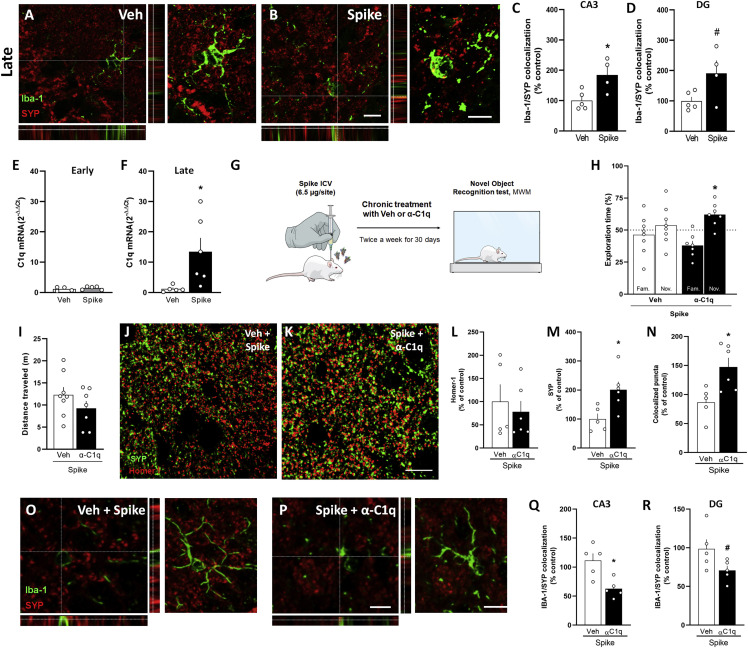
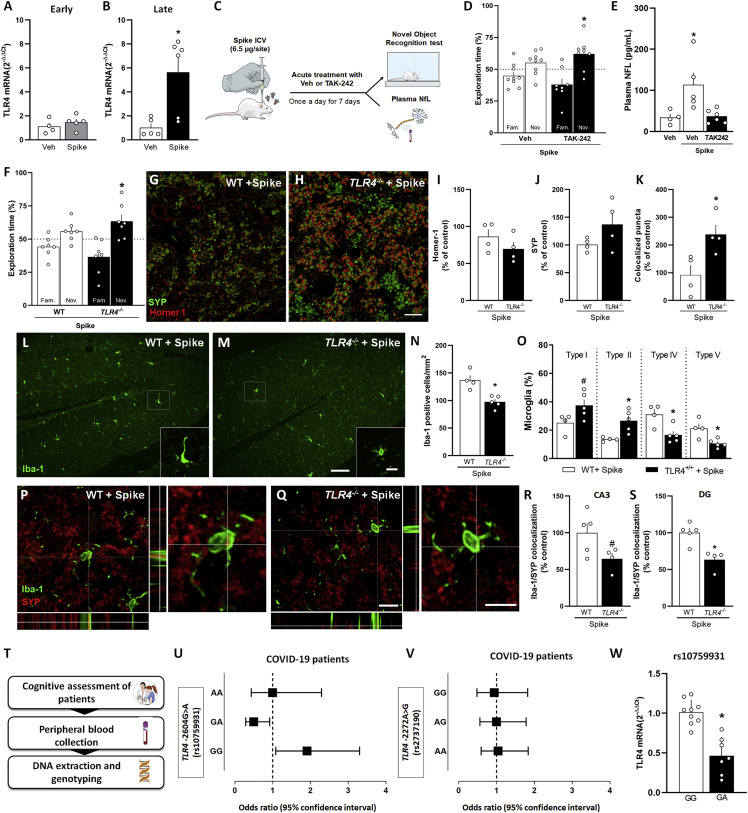
Cognitive dysfunction is often reported in patients with post-coronavirus disease 2019 (COVID-19) syndrome, but its underlying mechanisms are not completely understood. Evidence suggests that severe acute respiratory syndrome coronavirus 2 (SARS-CoV-2) Spike protein or its fragments are released from cells during infection, reaching different tissues, including the CNS, irrespective of the presence of the viral RNA. Here, we demonstrate that brain infusion of Spike protein in mice has a late impact on cognitive function, recapitulating post-COVID-19 syndrome. We also show that neuroinflammation and hippocampal microgliosis mediate Spike-induced memory dysfunction via complement-dependent engulfment of synapses. Genetic or pharmacological blockage of Toll-like receptor 4 (TLR4) signaling protects animals against synapse elimination and memory dysfunction induced by Spike brain infusion. Accordingly, in a cohort of 86 patients who recovered from mild COVID-19, the genotype GG TLR4-2604G>A (rs10759931) is associated with poor cognitive outcome. These results identify TLR4 as a key target to investigate the long-term cognitive dysfunction after COVID-19 infection in humans and rodents.

Keywords: CP: Immunology; CP: Neuroscience; SARS-CoV-2 spike protein; TLR4; cognitive dysfunction; genetic variant; long COVID; microgliosis; neuroinflammation; post-COVID syndrome; synapse loss; synaptic pruning.


Conflict of interest statement

Declaration of interests The authors declare no competing interests.

Figures

None
Graphical abstract
Figure 1
Figure 1
Spike protein causes synapse damage and memory impairment in mice (A) Mice received an i.c.v. infusion of 6.5 μg of SARS-CoV-2 Spike protein (Spike) or vehicle (Veh) and were evaluated at early (up to 7 days) or late time points (from 30–60 days) after infusion using behavioral and molecular approaches. (B–E) Mice were tested in the NOR test at 6 days (B; t = 2.626, p = 0.0304 for Veh; t = 3.218, p = 0.0105 for Spike), 30 days (C; t = 5.099, p = 0.0014 for Veh; t = 1.645, p = 0.1386 for Spike), 45 days (D; t = 5.122, p = 0.0014 for Veh; t = 1.189, p = 0.2685 for Spike), or 60 days (E; t = 2.913, p = 0.0195 for Veh; t = 2.560, p = 0.0336 for Spike). One-sample Student’s t test compared with the chance level of 50% (n = 8–10 mice per group). (F and G) Escape latency across 4 consecutive training trials (F) and time spent in the target quadrant during the probe trial (G) of the MWM test performed 45 days after Spike infusion (F, F(3, 45) = 2.857, p = 0.0475, repeated measures ANOVA followed by Tukey’s test G, t = 2.211, p = 0.0442, Student’s t test; n = 7–9 mice per group). (H) Time spent at the center of the open field arena at early or late stages of the model (early, t = 1.728, p = 0.1021; late, t = 0.5363, p = 0.5348; Student’s t test; n = 8–10 mice per group). (I) Total distance traveled in the open field arena at early or late stages of the model (early, t = 0.9614, p = 0.3498; late, t = 1.343, p = 0.1993; Student’s t test; n = 8–10 mice per group). (J, K, O, and P) Representative images of the DG hippocampal region of Veh-infused (J and O) and Spike-infused mice (K and P) in the early (J and K) and late (O and P) stages of the model, immunolabeled for Homer-1 (red) and synaptophysin (SYP; green). (L–N and Q–S) Number of puncta for Homer-1 (L and Q), SYP (M and R), and colocalized Homer-1/SYP puncta (N and S) in the early (L–N) and late (Q–S) stages of the model. (L, t = 1.202, p = 0.2524; M, t = 0.6648, p = 0.5188; N, t = 0.04952, p = 0.9613; Q, t = 0.7491, p = 0.4711; R, t = 3.400, p = 0.0273; S, t = 4.204, p = 0.0137; Student’s t test; n = 6–7 mice per group). Scale bar, 20 μm. Symbols represent individual mice. Bars or points represent mean ± SEM. IHC, immunohistochemistry; MWM, Morris water maze; NOR, novel object recognition.
Figure 2
Figure 2
Spike protein induces cytokine upregulation and triggers delayed brain inflammation and microgliosis in mice (A–T) Mice received an i.c.v. infusion of 6.5 μg of Spike or Veh and were evaluated at early (A–J, 3 days) or late (K–T, 45 days) time points. Shown are representative images of Iba-1 immunostaining in the DG hippocampal region of Veh-infused (A and K) or Spike-infused mice (B and L) in the early (A and B) and late (K and L) stages of the model. Scale bar, 25 μm; inset scale bar, 10 μm. (C and M) Iba-1+ cells in the hippocampi of Veh- or Spike-infused mice in the early (C; t = 1.726, p = 0.1350) and late (M; t = 4.086, p = 0.0035) stages of the model. Student’s t test (n = 4–5 mice per group). (D and N) Quantification of the proportion of each morphological type of Iba-1+ cells in Veh- or Spike-infused mice evaluated in the in the early (D) and late (N) stages of the model (D: t = 1.383, p = 0.2160 for type I; t = 0.4712, p = 0.6541 for type II; t = 0.8927, p = 0.4064 for type IV; t = 0.8565, p = 0.4246 for type V; N: t = 6.388, p = 0.0002 for type I; t = 4.458, p = 0.0021 for type II; t = 5.513, p = 0.0006 for type IV; t = 8.384, p < 0.0001 for type V). Student’s t test, n = 4–5 mice per group. Type I and type II cells have smaller somata and fewer than 5 thin branches, surveillant microglia. Type III, IV, and V cells have more than 4 branches, thicker branches, and bigger somata, reactive microglia. (E–J) qPCR analysis of the indicated mRNA isolated from the hippocampus in the early stage of the model: TNF mRNA (E; t = 0.2060, p = 0.8436), IL-1β mRNA (F; t = 0.1601, p = 0.8768), IL-6 mRNA (G; t = 1.555, p = 0.1638), IFNβ mRNA (H; t = 1.091, p = 0.3112), IFNAR1 mRNA (I; t = 0.6806; p = 0.5180), and IFNAR2 (J; t = 4.413, p = 0.0031). Student’s t test, n = 4–5 mice per group. (O–R) qPCR analysis of the indicated mRNA isolated from the hippocampus in the late stage of the model: TNF mRNA (O; t = 3.189, p = 0.0110), IL-1β mRNA (P; t = 3.322, p = 0.0089), IFN-β mRNA (Q; t = 3.713, p = 0.013), and IFNAR2 mRNA (R; t = 3.743, p = 0.0046). (S and T) ELISA analysis of TNF (S; t = 2.885, p = 0.0180) and IL-1β (T; t = 3.583, p = 0.0116) protein levels. Student’s t test, n = 4–6 mice per group. Symbols represent individual mice, and bars represent mean ± SEM.
Figure 3
Figure 3
C1q neutralization prevents Spike-induced memory impairment in mice Mice received an i.c.v. infusion of 6.5 μg of SARS-CoV-2 Spike protein (Spike) or Veh, and were evaluated at early (3 days) or late time points (45 days). (A and B) Representative images of microglia (Iba-1+, green) engulfing pre-synaptic terminals immunolabeled for SYP (red) in the DG hippocampal subregion of Veh-infused (A) or Spike-infused mice (B) in the late stage of the model. Scale bar, 25 μm; inset scale bar, 10 μm. (C and D) Quantification of microglia-SYP colocalization in CA3 (C; t = 2.949, p = 0.0214) and DG (D; t = 2.271, #p = 0.0574) hippocampal subregions. Student’s t test; n= 4–5 mice per group. (E and F) C1q mRNA expression in hippocampi of Veh- or Spike-infused mice at early (E; t = 0.7877, p = 0.4567) or late (F; t = 2.425, p = 0.0383) time points. Student’s t test; n = 4–6 mice per group. (G) Mice received an i.c.v. infusion of 6.5 μg of Spike, were treated with Veh or 0.3 μg anti-C1q antibody (α-C1q; i.c.v., twice a week for 30 days), followed by the NOR test (H; t = 3.438, p = 0.0138 for Spike/α-C1q). One-sample Student’s t test compared with the chance level of 50%; n = 7–8 mice per group. (I) Total distance traveled in the open field arena at the late time point (t = 1.274, p = 0.2249). Student’s t test; n = 7–8 mice per group. (J and K) Representative images of the DG hippocampal subregion of Veh/Spike-injected (J) or α-C1q/Spike-injected (K) mice immunolabeled for Homer1 (red) and SYP (green). Scale bar, 20 μm. Number of puncta for Homer-1 (L; t = 0.5215, p = 0.6146), SYP (M; t = 2.881, p = 0.0181) and colocalized Homer-1/SYP puncta (n; t = 2.935, p = 0.0166). Student’s t test; n = 5–6 mice per group. (O and P) Representative images of microglia (Iba-1+, green) engulfing pre-synaptic terminals immunolabeled for SYP (red) in the DG hippocampal subregion of Veh/Spike (O) or α-C1q/Spike mice (P) in the late stage of the model. Scale bar, 10 μm. (Q and R) Quantification of microglia-SYP colocalization in the CA3 (Q; t = 3.454, p = 0.0086) and DG (R; t = 2.052, #p = 0.0743) hippocampal subregions. Student’s t test; n = 5 mice per group. Symbols represent individual mice, and bars represent mean ± SEM.
Figure 4
Figure 4
TLR4 mediates Spike-induced memory impairment in mice and is associated with post-COVID-19 cognitive impairment in a human cohort (A and B) Mice received an i.c.v. infusion of 6.5 μg of SARS-CoV-2 Spike or Veh, and TLR4 mRNA levels in the hippocampi of Veh- or Spike-infused mice were evaluated at early (A; 3 days, t = 0.8892, p = 0.4034, Student’s t test) or late (B; 45 days, p = 0.0303, Mann-Whitney U test) time points (n = 4–6 mice per group). (C) Swiss mice received an i.c.v. infusion of 6.5 μg of Spike, were treated with Veh or the TLR4 antagonist TAK-242 (2 mg/kg, intraperitoneal [i.p.], once daily for 7 days), and were tested in the late stage of the model in the NOR test (D; t = 2.713, p = 0.0301 for Spike/TAK-242). One-sample Student’s t test compared with the chance level of 50%; n = 8–9 mice per group. (E) Plasma NFL levels evaluated in the late stage of the Spike infusion model (F = 6.329, p = 0.0133). One-way ANOVA test followed by Tukey’s test, n = 4–6 mice per group. (F) Wild-type (WT) and TLR4 knockout (TLR4−/−) mice received an i.c.v. infusion of 6.5 μg of SARS-CoV-2 Spike and were tested in the NOR test in the late stage of the model (F; t = 2.033, p = 0.0883 for WT/Spike and t = 2.744, p = 0.0336 for TLR4−/−/Spike). One-sample Student’s t test compared with the chance level of 50%, n = 7 mice per group. (G and H) Representative images of the DG hippocampal region of WT/Spike (G) and TLR4−/−/Spike (H) mice immunolabeled for Homer1 (red) and SYP (green). Scale bar, 20 μm. (I–K) Number of puncta for Homer-1 (I; t = 1.272, p = 0.2506) and SYP (J; t = 1.592, p = 0.1624) and colocalized Homer-1/SYP puncta (K; t = 2.945, p = 0.0258). Student’s t test; n = 4 mice per group. (L and M) Representative images of Iba-1 immunolabeling in the DG hippocampal subregion of WT (L) and TLR4−/− (M) mice infused with Spike. Scale bar, 25 μm; inset scale bar, 10 μm. (N) Iba-1+ cells in the DG (t = 5.088, p = 0.0014) hippocampal subregion of WT or TLR4−/− mice infused with Spike. (O) Quantification of the different morphological types of Iba-1+ cells in the hippocampus of Spike-infused WT and TLR4−/− mice (O; t = 2.229, #p = 0.0611 for type I; t = 3.340, p = 0.0124 for type II; t = 3.277, p = 0.0135 for type IV; t = 3.316, p = 0.0128 for type V). Student’s t test, n = 4–5 mice per group. Type I and type II cells have smaller somata and fewer than 5 thin branches, surveillant microglia. Type III, IV, and V cells have more than 4 branches, thicker branches, and bigger somata, reactive microglia. (P and Q) Representative images of microglia (Iba-1+, green) engulfing pre-synaptic terminals immunolabeled for SYP (red) in the DG hippocampal subregion of WT (P) and TLR4−/− (Q) mice infused with Spike. Scale bar, 50 μm; inset scale bar, 10 μm. (R and S) Quantification of microglia-SYP colocalization in the CA3 (R; t = 2.200, #p = 0.0637) and DG (S; t = 4.012, p = 0.0051) hippocampal subregions. Student’s t test; n = 4–5 mice per group. Symbols represent individual mice, and bars represent mean ± SEM. (T) Pipeline to analyze the impact of TLR4 variants on the cognitive status of patients with post-COVID-19 syndrome. (U and V) Forest plots showing the OR and 95% confidence interval for risk of cognitive impairment post COVID-19 by genotype for SNPs TLR4 - 2604G>A (U, rs10759931) and TLR4-2272A>G (V, rs2737190). Each square represents the OR for each genotype, and each horizontal line shows the 95% confidence interval. (W) The expression levels of TLR4 for genotypes of SNP TLR4-2604G>A (rs10759931) was determined from peripheral blood mononuclear cells (PBMCs) treated with 1 μg of Spike protein for 24 h (t = 5.612, p < 0.0001). Student’s t test; n = 7–8 patients per group. Data represents the mean ± SD.

References

    1. Lamers M.M., Haagmans B.L. SARS-CoV-2 pathogenesis. Nat. Rev. Microbiol. 2022;20:270–284. doi: 10.1038/s41579-022-00713-0. - DOI - PubMed
    1. Wiersinga W.J., Rhodes A., Cheng A.C., Peacock S.J., Prescott H.C. Pathophysiology, transmission, diagnosis, and treatment of coronavirus disease 2019 (COVID-19): a review. JAMA. 2020;324:782–793. doi: 10.1001/jama.2020.12839. - DOI - PubMed
    1. Crook H., Raza S., Nowell J., Young M., Edison P. Long covid-mechanisms, risk factors, and management. BMJ. 2021;374:n1648. doi: 10.1136/bmj.n1648. - DOI - PubMed
    1. Mehandru S., Merad M. Pathological sequelae of long-haul COVID. Nat. Immunol. 2022;23:194–202. doi: 10.1038/s41590-021-01104-y. - DOI - PMC - PubMed
    1. Taquet M., Sillett R., Zhu L., Mendel J., Camplisson I., Dercon Q., Harrison P.J. Neurological and psychiatric risk trajectories after SARS-CoV-2 infection: an analysis of 2-year retrospective cohort studies including 1 284 437 patients. Lancet Psychiatr. 2022;9:815–827. doi: 10.1016/S2215-0366(22)00260-7. - DOI - PMC - PubMed

Publication types