. 2023 Mar 28;42(3):112155.
doi: 10.1016/j.celrep.2023.112155. Epub 2023 Feb 27.

Limiting Mrs2-dependent mitochondrial Mg2+ uptake induces metabolic programming in prolonged dietary stress

Affiliations

Limiting Mrs2-dependent mitochondrial Mg2+ uptake induces metabolic programming in prolonged dietary stress

Travis R Madaris et al. Cell Rep. .

Abstract

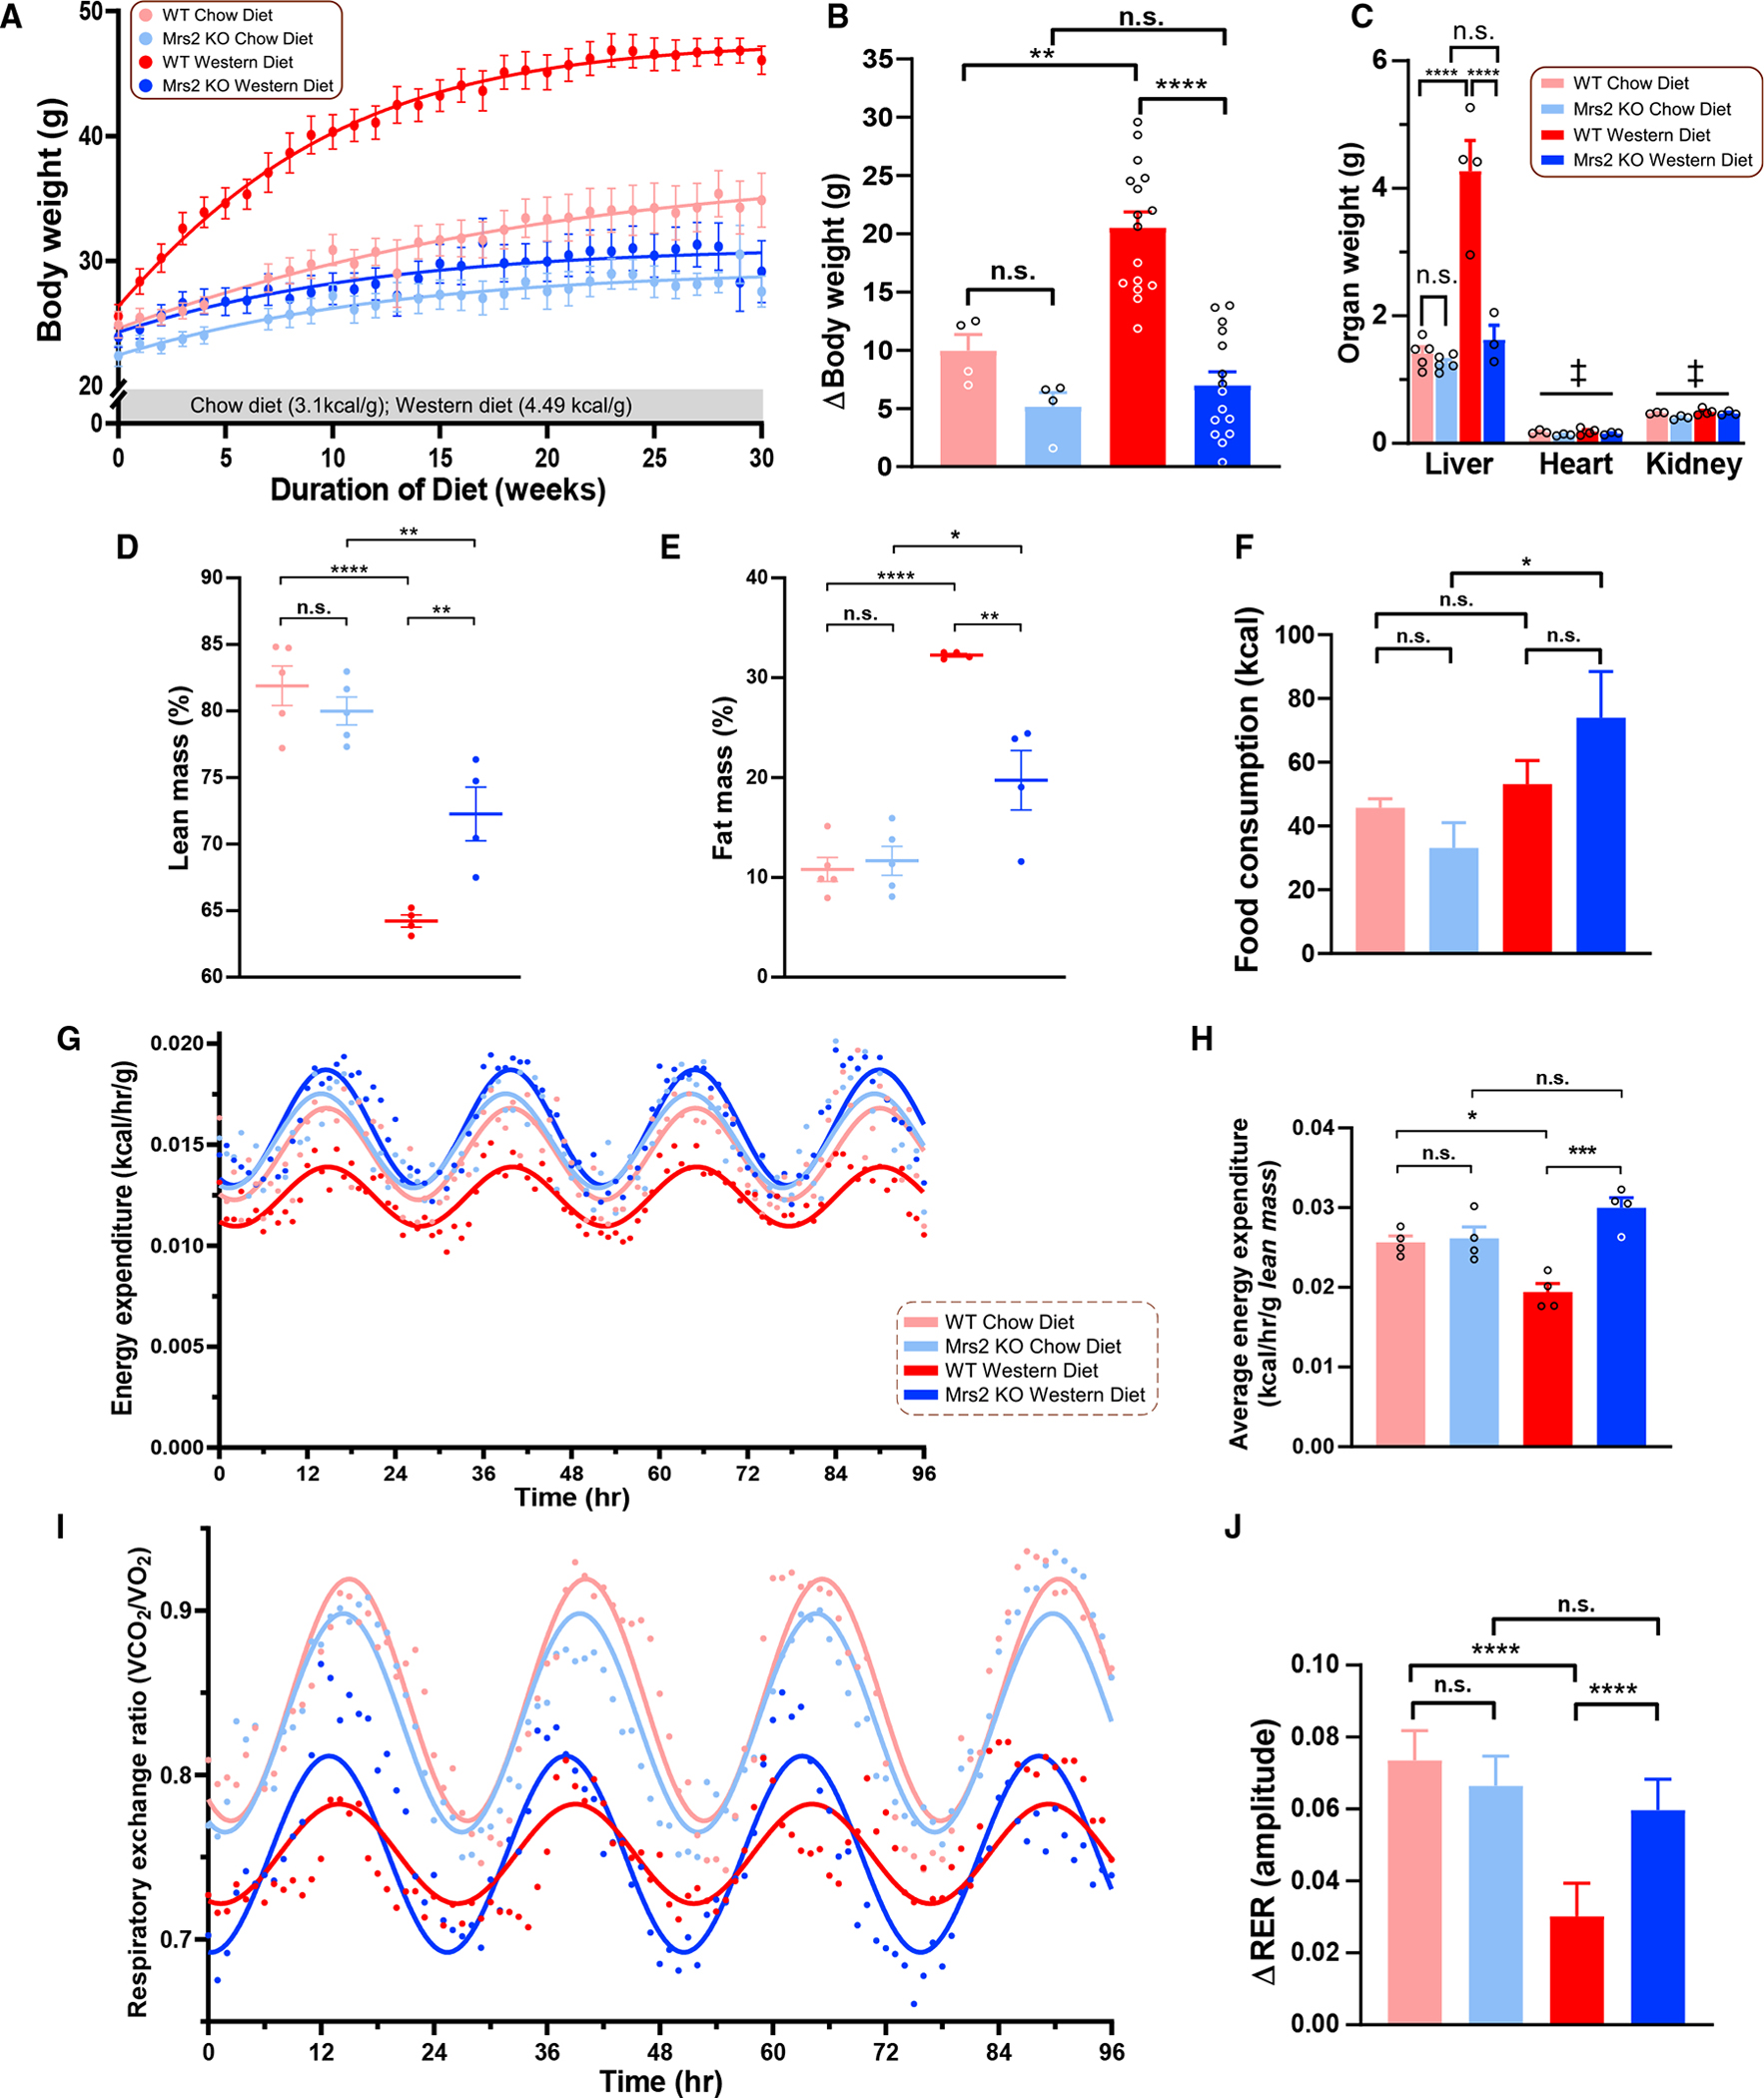
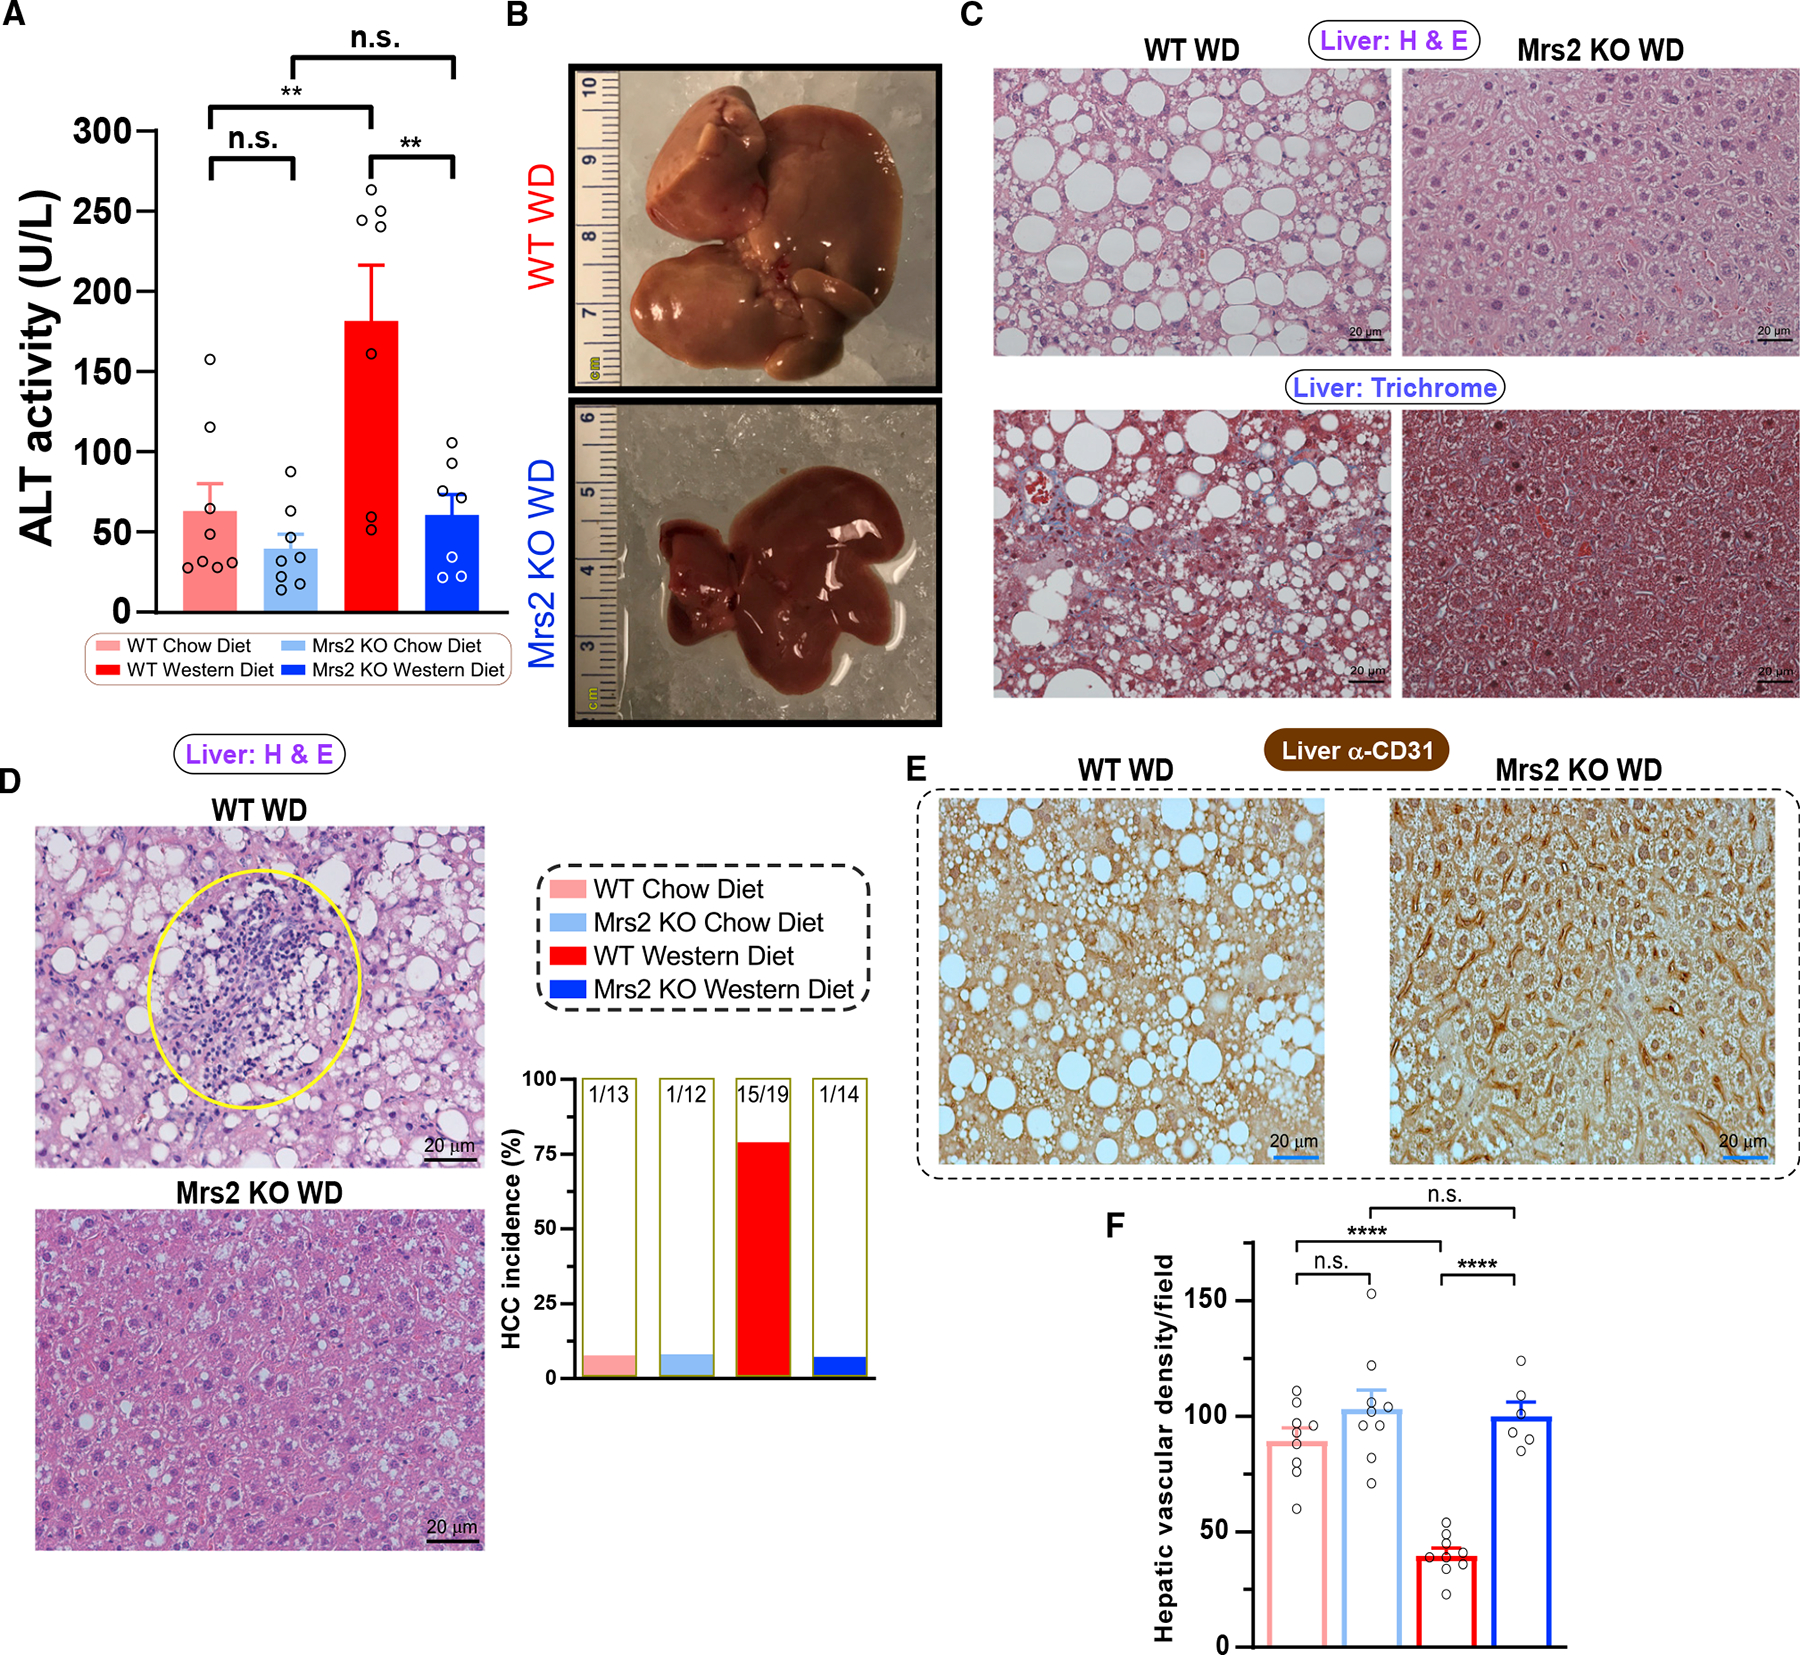
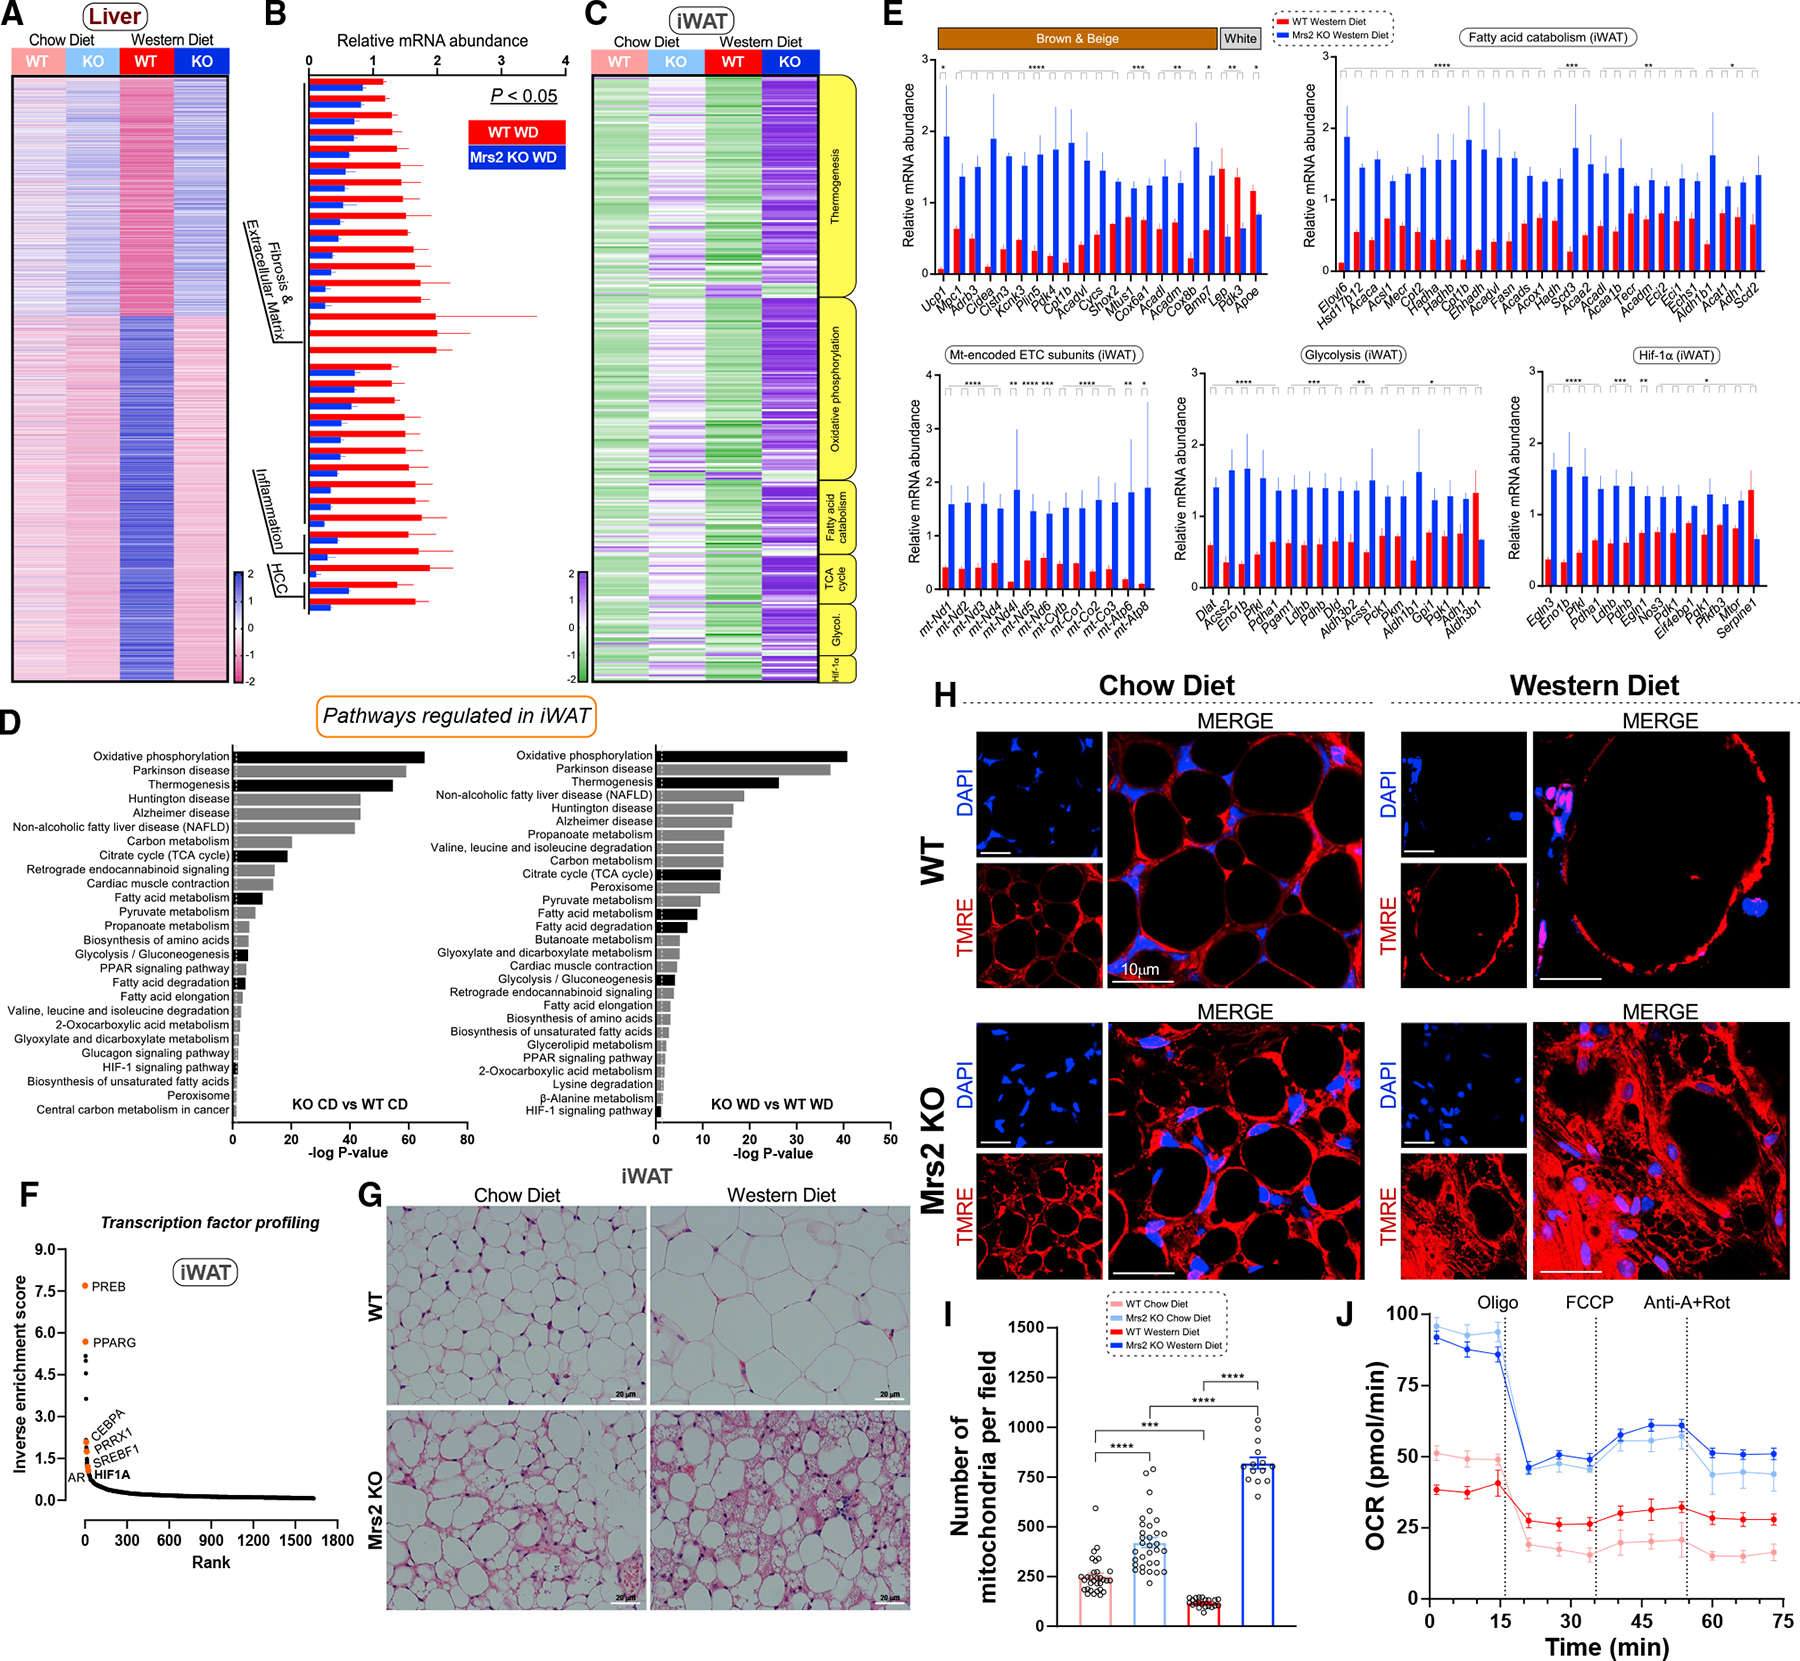
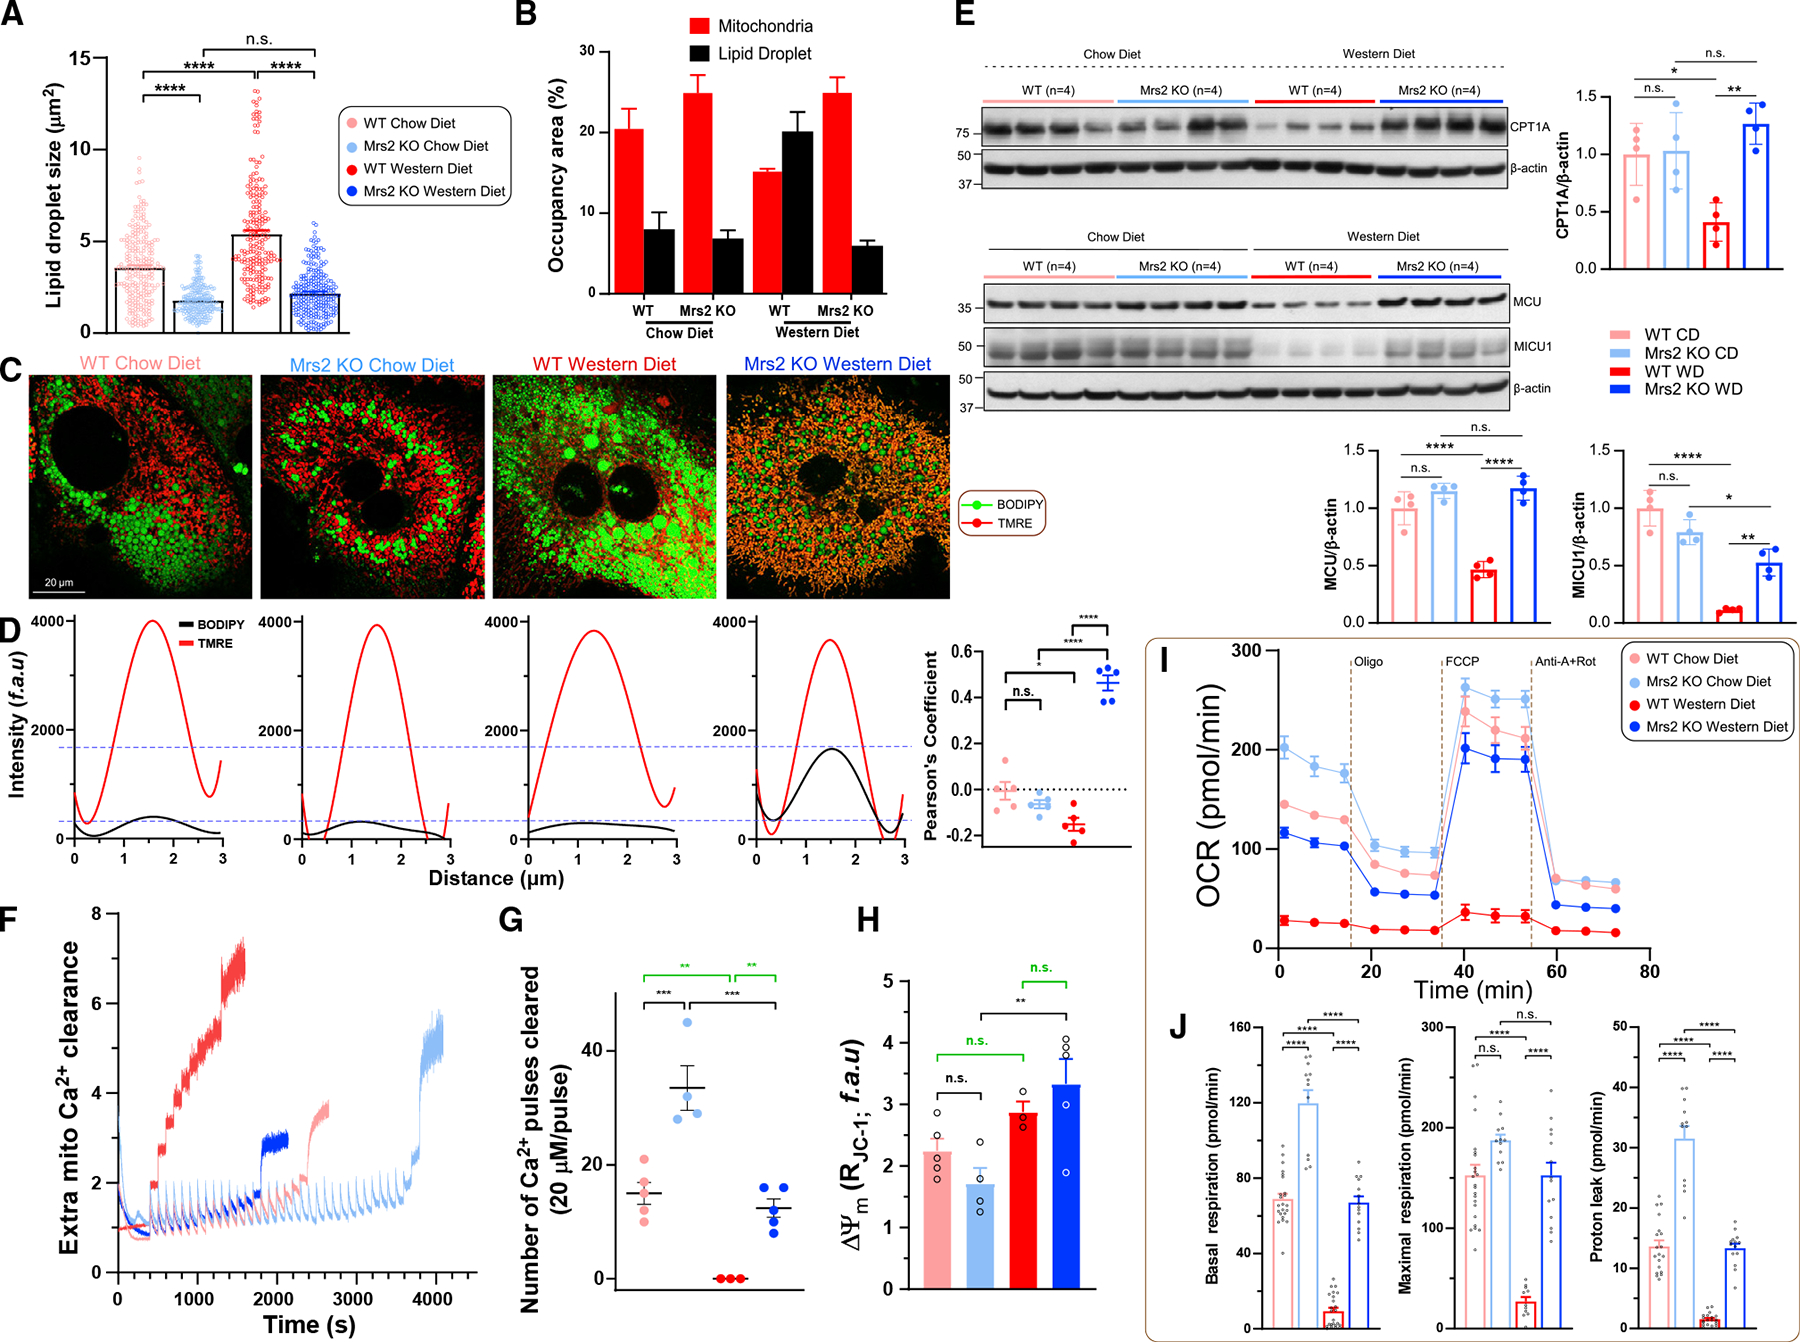
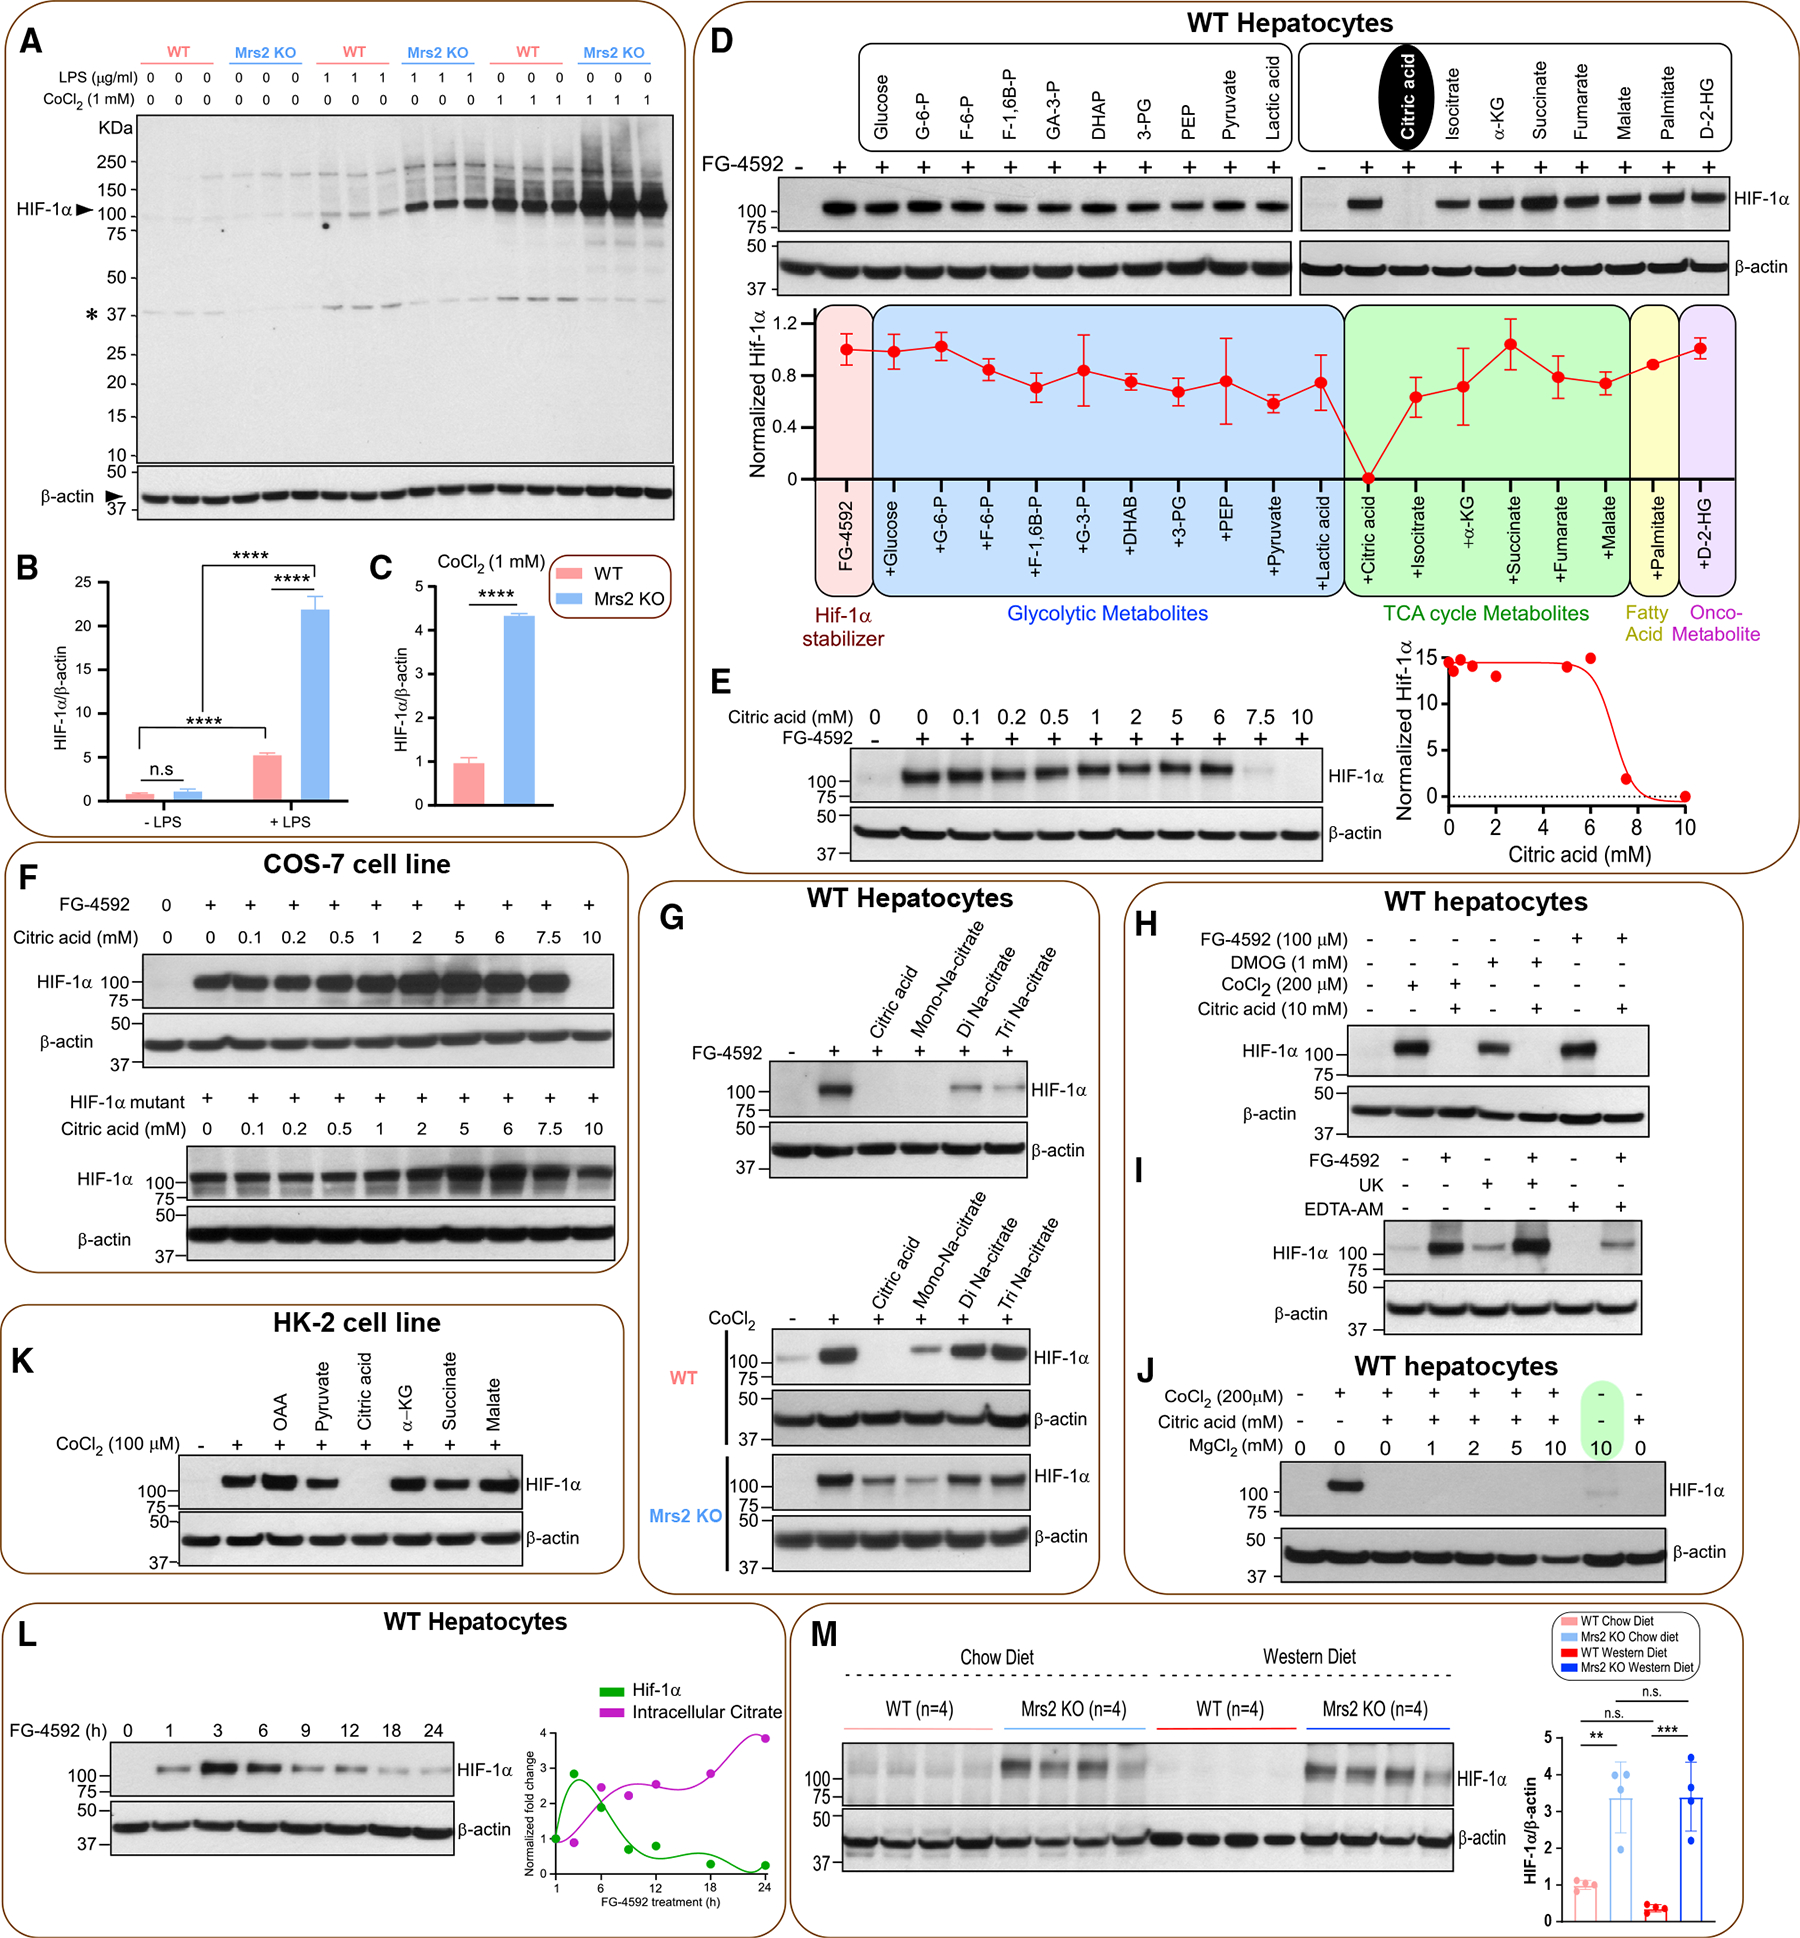
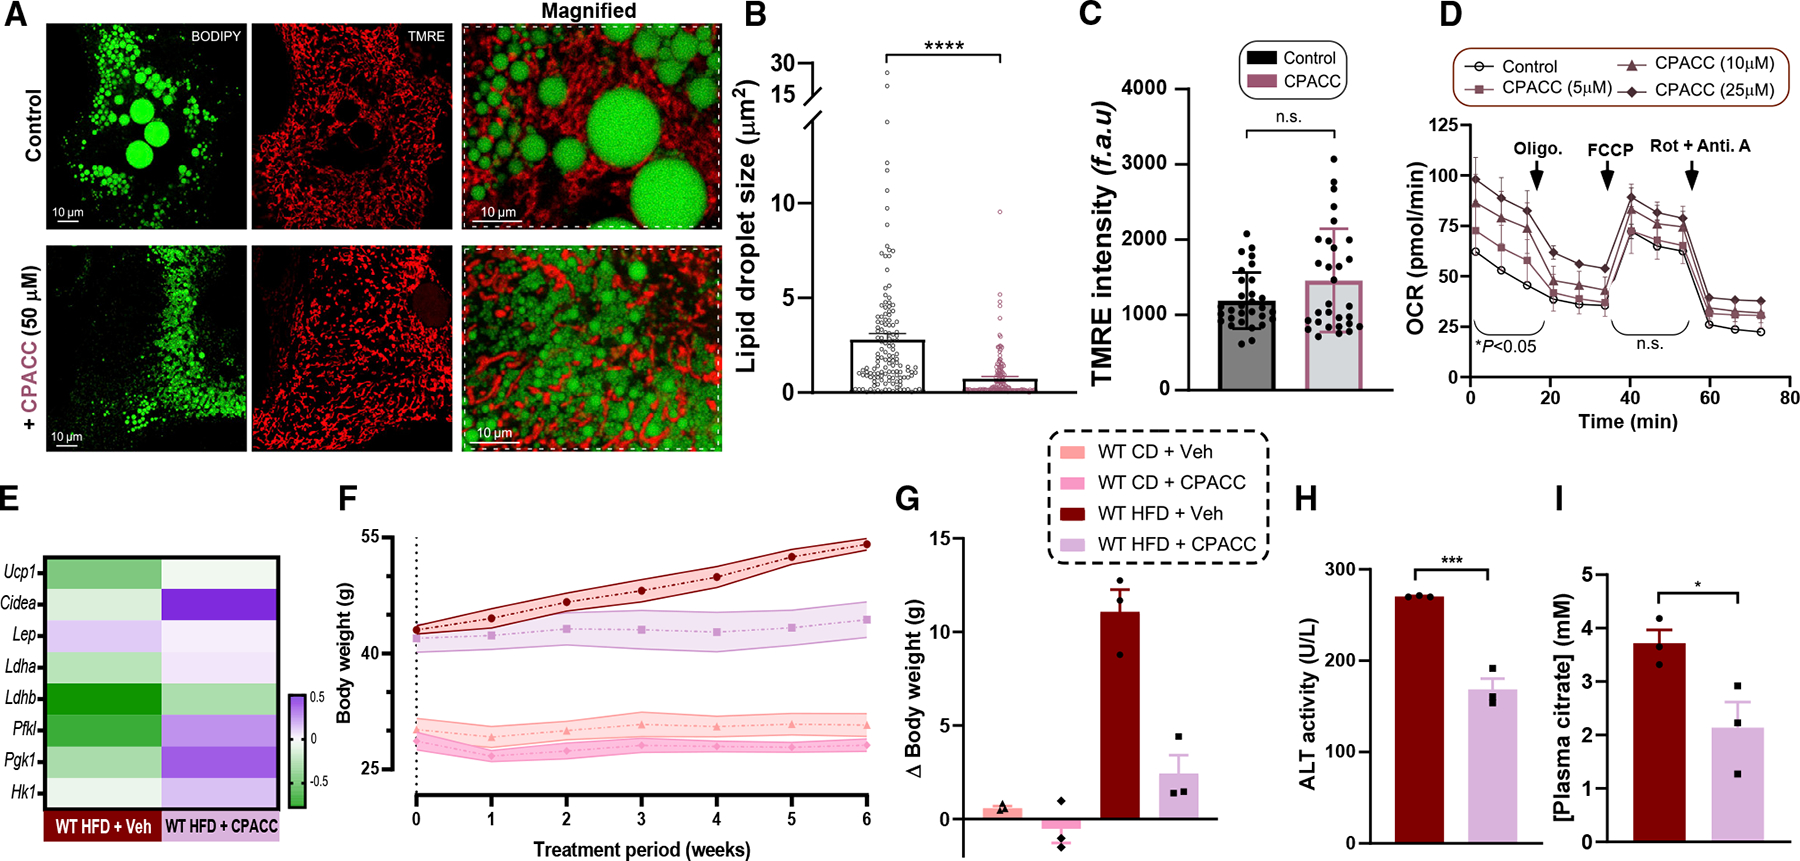
The most abundant cellular divalent cations, Mg2+ (mM) and Ca2+ (nM-μM), antagonistically regulate divergent metabolic pathways with several orders of magnitude affinity preference, but the physiological significance of this competition remains elusive. In mice consuming a Western diet, genetic ablation of the mitochondrial Mg2+ channel Mrs2 prevents weight gain, enhances mitochondrial activity, decreases fat accumulation in the liver, and causes prominent browning of white adipose. Mrs2 deficiency restrains citrate efflux from the mitochondria, making it unavailable to support de novo lipogenesis. As citrate is an endogenous Mg2+ chelator, this may represent an adaptive response to a perceived deficit of the cation. Transcriptional profiling of liver and white adipose reveals higher expression of genes involved in glycolysis, β-oxidation, thermogenesis, and HIF-1α-targets, in Mrs2-/- mice that are further enhanced under Western-diet-associated metabolic stress. Thus, lowering mMg2+ promotes metabolism and dampens diet-induced obesity and metabolic syndrome.

Keywords: CP: Metabolism; HCC; HIF1; MCU; Mrs2; NAFLD; Western diet; adipose expansion; adipose tissue; calcium channel; cardiometabolic disease; diabetes; energy imbalance; hepatocytes; liver; magnesium channel; metabolic disease; metabolic syndrome; mitochondrial dysfunction; obesity; whole-body metabolism.


Conflict of interest statement

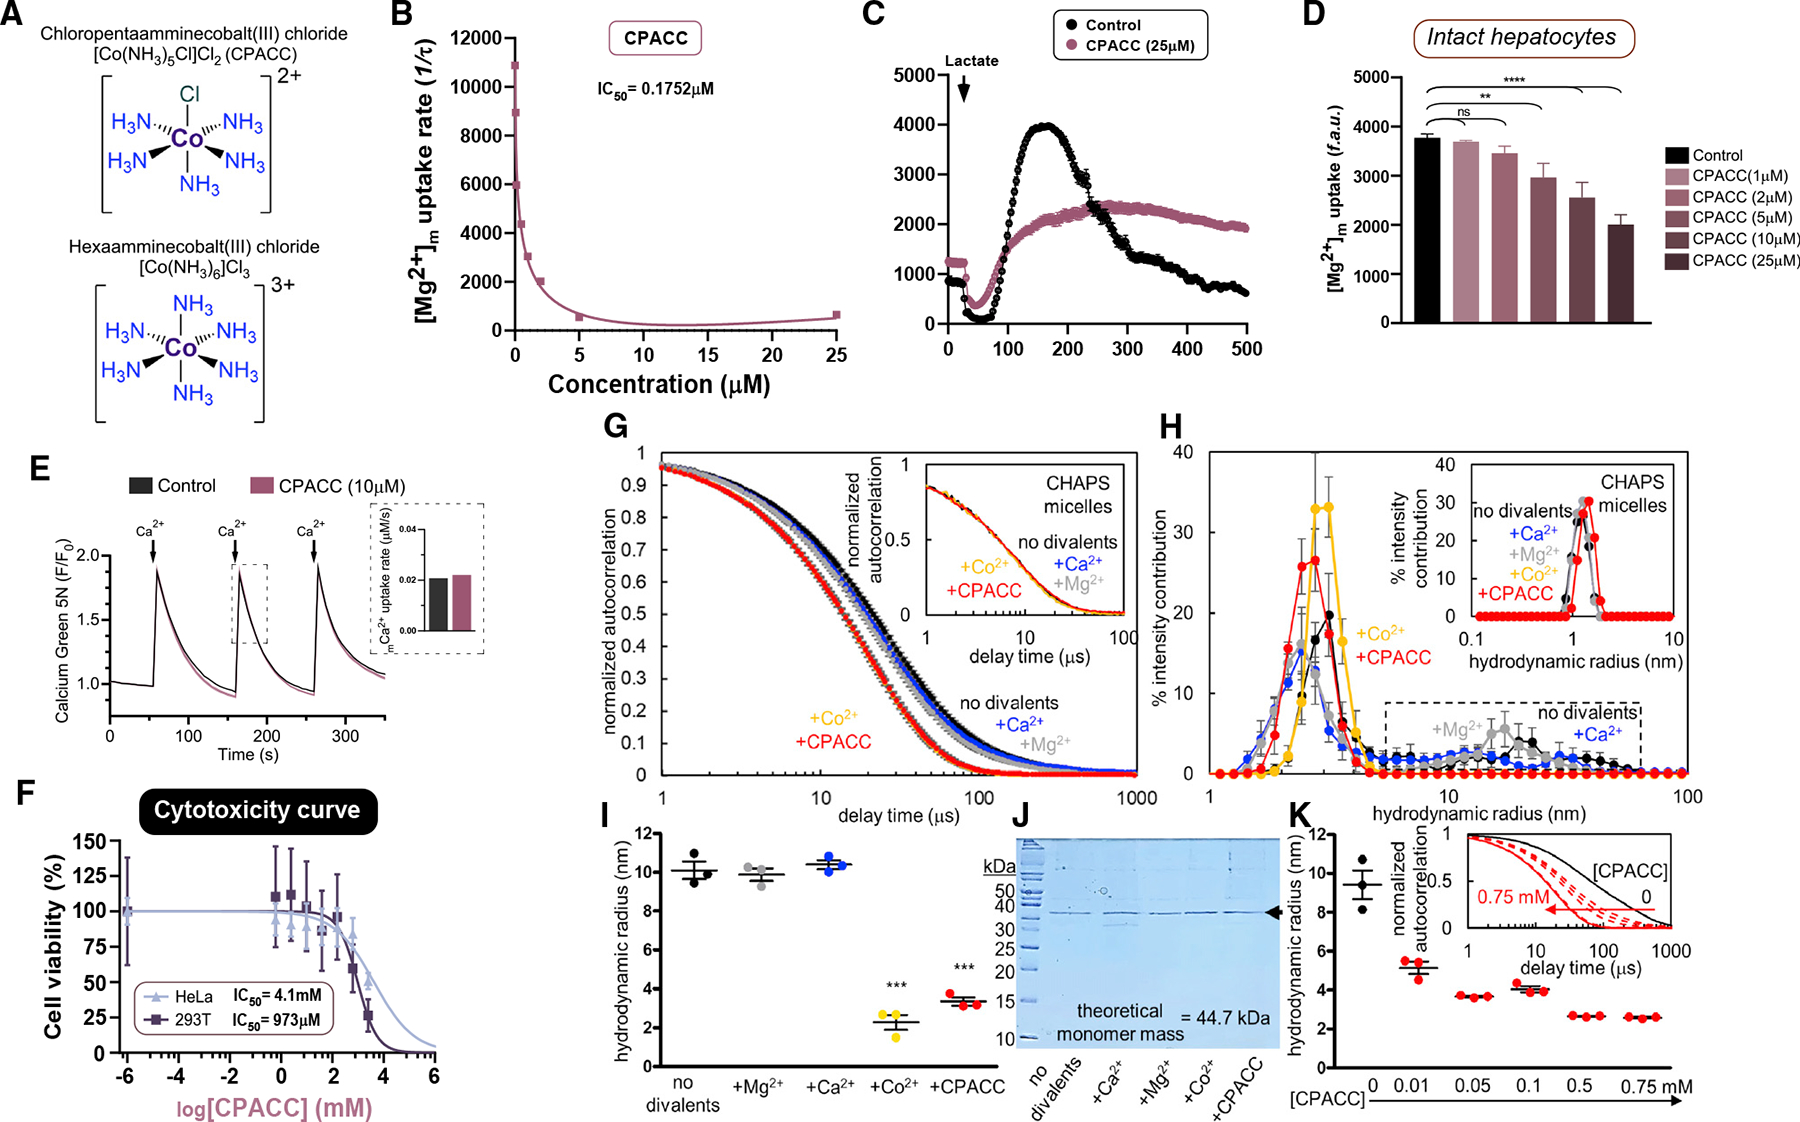
Declaration of interests M.M. is an inventor on a patent filed by UTHSA on CPACC as a Mrs2 blocker for Mg(2+) in physiology and disease. J.A.B. is a consultant to Pfizer.

Figures

Figure 1.
Figure 1.. Blocking mitochondrial Mg2+ uptake prevents diet-induced obesity
(A) Body weight change over a 30-week diet period. Data fit with a Gompertz growth curve (n = 4–16 mice/group). (B) Weight gained during the dietary regimen. (C) Liver, heart, and kidney weights after 1 year diet period. ‡ = Not significant, multiple comparisons are done the same as the liver. n = 3–4 mice (organs) per group. (D and E) Percent lean mass (D) and fat mass (E) of indicated groups. n = 3–4 mice. (F) Measurement of food intake of 1 year CD- or WD-fed mice during indirect calorimetry with Promethion system. (G) Energy expenditure of CD- or WD-fed (1 year) WT or Mrs2−/− mice. Data fit with a fixed-frequency sinusoidal equation y = B + A sin(0.25x + ϕ). n = 4–5 mice. (H) Lean mass-normalized energy expenditure data derived from (G). (I) Respiratory exchange ratio (RER) of CD- or WD-fed (1 year) WT or Mrs2−/− mice. Data fit with a fixed-frequency sinusoidal equation y = B + A sin(0.25x+ϕ). n = 4–5 mice. (J) The change in RER from light to dark cycle. All data shown as mean ± SEM; ****p < 0.0001, ***p < 0.001, **p < 0.01, *p < 0.05, n.s. = not significant.
Figure 2.
Figure 2.. Mrs2 deletion prevents the progression of NAFLD and development of HCC
(A) ALT levels in the plasma after 1-year diet period. n = 7–8 mice. (B) Representative liver from WD-fed (1 year) mice, WT (top) and Mrs2−/− (bottom). Scale indicates centimeter. (C) Representative liver tissue sections stained with H&E (top) and Masson’s trichrome (bottom) from WT and Mrs2−/− fed WD. n = 3 mice. (D) Representative images of H&E-stained liver sections from 1-year WD-fed mice (WT, top and Mrs2−/−, bottom). Note a focus of immune cell infiltrates (circled) an indicator of tumor nodules. Bar graph represents the hepatocellular carcinoma (HCC) incidence in these four groups. n = 12–19 mice/group. (E) Immunohistochemical (IHC) analysis (α-CD31/PECAM1) of sinusoidal vasculature in liver from WD-fed WT (left) and Mrs2−/− mice (right). n = 3 mice. (F) Quantification of hepatic microvascular density from Figure 2E n = 3 mice. Nine images per group were used for quantification. All data shown as mean ± SEM; ****p < 0.0001, **p < 0.01, n.s. = not significant.
Figure 3.
Figure 3.. Blunting mMg2+ dynamics enhances hepatic oxidative metabolism profiles and adipocyte browning under Western diet regimen
(A) Heatmap depicts differentially expressed genes (adj. p < 0.05) in liver tissue from CD- or WD-fed Mrs2−/− vs. WT mice. Values shown as row Z scores. n = 3 mice. (B) Expression of key marker genes associated with fibrosis/extracellular matrix, inflammation, and HCC (liver; WD-fed mice). Significance was determined by an adjusted p-value of p < 0.05. The FPKM was normalized and expressed as relative mRNA abundance. (C) Targeted KEGG analysis of iWAT from WT and Mrs2−/− mice fed CD or WD (see STAR Methods). Values shown as row Z scores. n = 3 mice/group. (D) KEGG gene set enrichment analysis of iWAT with all significantly (adjusted p < 0.05) differentially regulated pathways shown in chow diet comparison (left) and Western diet comparison (right). Pathways of interest are indicated (black). The dotted line indicates significant threshold. (E) Targeted differential enrichment analysis of adipose tissue from WD-fed WT and Mrs2−/−mice. Graphs indicate key adipose genes, mitochondrial encoded electron transport chain (ETC) subunits, and differentially regulated genes from KEGG pathways indicated as fatty acid catabolism, glycolysis, and HIF1-α signaling. All data are normalized like (B), n = 4 mice. p-values extracted from differential gene expression analysis. Data are mean ± SEM; ****p < 0.0001, ***p < 0.001, **p < 0.01, *p < 0.05. (F) Transcription factor analysis of WD iWAT using rank-based ChEA software. Select transcription factors highlighted. Y axis depicts mathematical inverse of the enrichment score 3 100. (G) Representative H&E staining of adipose tissue from WT and Mrs2−/− either fed with CD or WD. n = 4 mice/group. (H and I) Adipose tissue explants were stained with ΔΨm indicator (TMRE) and DAPI. Live images were acquired and mitochondrial density was quantified (I). n = 3 mice. Fourteen to 32 images per group were used for analysis. (J) iWAT homogenate from WT and Mrs2−/− mice were subjected to OCR measurement. n = 3 mice.
Figure 4.
Figure 4.. Loss of Mrs2 enhances mitochondrial bioenergetics in hepatocytes from mice fed a Western diet
(A and B) Quantification of hepatocyte lipid droplet size and comparison of occupancy by mitochondria (red) and lipid droplet (black) areas in 1 year diet fed mice. n = 3–4 mice. (C) Representative confocal images of hepatocytes were acquired after staining with lipid/fatty acid marker BODIPY-488 and ΔΨm indicator TMRE. n = 3 isolations. (D) Spatial overlap and intensity profiles of mitochondrial colocalization of BODIPY and TMRE signals. n = 3 isolations. (E) Western analysis of mitochondrial carnitine palmitoyltransferase 1A and MCU complex, MCU and MICU1 protein abundance in liver tissues harvested fromWT and Mrs2−/− mice. n = 4 mice. (F–H) Assessment of MCU-mediated mCa2+ uptake (F), retention capacity (G), ΔΨm (H). n = 4 mice. (I) OCR measurement of hepatocytes from WT and Mrs2−/− normalized to total protein content. n = 3 mice. (J) Basal and maximal respiration and proton leak from (I). Data represent individual wells from three different hepatocyte isolations in each group. All data shown as mean ±SEM; ****p < 0.0001, ***p < 0.001, **p < 0.01, *p < 0.05, n.s. = not significant.
Figure 5.
Figure 5.. Loss of Mrs2 stabilizes and citric acid destabilizes HIF-1α
(A) Hepatocytes were treated with LPS or CoCl2 for 6 h. Total lysates were subjected to Western blot analysis to determine HIF-1α protein abundance. n = 3 isolations. (B and C) ImageJ analysis of HIF-1α protein abundance. (D) WT hepatocytes were treated with PHD inhibitor FG-4592 (100 mM) for 6 h with or without metabolites. Total cell lysates were probed for HIF-1α protein abundance (see STAR Methods) and quantified (bottom panel) (n = 2). (E) Dose curve for citrate-induced HIF-1α destabilization. Right panel shows the normalized protein abundance (n = 2). (F) Top panel shows citrated induced HIF-1α degradation in the presence of various doses of citrate in COS-7 cells (n = 2). Bottom panel depicts the effect of citrate on HIF-1α mutant protein stabilization (n = 2). (G) Top panel shows the effect of citrate derivatives on FG4592-mediated HIF-1α stabilization (n = 2). Bottom panel shows the effect of citrate on CoCl2-mediated HIF-1α stabilization in WT or Mrs2−/− hepatocytes (n = 2). (H) Effect of citrate on FG-4952, DMOG, or CoCl2-dependent HIF-1α stabilization in WT hepatocytes (n = 2). (I) Effect of mitochondrial pyruvate transport blocker UK5099 or iMg2+ chelator EDTA-AM on HIF-1α stabilization (n = 2). (J) Effect of MgCl2 supplementation on HIF-1α stabilization under normoxia (n = 2). (K) Effect of TCA cycle citrate precursor OAA or a-KG on HIF-1α destabilization (n = 2). (L) Intracellular accumulation of citrate elicits HIF-1α destabilization. Right panel depicts reciprocal action of citrate on FG-4592-dependent HIF-1α stabilization (n = 3). (M) Western blot analysis of HIF-1α protein stabilization in liver tissues harvested from the 1-year diet period of WT and Mrs2−/− mice (n = 4/group). Densitometric analysis of HIF-1α protein from (M). All data shown as mean ± SEM; ****p < 0.0001, ***p < 0.001, **p < 0.01, n.s. = not significant.
Figure 6.
Figure 6.. CPACC selectively inhibits Mrs2 activity
(A) Chemical structures of chloropentaammine cobalt(III) chloride [Co(NH3)5Cl]Cl2 (CPACC) and hexaamminecobalt(III) chloride [Co(NH3)6]Cl3. (B) Dose-response curve of permeabilized hepatocytes pulsed with 1 mM MgCl2 with increasing concentrations of CPACC. n = 3. (C and D) Effect of CPACC on Mrs2-mediated mMg2+ uptake in intact hepatocytes (C) and its quantification (D). n = 3–4. ****p < 0.0001, **p < 0.01, n.s. = not significant. (E) Spectrofluorimetric measurement of MCU-mediated Ca2+ uptake in control (n = 1) or 10 μM CPACC (n = 3) treated HeLa cells. Quantification of mCa2+ uptake rate (inset). (F) Cytotoxicity dose-response curves for CPACC in HeLa and HEK293T cells. n = 3 (replicates; n = 6). (G) Autocorrelation functions of human MRS258–443 (0.5 mg/mL) with and without 5 mM MgCl2, CaCl2 and CoCl2 and 0.5 mM CPACC. Inset shows micelles without protein. (H) Hydrodynamic radii distribution derived from (G). Dashed box highlights the disappearance of higher order oligomers only in the presence of CoCl2 and CPACC. Inset shows micelles without protein. (I) Weight-averaged hydrodynamic radii based on cumulants deconvolution of autocorrelation functions shown in (G). (J) Coomassie blue-stained SDS-PAGE gel (15% [w/v]) confirming the divalent cations and CPACC do not affect MRS258–443 integrity. (K) Cumulants-determined weight-averaged hydrodynamic radii of MRS258–443 (0.5 mg/mL) as a function of increasing CPACC, highlighting the concentration-dependent decrease in particle size. Inset shows a systematic shift to earlier decay times with increasing CPACC levels. Mean ± SEM; n = 3. ***p < 0.001 for + Co2+ and +CPACC compared with no divalent cation, +Mg2+ and +Ca2+ groups.
Figure 7.
Figure 7.. Limiting Mrs2-mediated Mg2+ uptake by CPACC reduces lipid droplet size and promotes mitochondrial function, thus preventing weight gain in vivo
(A) Visualization of hepatocytes isolated from 12-month-old WT mice using BODIPY-488 (left) and TMRE (middle), with or without CPACC (50 μM) treatment for 48 h. (B and C) Quantification of lipid droplet size and ΔΨm from (A). n = 3–4. (D) OCR rate in WT hepatocytes with or without CPACC treatment. n = 3. (E) Heatmap of normalized fold change of mRNA in iWAT from HFD-fed WT with or without intraperitoneal (i.p.) CPACC treatment. n = 3 mice. (F) WT mice were fed HFD or CD for 14 weeks followed by CPACC (20 mg/kg) or vehicle for additional 6 weeks i.p. every 3 days. The body weight was measured weekly. n = 3 mice. (G) Body weight change during the 6-week treatment period. (H and I) Plasma ALT (H) and citrate (I) levels of HFD-fed WT with or without CPACC treatment. n = 3 mice. Data shown as mean ± SEM; ****p < 0.0001, ***p < 0.001, *p < 0.05, n.s. = not significant.

Comment in

References

    1. Edgar R, Domrachev M, and Lash AE (2002). Gene Expression Omnibus: NCBI gene expression and hybridization array data repository. Nucleic Acids Res. 30, 207–210. 10.1093/nar/30.1.207. - DOI - PMC - PubMed
    1. Fu S, Yang L, Li P, Hofmann O, Dicker L, Hide W, Lin X, Watkins SM, Ivanov AR, and Hotamisligil GS (2011). Aberrant lipid metabolism disrupts calcium homeostasis causing liver endoplasmic reticulum stress in obesity. Nature 473, 528–531. 10.1038/nature09968. - DOI - PMC - PubMed
    1. de Baaij JHF, Hoenderop JGJ, and Bindels RJM (2015). Magnesium in man: implications for health and disease. Physiol. Rev. 95, 1–46. 10.1152/physrev.00012.2014. - DOI - PubMed
    1. Tomar D, Jaña F, Dong Z, Quinn WJ 3rd, Jadiya P, Breves SL, Daw CC, Srikantan S, Shanmughapriya S, Nemani N, et al. (2019). Blockade of MCU-mediated Ca(2+) uptake perturbs lipid metabolism via PP4-dependent AMPK dephosphorylation. Cell Rep. 26, 3709–3725.e7. 10.1016/j.celrep.2019.02.107. - DOI - PMC - PubMed
    1. Picard M, Wallace DC, and Burelle Y (2016). The rise of mitochondria in medicine. Mitochondrion 30, 105–116. 10.1016/j.mito.2016.07.003. - DOI - PMC - PubMed

Publication types