. 2023 Mar 1;19(3):e1010880.
doi: 10.1371/journal.pcbi.1010880. eCollection 2023 Mar.

Modelling daily weight variation in honey bee hives

Affiliations

Modelling daily weight variation in honey bee hives

Karina Arias-Calluari et al. PLoS Comput Biol. .

Abstract

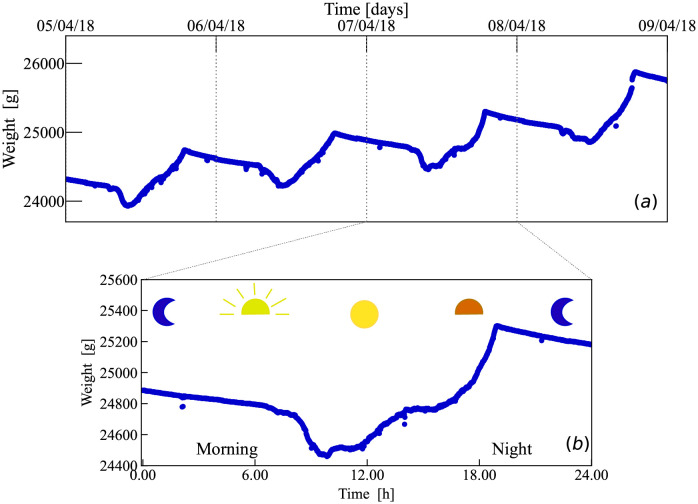
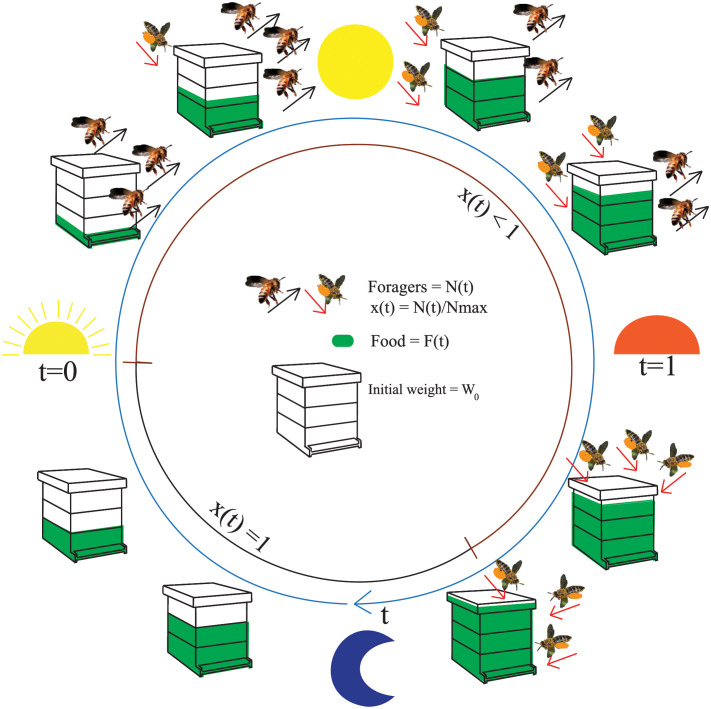
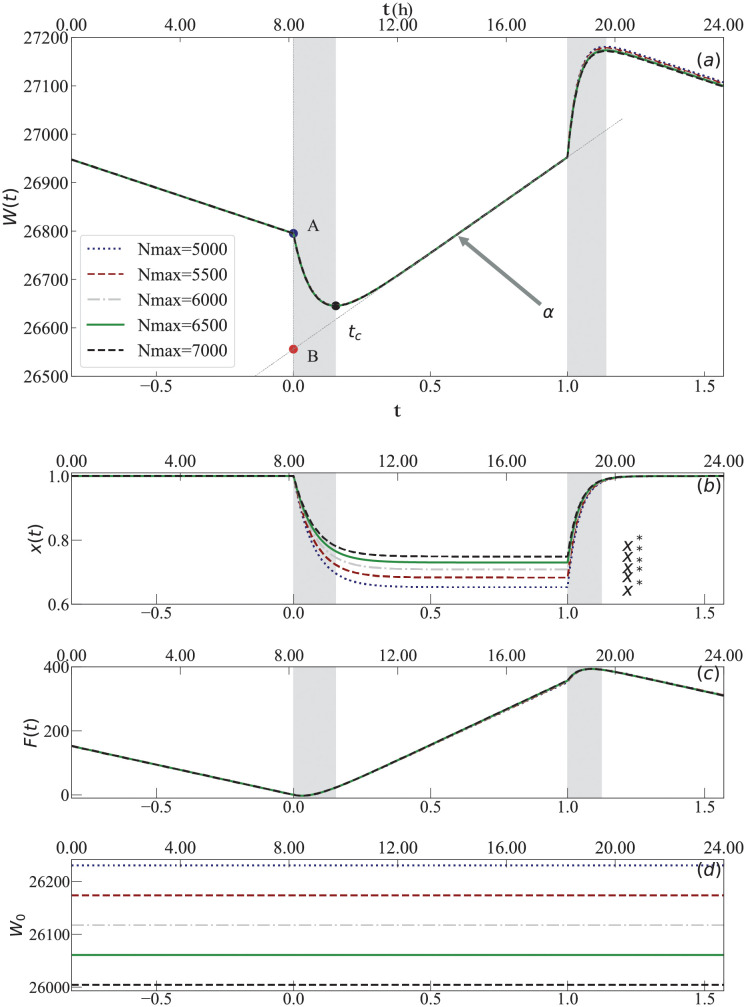
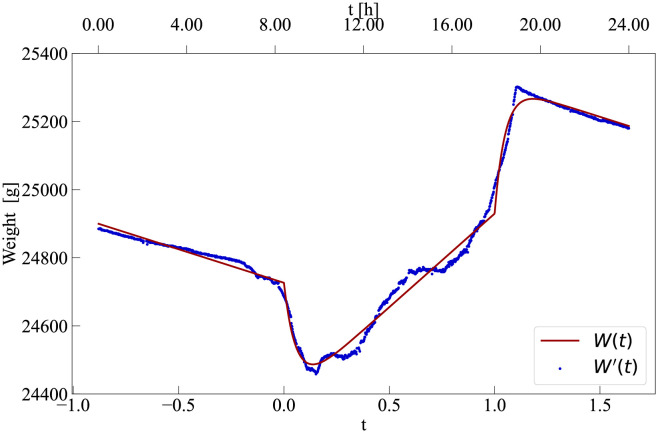
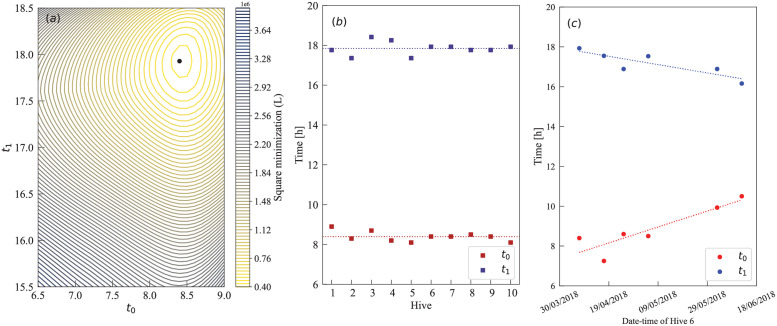
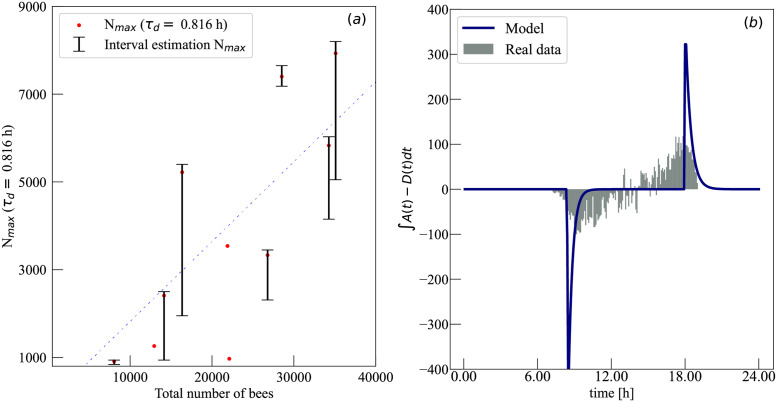
A quantitative understanding of the dynamics of bee colonies is important to support global efforts to improve bee health and enhance pollination services. Traditional approaches focus either on theoretical models or data-centred statistical analyses. Here we argue that the combination of these two approaches is essential to obtain interpretable information on the state of bee colonies and show how this can be achieved in the case of time series of intra-day weight variation. We model how the foraging and food processing activities of bees affect global hive weight through a set of ordinary differential equations and show how to estimate the parameters of this model from measurements on a single day. Our analysis of 10 hives at different times shows that the estimation of crucial indicators of the health of honey bee colonies are statistically reliable and fall in ranges compatible with previously reported results. The crucial indicators, which include the amount of food collected (foraging success) and the number of active foragers, may be used to develop early warning indicators of colony failure.


Conflict of interest statement

The authors have declared that no competing interests exist.

Figures

Fig 1
Fig 1
(a) The weight of a bee hive shows systematic variations throughout a day. The blue dots show the weight of a hive measured every minute for four consecutive days. (b) Each daily hive weight’s curve present consistent patterns at specific time ranges of morning, afternoon, evening and night time.
Fig 2
Fig 2. Schematic representation of the daily cycle of bee activities relevant to modeling colony weight, where time flows in a clockwise direction (blue line).
The main time-dependent elements we model are the number of forager bees N(t) and the food F(t) (in green) inside the hive. The foragers are represented as active bees that depart the hive (black arrow) and return to it (red arrow) with food (in orange). The ratio of forager bees inside the hive at a particular time is represented by x(t), which is constant before and after the dynamics of forager bees because the Nmax foragers are all inside the hive. The static weight W0 is composed of the hive structure and bees that do not leave the hive.
Fig 3
Fig 3. Graphical representation of the solution of our model.
(a) The weight as a function of time, W(t), in which the three linear regimes and the two transition regimes (shaded areas) are visible. (b-d) The three key elements that compose W(t): (b) the number of foragers inside the hive x(t) that converges to the constant value x*; (c) the amount of food F(t) inside the hive; and (d) the constant weight of the hive W0. In all four plots, five curves are shown for different model parameters θ = {Nmax, W0, a1, a2, d, m, = 18.74 g/h, w = 0.113 g/bee} that lead to the same effective parameters A, B, tc, α shown in panel (a). The values of the remaining parameters in numerical order for Nmax are W0[g] = 26230, 26173, 26117, 26060, 26004; a1[1/h] = 0.882, 0.914, 0.941, 0.964, 0.984; a2[1/h] = 2.329, 2.328, 2.328, 2.327, 2.327; d[1/h] = 0.469, 0.424, 0.387, 0.356, 0.330; and m[g/bee] = 0.038, 0.037, 0.036, 0.035, 0.034. The two grey spans highlight the time intervals of exponential decay and growth in x(t), respectively.
Fig 4
Fig 4. Comparison between the model and data.
Data corresponds to measurements on 2018–4-7 for ‘Hive 6’. By fixing τd = 49 min, the estimated parameters are Nmax = 5830 bees, W0 = 24068 g, m = 0.03 g/bee, a1 = 0.99 h−1, a2 = 2.1 h−1, d = 0.85 h−1, l = 20.66 g/h, t0 = 8.40 h and t1 = 17.93 h.
Fig 5
Fig 5. Inference of activity times t0 and t1.
(a) Contour plot of L obtained performing multiple minimizations at fixed t0 and t1 (‘Hive 6’ at 2018–4-7). The minimum L is at t0 = 8.40 h and t1 = 17.93 h. (b) Estimated t0 and t1 fluctuate around similar values for ten different hives located in close proximity when analysing data sets during the same day. E.g. at 2018–4-7, the different activity times oscillate around t0 = 8.4 h and t1 = 17.85 h, respectively (dashed lines). (c) Time evolution for the optimum t0 and t1 for ‘Hive 6’ only. Transitioning from Autumn to Winter, we observe a linear increase for t0 and a linear decrease for t1 (linear regression).
Fig 6
Fig 6. Comparing our model to independent measurements.
(a) Our estimation of the number of active foragers Nmax correlates positively with the total number of bees (R2 = 0.596, p = 0.036). The dashed straight line corresponds to 18.2% of all bees being foragers, constant across all hives. The total number of bees was estimated through an independent measurement performed on 2018–04-9, two days after the data used in our inference [34]. The points without bars correspond to those that had no successful interval estimation, as discussed in Table 2. In all our analysis of correlation between variables, the reported p-value p is the probability of obtaining a positive coefficient of determination R2 equal or larger than the reported R2 under the null hypothesis that the variables are independent from each other. (b) The plot represents the difference between the number of bees arriving and bees departing a honey-bee hive during a 5 minutes interval. The model prediction (blue line) was computed integrating A(t) − D(t) over each time interval. The real data was measured using bee-tracking methods.

References

    1. Goulson D, Nicholls E, Botías C, Rotheray EL. Combined stress from parasites, pesticides and lack of flowers drives bee declines. Science. 2015;347(6229):1255957. - PubMed
    1. Goulson D, Nicholls E, Botías C, Rotheray EL. Bee declines driven by combined stress from parasites, pesticides, and lack of flowers. Science. 2015;347 (6229). doi: 10.1126/science.1255957 - DOI - PubMed
    1. Hladik ML, Main AR, Goulson D. Environmental risks and challenges associated with neonicotinoid insecticides; 2018. - PubMed
    1. Siviter H, Bailes EJ, Martin CD, Oliver TR, Koricheva J, Leadbeater E, et al.. Agrochemicals interact synergistically to increase bee mortality. Nature. 2021;596(7872):389–392. doi: 10.1038/s41586-021-03787-7 - DOI - PubMed
    1. Le Conte Y, Ellis M, Ritter W. Varroa mites and honey bee health: can Varroa explain part of the colony losses? Apidologie. 2010;41(3):353–363. doi: 10.1051/apido/2010017 - DOI

Publication types