. 2023 Mar;9(9):eade1249.
doi: 10.1126/sciadv.ade1249. Epub 2023 Mar 1.

Functional imaging and quantification of multineuronal olfactory responses in C. elegans

Affiliations

Functional imaging and quantification of multineuronal olfactory responses in C. elegans

Albert Lin et al. Sci Adv. 2023 Mar.

Abstract

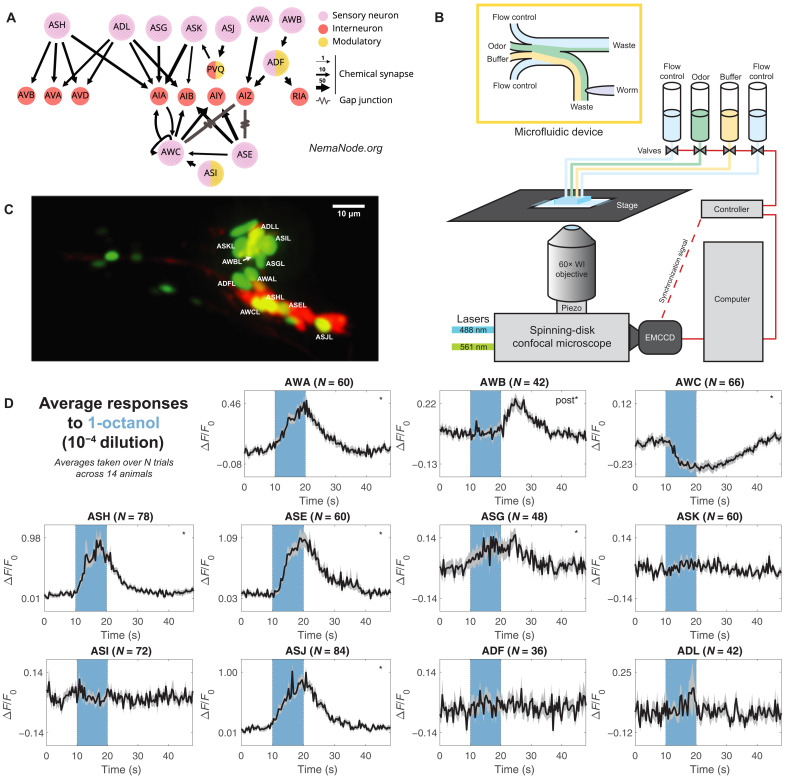
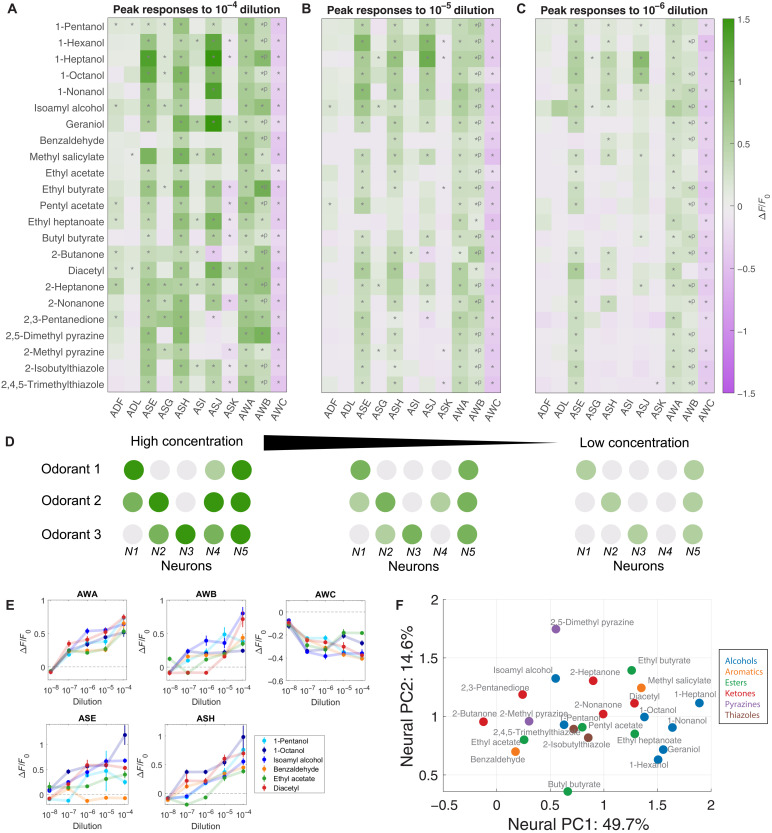
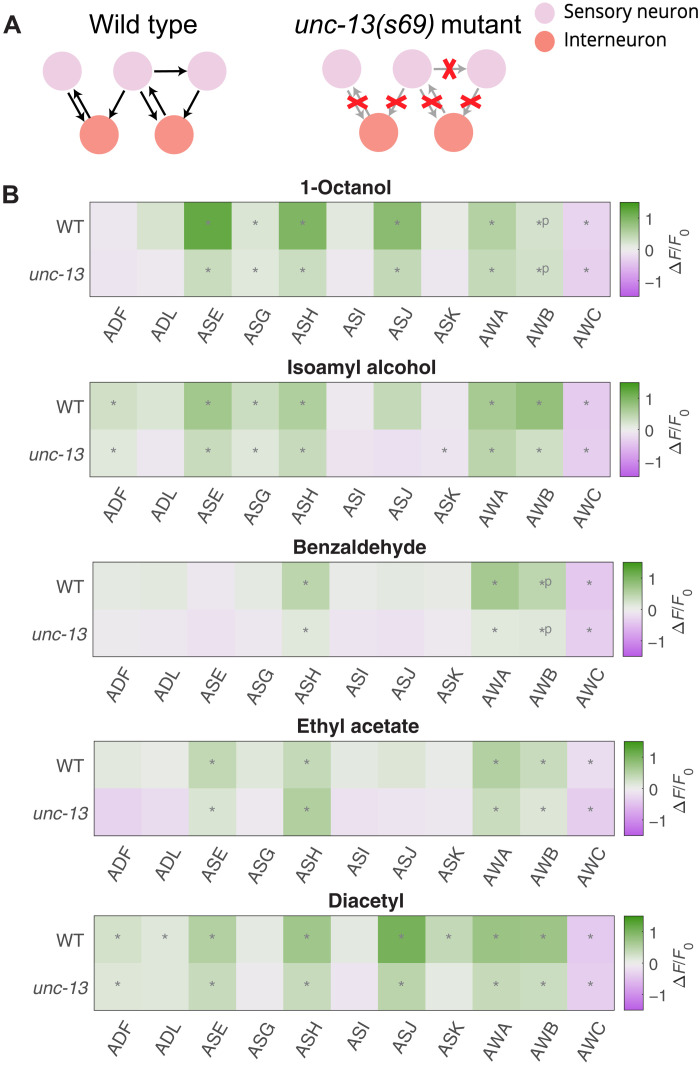
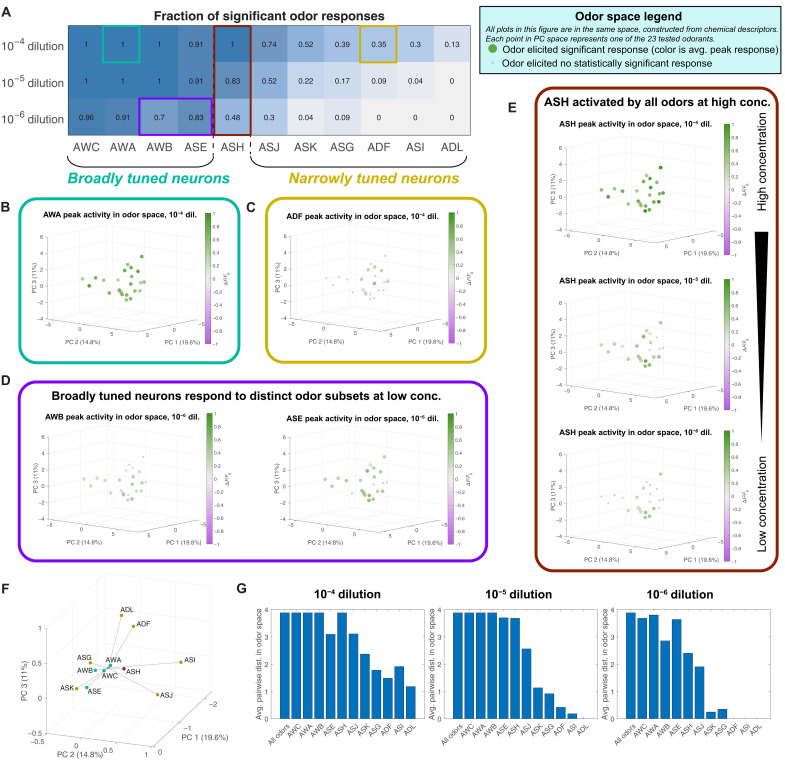
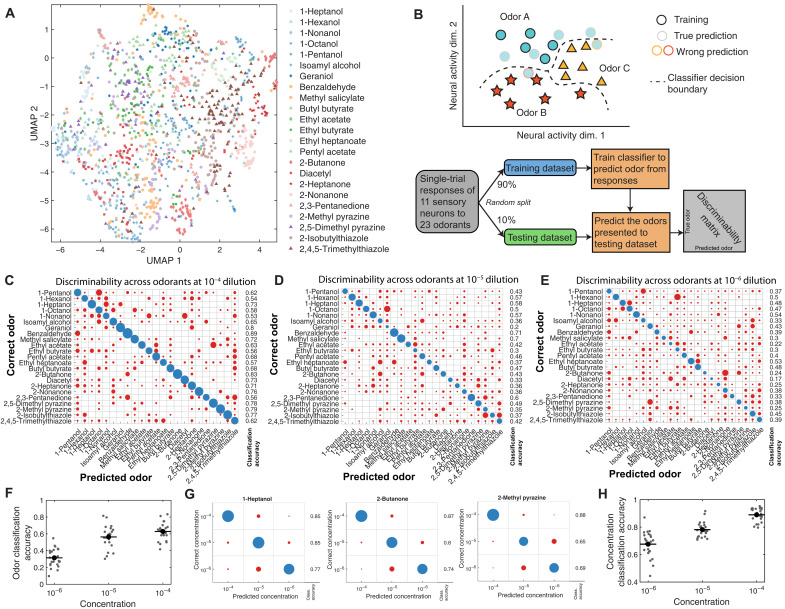
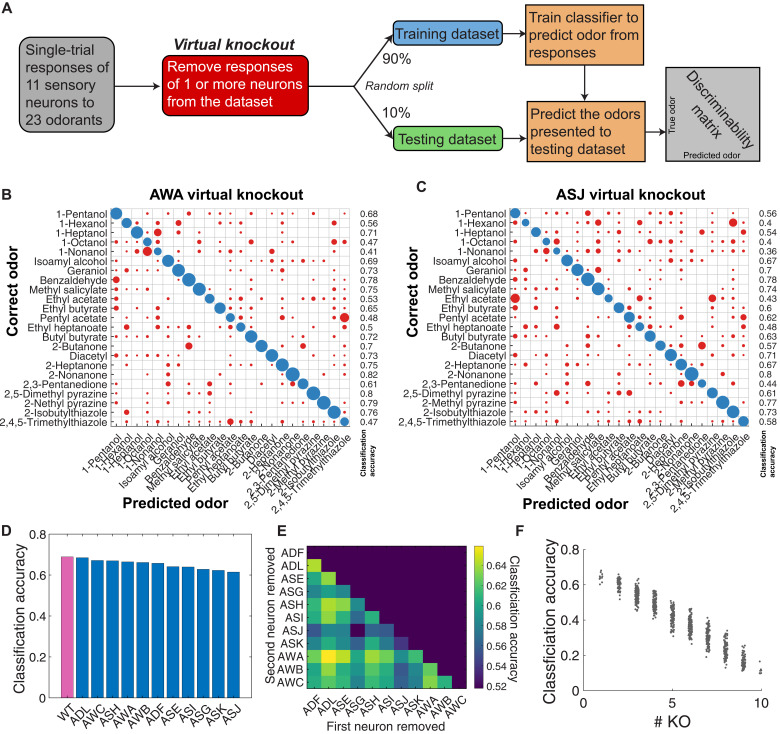
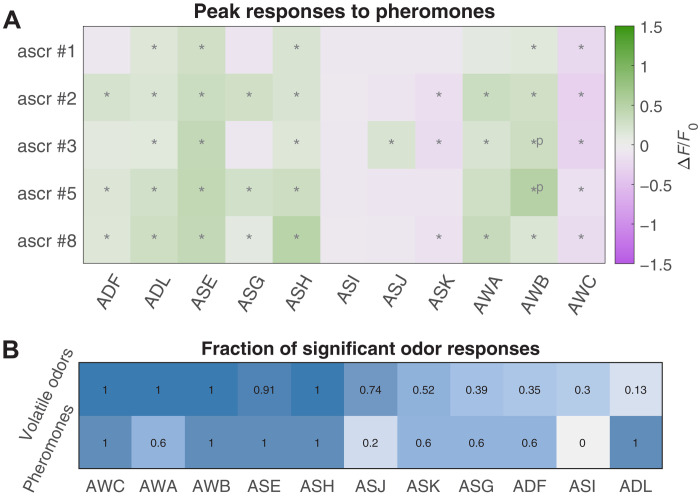
Many animals perceive odorant molecules by collecting information from ensembles of olfactory neurons, where each neuron uses receptors that are tuned to recognize certain odorant molecules with different binding affinity. Olfactory systems are able, in principle, to detect and discriminate diverse odorants using combinatorial coding strategies. We have combined microfluidics and multineuronal imaging to study the ensemble-level olfactory representations at the sensory periphery of the nematode Caenorhabditis elegans. The collective activity of C. elegans chemosensory neurons reveals high-dimensional representations of olfactory information across a broad space of odorant molecules. We reveal diverse tuning properties and dose-response curves across chemosensory neurons and across odorants. We describe the unique contribution of each sensory neuron to an ensemble-level code for volatile odorants. We show that a natural stimuli, a set of nematode pheromones, are also encoded by the sensory ensemble. The integrated activity of the C. elegans chemosensory neurons contains sufficient information to robustly encode the intensity and identity of diverse chemical stimuli.


Figures

Fig. 1.
Fig. 1.. Labeling and recording from chemosensory neurons.
(A) Downstream partners of the 11 chemosensory neurons in the C. elegans connectome (55, 56). Panel generated at nemanode.org. (B) Adult C. elegans were immobilized inside a microfluidic device and controllably presented with odorant solutions. Each animal was volumetrically imaged at 2.5 Hz with a spinning-disk confocal microscope during stimulus presentations. EMCCD, electron multiplying charge-coupled device; WI, water-immersion. (C) Animals expressed nuclear-localized GCaMP6s in all ciliated sensory neurons. A sparse wCherry landmark distinguished the 11 chemosensory neurons. Here, a dual-color maximum projection image shows the head of the worm. The 11 chemosensory neurons on the near (L) side are labeled. For clarity, the chemosensory neurons on the far side and other ciliated neurons are not labeled. (D) Neuronal activity traces of the 11 chemosensory neurons in response to a single odorant presentation (1-octanol, 10−4 dilution), averaged across multiple trials across 14 animals. The number of trials varies across neurons because neurons that were occluded or improperly tracked were excluded from the dataset (see Materials and Methods). The 10-s odorant delivery period is shown by the colored bar. Significant responses (q ≤ 0.01) are marked with stars, with “post” indicating a significant response to stimulus removal (OFF response). Error bars (gray) are SEM.
Fig. 2.
Fig. 2.. Ensemble responses to a broad odorant panel.
Average peak responses of the 11 chemosensory neurons to odorants at (A) high concentration (10−4 dilution), (B) medium concentration (10−5 dilution), and (C) low concentration (10−6 dilution). Peaks were computed from a time window from onset of odor delivery to 10 s after odor removal. Responses are reported as ∆F/F0. Significant responses (q ≤ 0.01, two-tailed, paired t tests) are indicated with stars. Significant OFF responses are indicated with *P. Most odorants elicit significant responses from unique neuron combinations. (D) Schematic of coding strategy observed in (A) to (C). Different odorants evoke responses in distinct subsets of sensory neurons. Responses are generally stronger at high concentrations. Additional neurons are activated as concentration increases. (E) Dose responses of the peak responses of AWA, AWB, AWC, ASE, and ASH are diverse, with distinct concentration-dependent curves in response to different odorants. See fig. S3F for dose responses of the other six sensory neurons. Error bars are SEM. (F) PC space built from standardized peak average neural responses. Chemical class is indicated by color. Some odorant classes, such as alcohols and ketones, have more similar neural representations, while other odorant classes, such as esters, have more diverse representations. See fig. S3I for PC loadings.
Fig. 3.
Fig. 3.. Odorant representations in synaptic transmission mutants.
(A) Most of the chemical synapses in unc-13(s69) synaptic transmission mutants are nonfunctional. We recorded neural activity in these mutants during odor presentation. (B) When presented with the same odorants, similar sets of neurons significantly (q ≤ 0.01) responded in wild-type (WT) and unc-13 mutants. Significant OFF responses are indicated with *P.
Fig. 4.
Fig. 4.. Chemosensory neuron tuning.
(A) Fraction of odorants in our 23-odor panel, which elicited significant responses (q ≤ 0.01) in each neuron, at three different concentrations. We class neurons that responded to the majority of presented odors at high concentration as “broadly tuned” and neurons that responded to a small number of odors as “narrowly tuned.” For each neuron, we plot peak responses to odorants in a space constructed from chemical descriptors (fig. S3A). (B) The activity of broadly tuned neurons (ex: AWA) spans this space, while (C) the activity of narrowly tuned neurons (ex: ADF) is confined to a subset of chemically similar odorants. (D) At low concentrations, broadly tuned neurons respond to distinct subsets of odorants. (E) ASH, a polymodal nociceptor, is activated by all tested odorants at high concentration but is only activated by a small set of repulsive odorants at low concentration. See fig. S5 for these plots for all neurons. (F) Centroids of the significant responses at 10–4 dilution of each neuron in odor space, weighted by the strength of each response. These centroids project in different directions from the center, suggesting that each neuron is most sensitive to a particular region of odor space. (G) Average pairwise distance between the odors that activate each neuron at high (left), medium (center), and low (right) concentrations, compared to the average pairwise distance between all 23 odors as a baseline. The broadly tuned neurons (AWC, AWA, AWB, ASE, and ASH) span most of the space, while the odors that activate narrowly tuned neurons (ASJ, ASK, ASG, ADF, ASI, and ADL) tend to be closer to each other on average and thus more similar in the chemical space.
Fig. 5.
Fig. 5.. Representative comparisons of single-trial odorant responses.
(A) Low-dimensional UMAP representation of single-trial neural responses to all 23 odorants at 10−4 dilution. Responses to any given odorant generally cluster together. (B) Schematic of the multiclass classifier used for theoretical discriminability analysis of single-trial responses. The classifier was trained to predict odor identity from the peak responses of the ensemble of sensory neurons, generating a discriminability matrix. (C) Linear discriminability analysis of single-trial peak responses to high-concentration (10−4 dilution) odorants, with the presented odorant on the y axis and the classified odorant on the x axis. Circle size indicates the number of trials, with correct classifications colored blue and incorrect classifications colored red. The fraction of correctly classified trials for each odorant is to the right. Most of the single trials are correctly classified for each odorant. At lower concentrations, 10−5 dilution (D) and 10−6 dilution (E), classification accuracy diminishes. This is summarized in (F), a scatterplot of multiclass classification accuracy at different concentrations (C to E). (G) Within a given odorant (three examples shown), the concentration of the given odorant can be correctly classified on the basis of individual peak responses. (H) Across all odorants, concentration classification accuracy at different concentrations is shown.
Fig. 6.
Fig. 6.. Odorant discriminability is robust to virtual knockouts.
(A) By removing the responses of one or more neurons from the dataset fed into the multiclass classifier, we assess the relative importance of different neurons to the theoretical discriminability of single-trial neural responses. Linear discriminability analysis of single-trial data, with (B) AWA or (C) ASJ virtually removed from the dataset. Removing different neurons changes the discriminability matrix in different ways. (D) We virtually removed each neuron from the dataset and computed the average classification accuracy for each virtual knockout (KO). Classification accuracy remains close to wild type (all 11 neurons) but is degraded more severely by removal of narrowly tuned neurons (ASI, ASK, ASJ, and ASG) than by removal of broadly tuned neurons. (E) Virtually removing pairs of neurons produces further reductions in average classification accuracy. (F) Plotting average classification accuracy of different sets of virtual knockouts reveals a linear relationship between theoretical classification accuracy and the number of chemosensory neurons.
Fig. 7.
Fig. 7.. Odorant representations of pheromones.
(A) Average peak responses of the 11 chemosensory neurons to ascaroside pheromones #1, #2, #3, #5, and #8 at a concentration of 200 nM. Responses are reported as ∆F/F0, and significant responses (q ≤ 0.01) are indicated with stars. (B) Fraction of volatile odorants (out of 23 odorants total), which elicited significant responses in each neuron at high concentration (first row), compared with the fraction of pheromone stimuli (out of five stimuli total), which elicited significant responses (second row). Many neurons (such as ADF and ADL) that are narrowly tuned with respect to volatile odorants appear to be activated more often by the ascaroside pheromones.

References

    1. B. Malnic, J. Hirono, T. Sato, L. B. Buck, Combinatorial receptor codes for odors. Cell 96, 713–723 (1999). - PubMed
    1. K. Nara, L. R. Saraiva, X. Ye, L. B. Buck, A large-scale analysis of odor coding in the olfactory epithelium. J. Neurosci. 31, 9179–9191 (2011). - PMC - PubMed
    1. S. A. Kreher, D. Mathew, J. Kim, J. R. Carlson, Translation of sensory input into behavioral output via an olfactory system. Neuron 59, 110–124 (2008). - PMC - PubMed
    1. G. Si, J. K. Kanwal, Y. Hu, C. J. Tabone, J. Baron, M. Berck, G. Vignoud, A. D. T. Samuel, Structured odorant response patterns across a complete olfactory receptor neuron population. Neuron 101, 950–962.e7 (2019). - PMC - PubMed
    1. J. W. Wang, A. M. Wong, J. Flores, L. B. Vosshall, R. Axel, Two-photon calcium imaging reveals an odor-evoked map of activity in the fly brain. Cell 112, 271–282 (2003). - PubMed