. 2023 Apr;616(7957):452-456.
doi: 10.1038/s41586-023-05811-4. Epub 2023 Mar 1.

Ejecta from the DART-produced active asteroid Dimorphos

Jian-Yang Li  1 Masatoshi Hirabayashi  2 Tony L Farnham  3 Jessica M Sunshine  3 Matthew M Knight  4 Gonzalo Tancredi  5 Fernando Moreno  6 Brian Murphy  7 Cyrielle Opitom  7 Steve Chesley  8 Daniel J Scheeres  9 Cristina A Thomas  10 Eugene G Fahnestock  8 Andrew F Cheng  11 Linda Dressel  12 Carolyn M Ernst  11 Fabio Ferrari  13 Alan Fitzsimmons  14 Simone Ieva  15 Stavro L Ivanovski  16 Theodore Kareta  17   18 Ludmilla Kolokolova  3 Tim Lister  19 Sabina D Raducan  20 Andrew S Rivkin  11 Alessandro Rossi  21 Stefania Soldini  22 Angela M Stickle  11 Alison Vick  12 Jean-Baptiste Vincent  23 Harold A Weaver  11 Stefano Bagnulo  24 Michele T Bannister  25 Saverio Cambioni  26 Adriano Campo Bagatin  27   28 Nancy L Chabot  11 Gabriele Cremonese  29 R Terik Daly  11 Elisabetta Dotto  15 David A Glenar  30   31 Mikael Granvik  32   33 Pedro H Hasselmann  15 Isabel Herreros  34 Seth Jacobson  35 Martin Jutzi  20 Tomas Kohout  36   37 Fiorangela La Forgia  38 Monica Lazzarin  38 Zhong-Yi Lin  39 Ramin Lolachi  30   31 Alice Lucchetti  29 Rahil Makadia  40 Elena Mazzotta Epifani  15 Patrick Michel  41 Alessandra Migliorini  42 Nicholas A Moskovitz  17 Jens Ormö  34 Maurizio Pajola  29 Paul Sánchez  9 Stephen R Schwartz  43 Colin Snodgrass  7 Jordan Steckloff  43 Timothy J Stubbs  31 Josep M Trigo-Rodríguez  44
Affiliations

Ejecta from the DART-produced active asteroid Dimorphos

Jian-Yang Li et al. Nature. 2023 Apr.

Abstract

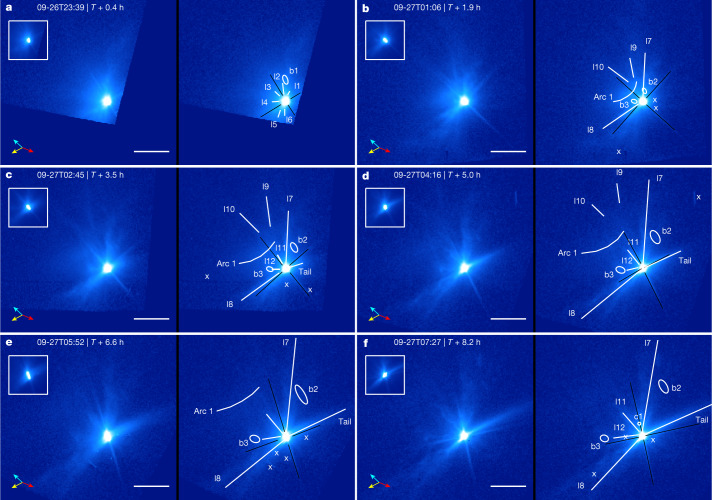
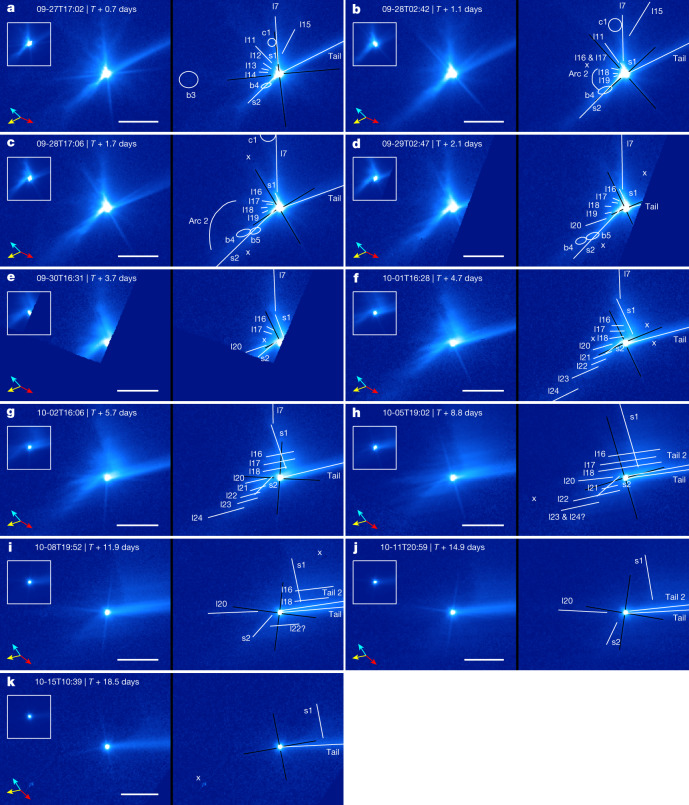
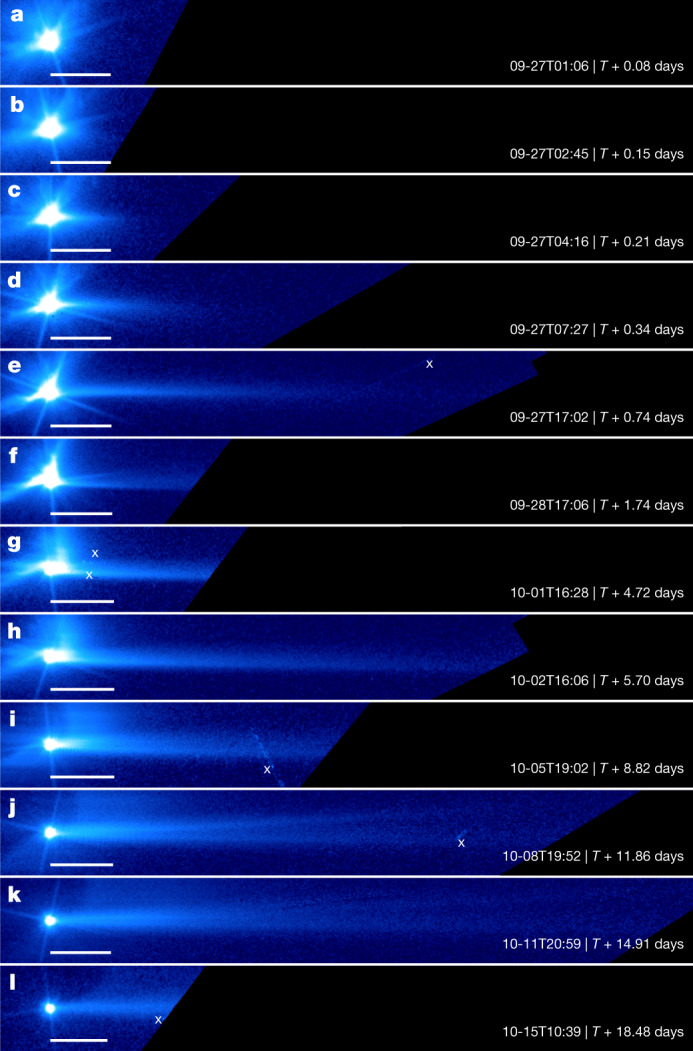
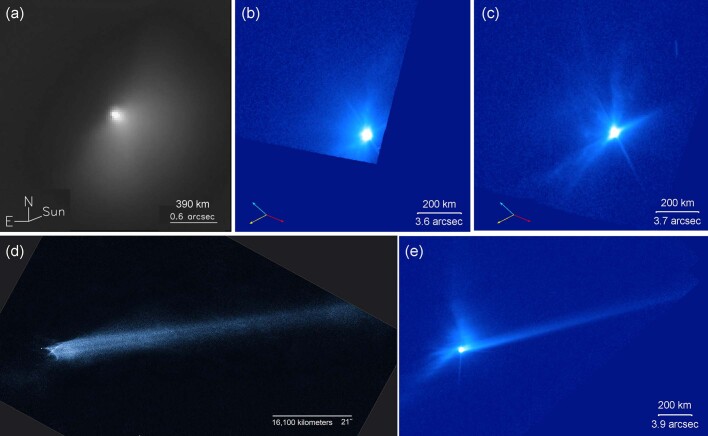
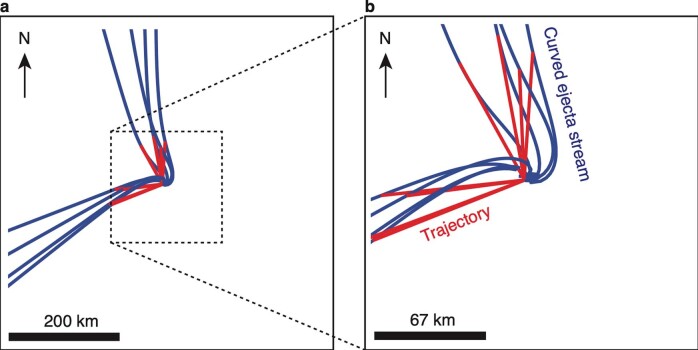
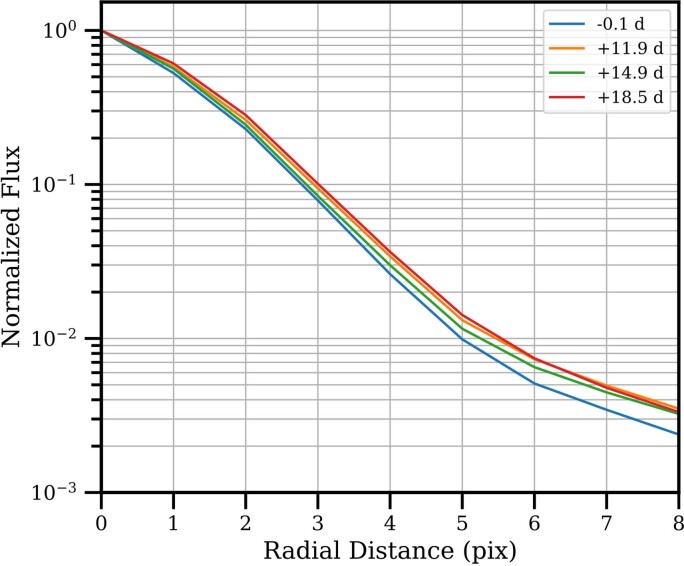
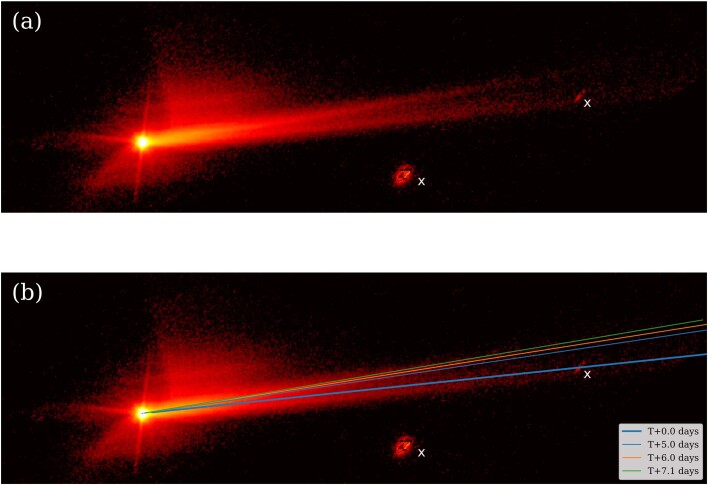
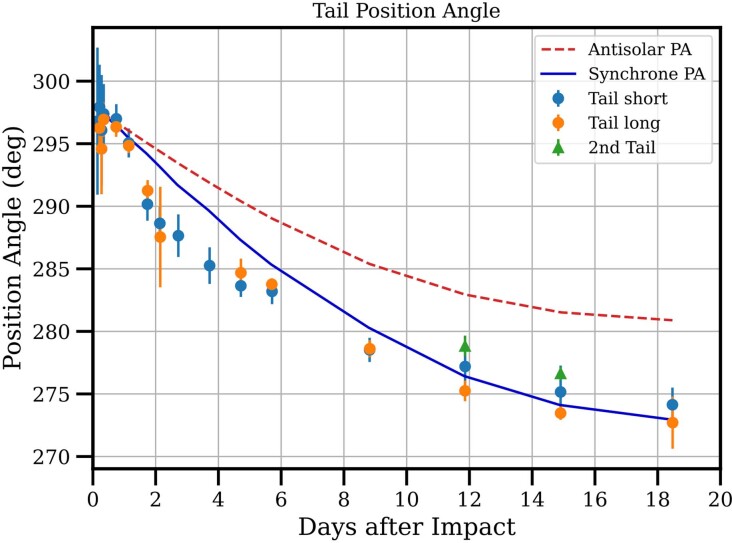
Some active asteroids have been proposed to be formed as a result of impact events1. Because active asteroids are generally discovered by chance only after their tails have fully formed, the process of how impact ejecta evolve into a tail has, to our knowledge, not been directly observed. The Double Asteroid Redirection Test (DART) mission of NASA2, in addition to having successfully changed the orbital period of Dimorphos3, demonstrated the activation process of an asteroid resulting from an impact under precisely known conditions. Here we report the observations of the DART impact ejecta with the Hubble Space Telescope from impact time T + 15 min to T + 18.5 days at spatial resolutions of around 2.1 km per pixel. Our observations reveal the complex evolution of the ejecta, which are first dominated by the gravitational interaction between the Didymos binary system and the ejected dust and subsequently by solar radiation pressure. The lowest-speed ejecta dispersed through a sustained tail that had a consistent morphology with previously observed asteroid tails thought to be produced by an impact4,5. The evolution of the ejecta after the controlled impact experiment of DART thus provides a framework for understanding the fundamental mechanisms that act on asteroids disrupted by a natural impact1,6.


Conflict of interest statement

The authors declare no competing interests.

Figures

Fig. 1
Fig. 1. Geometry of the Didymos system at the time of impact as viewed from the HST.
Sky north is in the upward direction and the east is on the left in this view. The equivalent diameters of Didymos (large spheroid) and Dimorphos (small spheroid) are 761 m and 151 m, respectively. The orbit of Dimorphos around Didymos before the impact, depicted by the black circle, has a semimajor axis of 1.206 ± 0.035 km3 and an eccentricity of <0.03 (ref. ). The sizes of Didymos and Dimorphos and their separation in the figure are to scale. The entire system lies within one pixel in the HST images. Dimorphos orbits Didymos clockwise with a speed of approximately 0.17 m s−1. The positive pole of Didymos (also the orbital pole of the system) is represented by the blue line, pointing close to the south celestial pole and 51º out of the sky plane away from Earth. The Sun is at a position angle of 118º, represented by the orange line and the dot-circle symbol. The DART spacecraft vector is represented by the red line, with arrows, going from east to west at a position angle of 68º and within 1º of the sky plane.
Fig. 2
Fig. 2. Evolution of Dimorphos ejecta from T + 0.4 h to T + 8.2 h.
af, All images are displayed in duplicate pairs, with the left unannotated for clarity and the right annotated with features marked by white markers and labels. The inset in the top left of each panel is the 100-pixel-wide region centred on the asteroids but with the flux scaled down 10 times to show the details of the bright core. The symbol ‘x’ marks artifacts due to, for example, residual cosmic rays, frame boundaries, background objects and defective pixels. The times correspond to the mid-observation time of each image. Black lines mark diffraction spikes. All images are displayed with the same logarithmic brightness scale. Sky north is in the upward direction and the east is to the left. The yellow arrows point to the direction of the Sun, the cyan arrows the heliocentric velocity direction of Didymos and the red arrows the direction of the DART spacecraft at impact, all projected in the sky plane at the time of observation. The HST had a pointing drift during the exposures of some images, causing a smear of about 4–7 pixels in the first four images (before T + 5.0 h) and about 14 pixels in the T + 6.6 h image, all along the northeast–southwest direction (Methods). The drift widens the tail and the two diffraction spikes orthogonal to the direction of the drift. Most features are much larger than the length of the drift; we added uncertainties to account for the effect of this drift in our measurements. Many features are visible, including linear features (l1–l12), an arc (arc 1), a circular feature (c1), blobs (b1–b3) and a tail. The ejecta cone is marked by linear features l7 and l8. Scale bars are 200 km at the distance of Didymos.
Fig. 3
Fig. 3. Evolution of ejecta from T + 0.7 days (T + 17.8 h) to T + 18.5 days.
The inset, image orientation, brightness stretch, scale bars and vector arrows are all the same as in Fig. 2. The symbol ‘x’ marks imaging artifacts. The main characteristics of the ejecta during this time period include the curved ejecta streams (s1 and s2), linear features (l7, l11–l24), blobs (b3–b5), a circular feature (c1) and an arc (arc 2). ag, The original north edge of the ejecta cone (l7) is still visible in images before T + 5.7 days. ae, The early southern curved stream (s2) could be overlapped with the southern edge of the original ejecta cone (l8), which is not separately marked. gk, The northern curved stream (s1) widened along the tail direction at about T + 5 days, forming a wing-like feature. bf, A group of linear features (l16–l24), some of which are part of the southern curved stream (l21–l24), showed a clockwise rotation around Didymos from T + 1.1 days to T + 4.7 days. gi, These linear features later (T + 5.7 days) stretched along the tail direction under solar radiation pressure, with those in the north of Didymos overlapping with the wing-shaped feature. hj, A secondary tail is visible between T + 8.8 days and T + 14.9 days (also see Fig. 4). The curved edge of the wing-like feature is visible in k. The question marks after the annotations of l23 & l24 in h and l22 in i mark the relatively uncertain identification of these features due to their faintness and the large changes in their positions and orientations from the previous images in the sequence.
Fig. 4
Fig. 4. Tail formation from the Dimorphos ejecta cloud.
al, All frames are rotated such that the expected direction of the tail based on our dust dynamic model (Methods) is in the horizontal direction extending towards the right. All frames are displayed with the same logarithmic brightness scale. The regions outside the field of view are marked by a dark blue colour. The symbol ‘x’ marks imaging artifacts. The scale bars are aligned with the asteroid at one end and extend 200 km towards the tail direction. a–c, Note that the first three frames have pointing-induced drift in the plane of the sky of 5–7 pixels approximately along the direction of the vertical diffraction spikes. The drift in all other frames is smaller than two pixels. The first frame (a) in this sequence acquired at T + 0.08 days (T + 1.9 h) shows no signs of a tail. A tail was visible starting from the second frame (b) acquired at T + 0.15 days (T + 3.5 h). The tail continued to grow in a direction that is, in general, consistent with an impulsive emission of dust from Dimorphos at the time of impact. ik, The secondary tail is visible between T + 8.82 days and T + 14.91 days, pointing at about 4º north of the original tail.
Extended Data Fig. 1
Extended Data Fig. 1. Comparison of the ejecta and tail morphology of Dimorphos with other objects.
(a) Deep Impact ejecta approximately one hour after impact observed by HST. (b) Dimorphos ejecta approximately T+0.4 h (Fig. 2a). (c) Dimorphos ejecta approximately T+5 h (Fig. 2d). (d) Tail of P/2010 A2 observed by HST on January 29, 2010 at a distance of 1.09 au4 (original image by NASA, ESA, D. Jewitt (UCLA), source: https://hubblesite.org/contents/media/images/2010/07/2693-Image.html?news=true, rotated to approximate north up). (e) Dimorphos tail observed on T+5.7 days (Fig. 4h). All images are displayed with north in the up direction and east to the left.
Extended Data Fig. 2
Extended Data Fig. 2. Illustration of curved ejecta streams seen by HST on T+2.1 days (Fig. 3d).
(a) The red lines represent the trajectories of eight dust particles ejected at 0.43 m/s, each involved in the northern or southern edges of the ejecta cone. The initial directions are based on the measured cone geometry (Methods). The trajectories are curved by the gravity of Didymos and Dimorphos. The curved dark blue lines are the locations of several particles ejected at different speeds along the same direction as the particle in each corresponding red curve, forming the observed curved ejecta streams. The area in the illustration is 600 km wide. (b) Same illustration as (a) but with a smaller scale, showing the more remarkable curvature in the ejecta streams near the binary system. These streams capture a snapshot of particles’ positions with initial ejection speeds less than <~ 1 m/s.
Extended Data Fig. 3
Extended Data Fig. 3. Tail brightness profile and ejecta particle size distribution.
(a) Brightness profiles along the tail from various images. The dashed lines are average surface brightness extracted along the tail with a width of 40 pixels (1.6”), offset vertically for clarity. The solid lines are corresponding best-fit power law models. Two sections are fitted separately for the profiles from the images collected on and after October 2, as described in the text. (b) Best-fit power law index for the differential size distribution (dSFD) of ejecta dust particles with respect to βsrp on the bottom axis and the corresponding particle radius (assuming a density of 3500 kg/m3) on the top axis. Filled circles are derived from the main tail, open triangles from the secondary tail. The horizontal error bars represent the range of βsrp covered by the corresponding tail profile. The colors of symbols correspond to the colors of profiles in panel (a). The slope values from the outer section have βsrp higher than 1x10⁻⁴, and those from the inner section correspond to βsrp between 1x10⁻⁴ and 1x10⁻⁵. The dashed horizontal line is the average −2.7 for the outer sections, and the green shaded area represents the standard deviation.
Extended Data Fig. 4
Extended Data Fig. 4. Brightness evolutions of Didymos and the ejecta.
(a) Total magnitude of Didymos in 10 km, 30 km, and 50 km radius apertures at the distance of Didymos measured from HST images as a function of time after impact. (b) Magnitude of ejecta with respect to time after impact. The black curve in both panels is the magnitude of Didymos based on the IAU HG phase function model with a G = 0.20, scaled to match the observed pre-impact magnitude. The ejecta magnitude corresponds to the difference between the observed total flux and the flux from Didymos. The ejecta is brighter than Didymos for about 2.5 days after impact in the 10 km radius aperture.
Extended Data Fig. 5
Extended Data Fig. 5. Azimuthally averaged radial profiles of Didymos and ejecta.
The curves are extracted from the pre-impact image (−0.1 d) and the last three images (+11.9 d, +14.9 d, and +18.5 d). The widened PSF profiles of late images suggest a slightly extended source due to ejecta dust close to the asteroid. 1 pixel corresponds to 0.04” or 2.1–2.3 km at the distance of Didymos in the last three images.
Extended Data Fig. 6
Extended Data Fig. 6. Synchrone analysis of the main tail and the secondary tail.
(a) Image taken at T+11.86 days is displayed in logarithmic brightness stretch. North is up and east to the left. The features marked by “x” are artifacts from a background object and a cosmic ray hit. (b) Same image as in (a) but with synchrones corresponding to various dates overlaid. The direction of the main tail is consistent with the synchrone at impact time (T+0.0 days), and the secondary tail is consistent with the synchrones between T+5.0 and T+7.1 days.
Extended Data Fig. 7
Extended Data Fig. 7. The position angles of the tail measured from HST images.
The blue circles are measured from the stacked images of the short exposures, and the orange circles are measured from the stacked images from the long exposures. The green triangles are the position angles of the secondary tail. The red dashed line is the antisolar direction, and the blue solid line is the position angle of synchrones for dust emitted at the time of impact. The tail orientation measured from the short exposures could be affected by the secondary tail due to the low signal-to-noise compared to the long exposures.

Comment in

References

    1. Jewitt, D. & Hsieh, H. H. The asteroid-comet continuum. Preprint at https://arxiv.org/abs/2203.01397 (2022).
    1. Daly, R. T. et al. Successful kinetic impact into an asteroid for planetary defence. Nature10.1038/s41586-023-05810-5 (2023). - PMC - PubMed
    1. Thomas, C. A. et al. Orbital period change of Dimorphos due to the DART kinetic impact. Nature10.1038/s41586-023-05805-2 (2023). - PMC - PubMed
    1. Jewitt D, Weaver H, Agarwal J, Mutchler M, Drahus M. A recent disruption of the main-belt asteroid P/2010 A2. Nature. 2010;467:817–819. doi: 10.1038/nature09456. - DOI - PubMed
    1. Snodgrass C, et al. A collision in 2009 as the origin of the debris trail of asteroid P/2010 A2. Nature. 2010;467:814–816. doi: 10.1038/nature09453. - DOI - PubMed

Publication types