. 2023 Mar;11(3):e005430.
doi: 10.1136/jitc-2022-005430.

TFAM deficiency in dendritic cells leads to mitochondrial dysfunction and enhanced antitumor immunity through cGAS-STING pathway

Affiliations

TFAM deficiency in dendritic cells leads to mitochondrial dysfunction and enhanced antitumor immunity through cGAS-STING pathway

Tianqi Lu et al. J Immunother Cancer. 2023 Mar.

Abstract

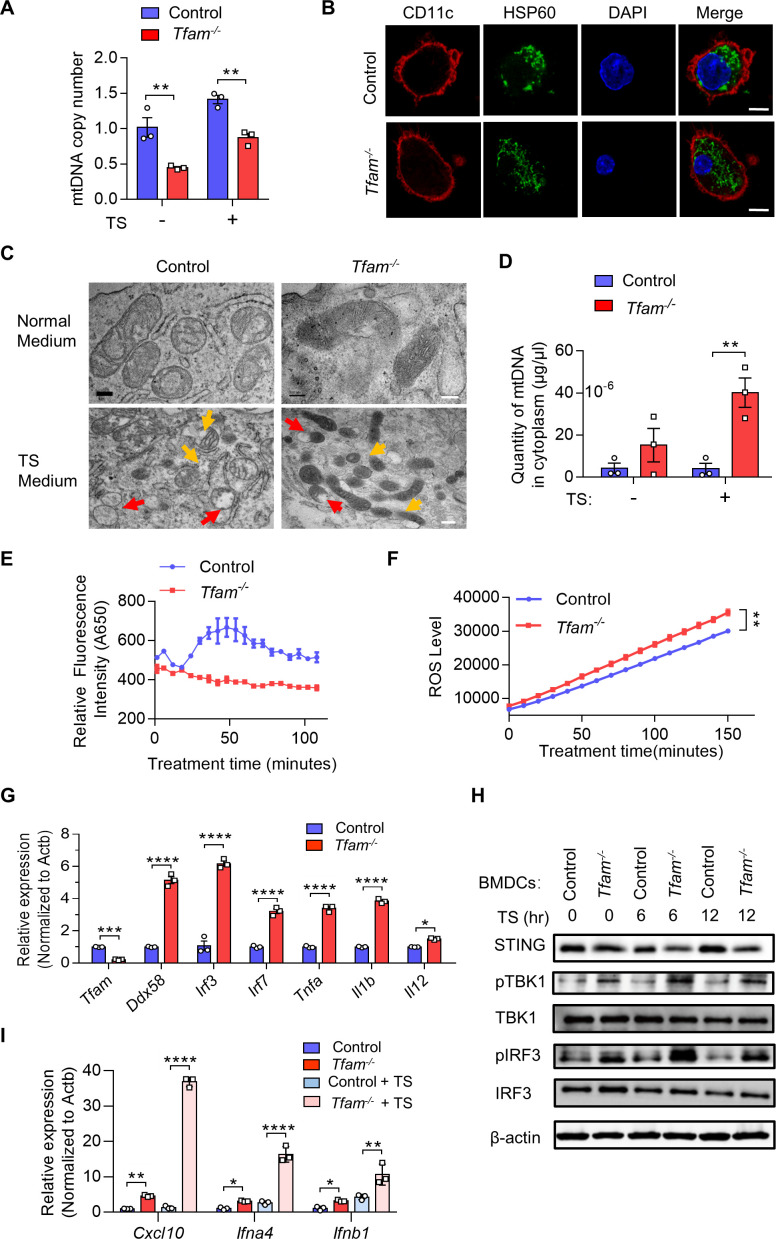
Background: Mitochondrial transcription factor A (TFAM) is a transcription factor that maintains mitochondrial DNA (mtDNA) stabilization and initiates mtDNA replication. However, little is known about the immune regulation function and TFAM expression in immune cells in the tumors.

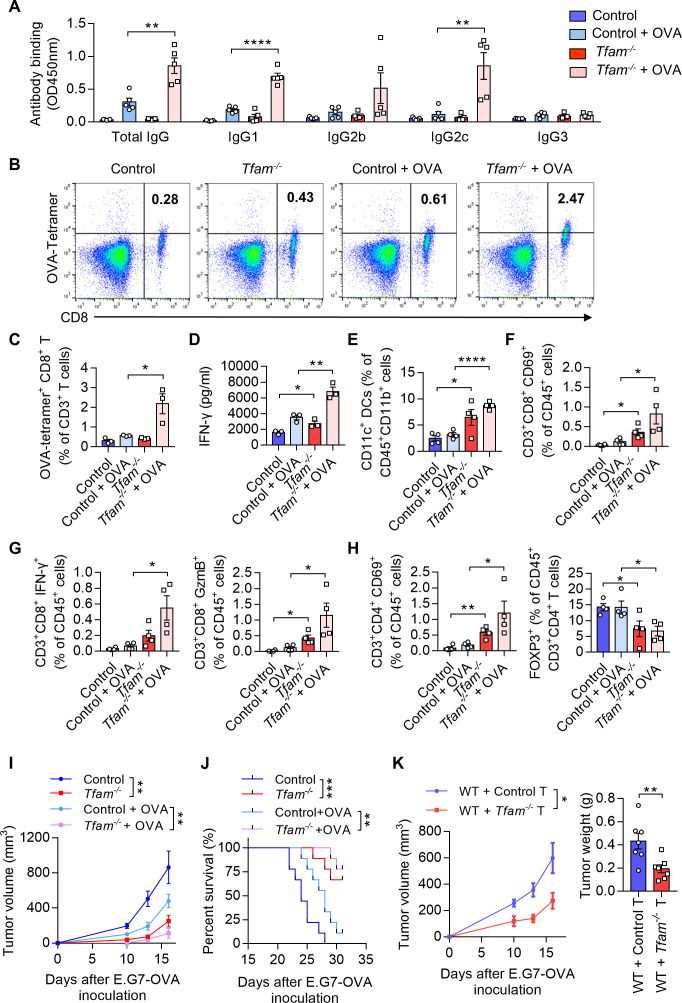
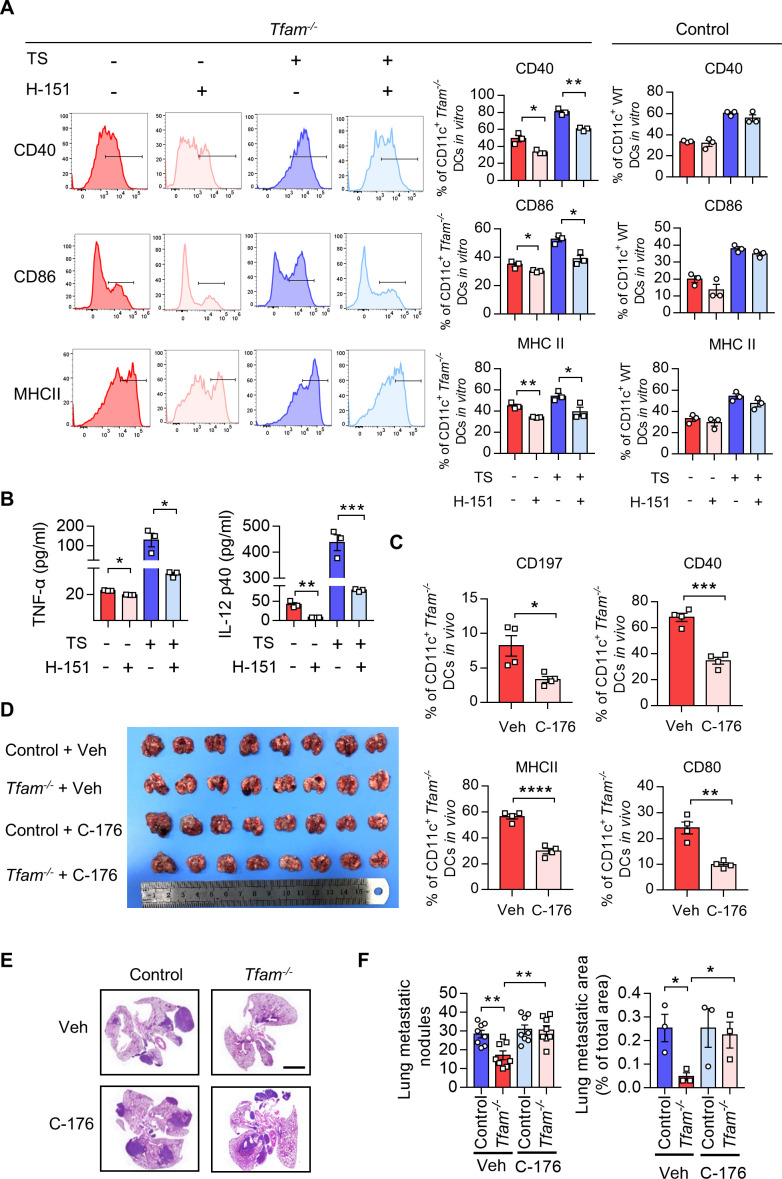
Methods: Mouse tumor models were applied to analyze the effect of TFAM deficiency in myeloid cell lineage on tumor progression and tumor microenvironment (TME) modification. In vitro, primary mouse bone marrow-derived dendritic cells (BMDCs) were used in the investigation of the altered function and the activated pathway. OVA was used as the model antigen to validate the activation of immune responses in vivo. STING inhibitors were used to confirm the STING activation provoked by Tfam deficient in DCs.

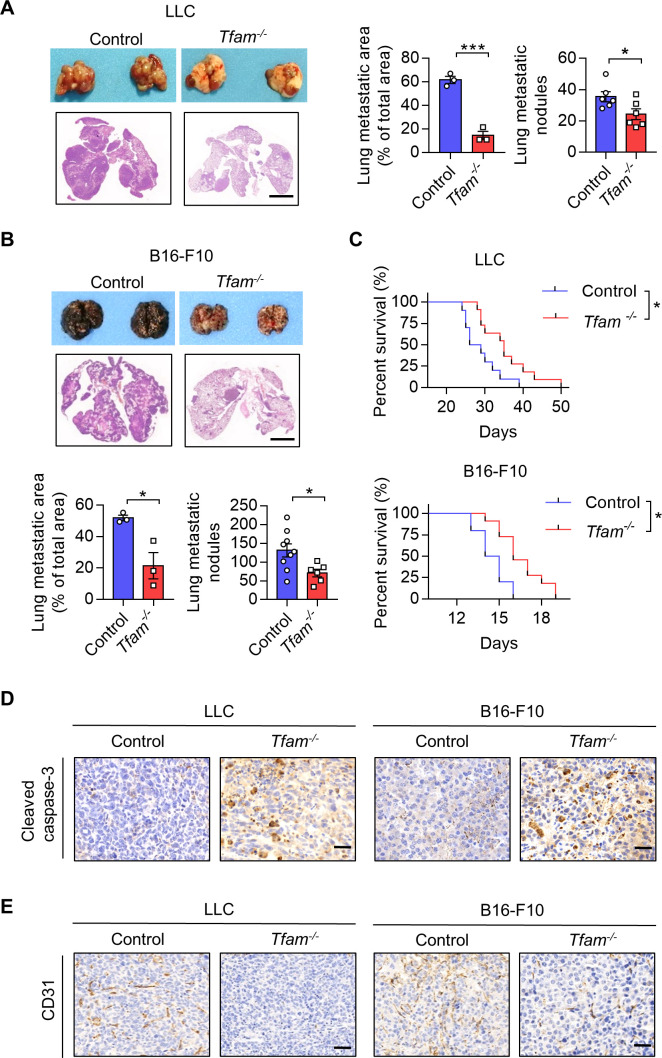
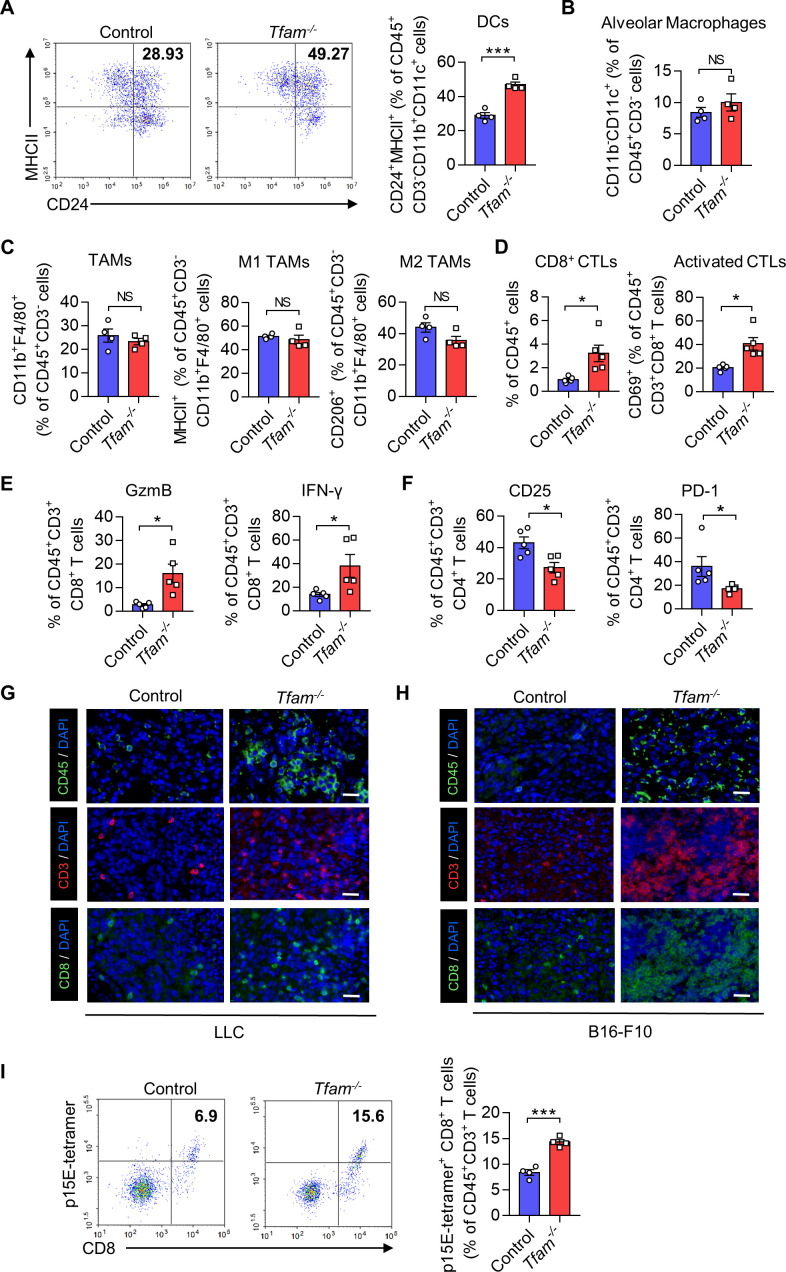
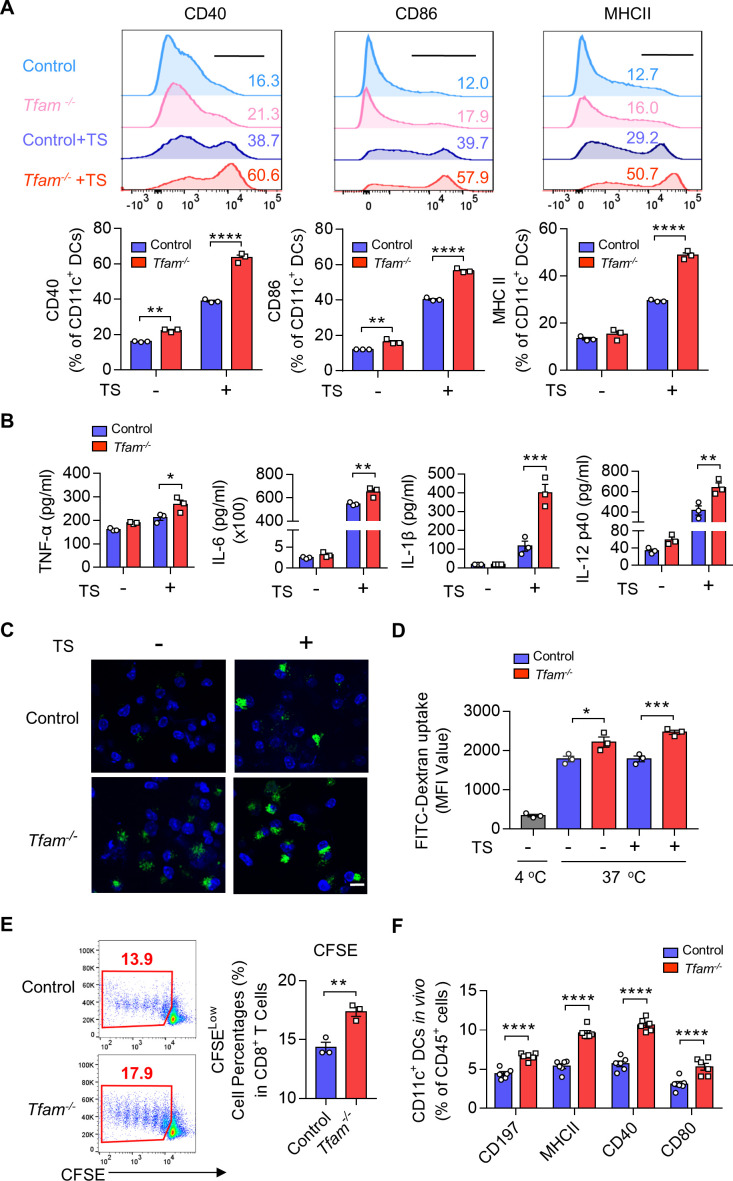
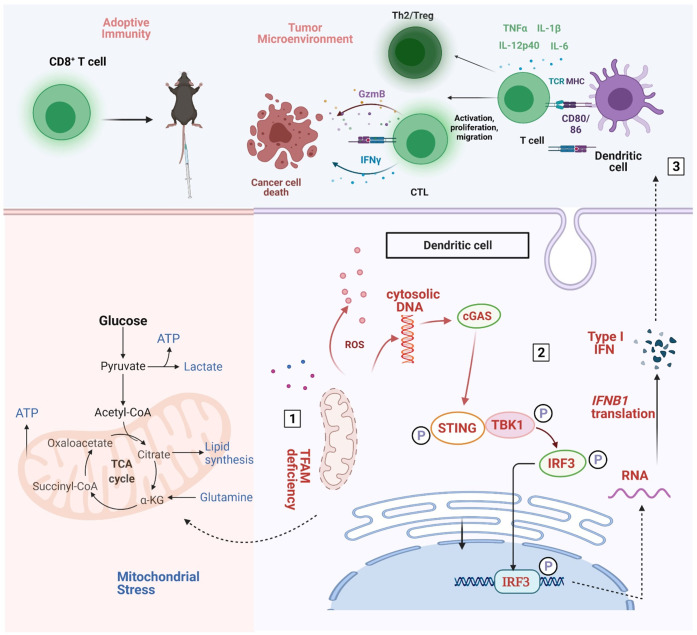
Results: The deletion of TFAM in DCs led to mitochondrial dysfunction and mtDNA cytosolic leakage resulting in the cGAS-STING pathway activation in DCs, which contributed to the enhanced antigen presentation. The deletion of TFAM in DCs has interestingly reversed the immune suppressive TME and inhibited tumor growth and metastasis in tumor models.

Conclusions: We have revealed that TFAM knockout in DCs ameliorated immune-suppressive microenvironment in tumors through STING pathway. Our work suggests that specific TFAM knockout in DCs might be a compelling strategy for designing novel immunotherapy methods in the future.


Conflict of interest statement

Competing interests: No, there are no competing interests.

Figures

Figure 1
Figure 1
Low expression of Tfam in myeloid inhibits lung tumor growth. (A, B) Tfam deletion in myeloid inhibited tumor growth in LLC (A) or B16-F10 (B) lung metastatic tumor models. LLC cells (5×10⁵) or B16-F10 cells (2×10⁵) were intravenously injected into control or Tfam-/- mice to establish experimental pulmonary metastasis models (n=6–9 mice), Tfamfl/fl littermates and wild type were used as control. Mice were sacrificed on day 24 (LLC models) or day 14 (B16-F10 models), and pulmonary physiology was evaluated, including gross images and H&E staining of lung, measurement of metastatic area (n=3 mice’s lungs were paraffin embedded) and nodules (n=6–9 mice). Scale bars represent 2 mm. (C) Tfam deletion in myeloid prolonged the survival of tumor-bearing mice. Survival statistics of mice from LLC (5×10⁵) or B16-F10 (5×10⁵) lung metastatic tumor models (n=10–11 mice). (D, E) Immunohistochemical staining of cleaved caspase-3 (D) or CD31 (E) in lungs of the mice described in (A, B). Scale bars represent 20 µm. Data are represented as mean±SEM. Statistical significance in (A, B) was determined by a two-sided unpaired t-test. Survival curve data in (C) were analyzed by log-rank (Mantel-Cox test). Representative results in (A–C) and pictures in (A, B, D, E) from two independent experiments are shown. *p<0.05, ***p<0.001. LLC, Lewis lung carcinoma.
Figure 2
Figure 2
TFAM deletion in myeloid transforms tumor immune microenvironment and increases lymphocyte infiltration. (A–F) LLC cells (5×10⁵) were intravenously injected into control or Tfam-/- mice to establish experimental pulmonary metastasis models. Mice were sacrificed on day 24 to collect the lungs. Then the single-cell suspension of the whole lungs with metastatic tumors was prepared and subjected to FCM analysis. (A) Representative scatterplots of the gated DCs (CD45+ CD3- CD11b+ CD11c+ MHCII+ CD24+) are shown in the left panel and quantified in the right panel (n = 4 mice). (B) The percentages of alveolar macrophages (CD45+ CD3- CD11b- CD11c+) are quantified (n = 4 mice). (C) The percentages of TAMs (CD45+ CD3- CD11b+ F4/80+), M1 TAMs (CD45+ CD3- CD11b+ F4/80+ MHCII+), and M2 TAMs (CD45+ CD3- CD11b+ F4/80+ CD206+) are quantified (n = 4 mice). (D) The percentages of CD3+ CD8+ CTLs gated from CD45+ cells (left panel) and activated CD69+ CTLs gated from CD45+ CD3+ CD8+ (right panel) are quantified (n=5 mice). (E) The percentages of GzmB+ or IFN-γ+ T cells are quantified. Cells are gated from CD45+ CD3+ CD8+ subpopulation (n=5 mice). (F) The percentages of CD25+ or PD-1+ T cells are quantified. Cells are gated from CD45+ CD3+ CD4+ subpopulation (n=5 mice). (G, H) Immunofluorescence staining of CD45 (green), CD3 (red), CD8 (green) and DAPI (blue) in lungs of the mice from pulmonary metastasis models of LLC (G) or B16-F10 (H). Scale bars represent 20 µm. (I) B16-F10 cells (2×10⁵) were intravenously injected into control or Tfam-/- mice to establish experimental pulmonary metastasis models. Mice were sacrificed on day 14, then the single cell suspension of the whole lung with metastatic tumor was prepared and subjected to FCM analysis. Representative scatterplots of the p15E-specific CD8+ T cells are shown in the left panel and quantified in the right panel. Cells are gated from CD45+ CD3+ subpopulation (n=4 mice). Data are presented as mean±SEM. Statistical significance in (A–F, I) was determined by a two-sided unpaired t-test. Representative results in (A–F, I) and pictures in (G, H) from two independent experiments are shown. *p<0.05, ***p<0.001, NS, not significant. LLC, Lewis lung carcinoma. FCM, flow cytometry; DC, dendritic cell; MHC, major histocompatibility complex; TAMs, tumor-associated macrophages.
Figure 3
Figure 3
TFAM deficiency activates DC both in vitro and in vivo. (A) Tfam deficiency promotes the maturation of DCs before or after TS stimulation in vitro. BMDCs from control or Tfam-/- mice were stimulated with or without LLC tumor supernatant (TS) for 24 hours, then subjected to flow cytometry analysis to detect the expression of costimulatory molecules. The upper panel shows the representative histograms of the gated CD11c+ DCs (n = 3 biologically independent samples). The quantitative data of flow cytometry results are shown in the lower panel. (B) Tfam deficiency promotes the secretion of inflammatory cytokines of DCs after TS stimulation for 24 hours in vitro. Levels of TNF-α, IL-6, IL-1β, and IL-12 p40 in the supernatant from BMDCs treated as in (A) were detected by ELISA (n = 3 biologically independent samples). The original levels of cytokines in TS were subtracted. (C) Tfam deficiency promotes the antigen uptake of DCs in vitro. BMDCs were stimulated with or without TS for 24 hours, followed by incubation with 1 mg/mL FITC‐Dextran for 1 hour at 37°C and then analyzed under a fluorescent microscope. Scale bars represent 10 µm. (D) The mean fluorescence intensity (MFI) of CD11c+ BMDCs in (C) was further analyzed by flow cytometry (n = 3 biologically independent samples). The control group was performed by co-culturing BMDCs with FITC-dextran at 4°C. (E) Tfam deficiency promotes the antigen presentation of DCs in vitro. Representative scatterplots of the gated CD8+ T cells from OT-I mice are shown in the left panel and quantified in the right panel. Numbers indicate the percentage of proliferated CFSE-negative CD8+ T cells from OT-I mice (n = 3 biologically independent samples). (F) Tfam deficiency promotes the migration and maturation of DCs in vivo. Single-cell suspension of lymph nodes from control or Tfam-/- mice were subjected to flow cytometry analysis. The percentages of CD197+, MHC II+, CD40+, or CD80+ of CD11c+ DCs are quantified from CD45+ gated subpopulation (n=6 mice). Data are presented as mean±SEM. Statistical significance was determined by two-way ANOVA in (A, B, F) or a two-sided unpaired t-test in (D, E). Representative results in (A, B, D, F) and pictures in (C) from three independent experiments are shown. Representative results in (E) from two independent experiments are shown. *p<0.05, **p<0.01, ***p<0.001, ****p<0.0001. ANOVA, analysis of variance; BMDCs, bone marrow-derived dendritic cells; MHC, major histocompatibility complex. CFSE, carboxyfluorescein succinimidyl ester.
Figure 4
Figure 4
TFAM deficient DC enhanced specific humoral and cellular immune responses. (A) Tfam deficiency enhances the specific anti-OVA humoral immunity. Control and Tfam-/- mice were vaccinated subcutaneously three times with or without 10 µg OVA antigen in PBS on days 0, 14, and 21. The mouse serum were collected on day 28 and levels of the total IgG and IgG subclasses were determined by ELISA. Serum antibody binding was determined by absorbance at 450 nm (n=5 mice). (B–D) Tfam deficiency enhances the specific anti-OVA cellular immunity. Splenic lymphocytes from immunized mice in (A) were isolated on day 28 and further incubated in vitro with CD8+ specific OVA257–264 peptides (10 µg/mL) for 72 hours. The generation of CD8+ CTLs was determined by FCM using PE-conjugated H-2Kb/OVA257–264 tetramer. Representative scatterplots of the OVA-specific CD8+ T cells gated from CD3+ cells are shown in (B) and quantified in (C). Level of IFN-γ in the supernatant was measured by ELISA (D) (n=3 mice). (E) Frequency of CD11c+ DCs in the spleen gated from CD45+ CD3- CD11b+ are determined (n=4 mice). (F) Frequency of CD3+ CD8+ CD69+ CTLs in the spleen gated from CD45+ are determined (n=4 mice). (G) Frequency of CD3+ CD8+ IFN-γ+ CTLs in the spleen gated from CD45+ are determined in the left panel, and frequency of CD3+ CD8+ GzmB+ CTLs in the spleen gated from CD45+ are determined in the right panel (n=4 mice). (H) Frequency of CD3+ CD4+ CD69+ T cells in the spleen gated from CD45+ are determined in the left panel, and frequency of FOXP3+ T cells in the spleen gated from CD45+ CD3+ CD4+ are determined in the right panel (n=4 mice). (I) Tfam deficient potentiates the antitumor effect of OVA vaccine in vivo. In the prophylactic model, control or Tfam-/- mice were immunized as in (A) (n=5 mice) and then injected subcutaneously with E.G7-OVA cells (5×10⁵) 1 week after the third immunization. Tumor growth was monitored at the indicated times. (J) Tfam deficiency potentiates the survival of OVA-vaccinated tumor-bearing mice. Control and Tfam-/- mice were immunized with OVA and injected with E.G7-OVA (5×10⁵) as previously described. Survival of mice was monitored daily (n=9 mice). (K) In the cellular adoptive therapy model, CD8+ T lymphocytes were isolated from immunized mice as in (A) on day 28 and subsequently injected intravenously into recipient mice, which were wild type mice subcutaneously inoculated with E.G7-OVA (5×10⁵) cells. Tumor growth was monitored at the indicated times (left panel) and tumor weight was recorded after sacrifice on day 16 post-transplantation (right panel) (n=7 mice). Data represent the mean±SEM. Statistical significance was determined by two-way ANOVA in (I), left panel of (K) or a two-sided unpaired t-test in (A, C–H, right panel of K). Survival curve data in (J) were analyzed by log-rank (Mantel-Cox test). Representative results in (A–K) from two independent experiments are shown. *p<0.05, **p<0.01, ***p<0.001, ****p<0.0001. ANOVA, analysis of variance; DC, dendritic cell; i.v., intravenous.
Figure 5
Figure 5
TFAM deficiency in DCs results in mitochondrial stress, cytoplasmic leak of mtDNA, and activation of cGAS-STING pathway. (A–C) Tfam deficiency induced the mitochondrial stress of DCs. (A) BMDCs from control or Tfam-/- mice were stimulated with or without LLC TS and then subjected to qPCR analysis to detect the mtDNA copy numbers (n = 3 biologically independent samples). (B) Immunofluorescence staining of CD11c (red), HSP60 (green), and DAPI (blue) in BMDCs in vitro. Scale bars represent 10 µm. (C) Representative transmission electron microscopy (TEM) images of mitochondria in BMDCs from control or Tfam-/- mice stimulated with or without LLC TS. Scale bars represent 200 nm (upper two rows) or 500 nm (lower two rows), respectively. (D) Tfam deficiency induced the cytoplasmic leak of mtDNA of DCs. BMDCs from control or Tfam-/- mice were stimulated with or without LLC TS and then subjected to qPCR analysis to detect the quantity of mtDNA (n = 3 biologically independent samples). (E, F) Tfam deficiency in DCs results in altered mitochondrial respiratory chain or oxidative stress. BMDCs from control or Tfam-/- mice were subjected to extracellular oxygen consumption rates (OCR) (E) or ROS level (F) detection after TS stimulation at indicated times (n=3 biologically independent samples). (G) Deletion of Tfam induces the target genes of cGAS-STING pathway expression. Relative mRNA levels of indicated genes in BMDCs from control or Tfam-/- mice were measured by qPCR (n = 3 biologically independent samples). (H) Tfam deficiency activates cGAS-STING pathway of DCs. BMDCs from control or Tfam-/- mice were stimulated with LLC TS for the indicated times and cell lysates were collected for Western blot to detect the phosphorylation and protein levels of the indicated proteins. (I) Deletion of Tfam induces the expression of downstream target genes of cGAS-STING pathway. BMDCs from control or Tfam-/- mice were stimulated with or without LLC TS and then Cxcl10, Ifna4, and Ifnb1 mRNAs were measured by qPCR (n = 3 biologically independent samples). LLC, Lewis lung carcinoma. Data represent the mean±SEM. Statistical significance was determined by two-way ANOVA in (A, D, F, I) or a two-sided unpaired t-test in (G). Representative results in (A, D, E, F, G, I) and pictures in (B, C) from three independent experiments are shown. The western blot in (H) was performed twice with similar results. *p<0.05, **p<0.01, ***p<0.001, ****p<0.0001. ANOVA, analysis of variance; BMDCs, bone marrow-derived DCs; DCs, dendritic cell; TS, tumor supernatant.
Figure 6
Figure 6
STING antagonism restricts DC maturation and potentiates tumor progression in Tfam-/- mice. (A) Blockade of STING strongly repressed the maturation of DCs induced by Tfam deficiency. BMDCs from Tfam-/- mice were stimulated with or without TS or H-151 for 24 hours and then subjected to flow cytometry analysis to detect the expression of costimulatory molecules. The left panel shows the representative histograms of the gated CD11c+ Tfam-/- DCs. The quantitative data of flow cytometry results are shown in the right panel (n=3 biologically independent samples). (B) Blockade of STING noticeably reduced the secretion of inflammatory cytokines of DCs induced by Tfam deficiency. BMDCs from Tfam-/- mice were similarly treated as in (A), and then levels of TNF-α and IL-12 p40 in the supernatant were detected by ELISA (n = 3 biologically independent samples). The original levels of cytokines in TS were subtracted. (C) Blockade of STING significantly abolished the migration and maturation of Tfam-/-DCs in vivo. Single-cell suspension of lymph nodes from Tfam-/- mice treated with C-176 (13.4 mg/kg) or Veh (solvent) were subjected to flow cytometry analysis. The percentages of CD197+, MHCII+, CD40+, or CD80+ DCs are quantified from CD11c+ gated subpopulation (n=4 mice). (D–F) Blockade of STING re-accelerates tumor progression in Tfam-/- mice. LLC cells (5×10⁵) were intravenously injected into control or Tfam-/- mice to establish experimental pulmonary metastasis models (n=8 mice). Mice simultaneously received daily intraperitoneal injections of C-176 (13.4 mg/kg) or Veh (solvent) and sacrificed on day 24. The gross appearance (D) and H&E staining (E) of the lungs were also examined and the lung metastasis nodules and metastatic area (n=3 mice’s lungs were paraffin embedded) were evaluated (F). Scale bars represent 2 mm. LLC, Lewis lung carcinoma. Data represent the mean±SEM. Statistical significance was determined by a two-sided unpaired t-test in (AB, C, F). Representative results in (A, B) and picture in (A) from three independent experiments are shown. Representative results in (C–F) and pictures in (E) from two independent experiments are shown. *p<0.05, **p<0.01, ***p<0.001, ****p<0.0001. BMDCs, bone marrow-derived DCs; DC, dendritic cell; MHC, major histocompatibility complex; TS, tumor supernatant.
Figure 7
Figure 7
Schematic diagram of the mechanistic findings. Tfam deficiency in DCs resulted in mitochondrial metabolism abnormalities (number 1), then the cGAS-STING pathway actived (number 2), subsequently enhanced the immunity of DCs and T cells and resultantly inhibiting lung metastases of the tumor by remodeling the tumor microenvironment (number 3). Furthermore, spleen T lymphocytes of immunized Tfam-/- mice displayed stronger antitumor immunity when adoptively transferred into tumor-bearing wild type mice. DCs, dendritic cells.

References

    1. Durai V, Murphy KM. Functions of murine dendritic cells. Immunity 2016;45:719–36. 10.1016/j.immuni.2016.10.010 - DOI - PMC - PubMed
    1. Gardner A, Ruffell B. Dendritic cells and cancer immunity. Trends Immunol 2016;37:855–65. 10.1016/j.it.2016.09.006 - DOI - PMC - PubMed
    1. Keskin DB, Anandappa AJ, Sun J, et al. . Neoantigen vaccine generates intratumoral T cell responses in phase ib glioblastoma trial. Nature 2019;565:234–9. 10.1038/s41586-018-0792-9 - DOI - PMC - PubMed
    1. Hammerich L, Marron TU, Upadhyay R, et al. . Systemic clinical tumor regressions and potentiation of PD1 blockade with in situ vaccination. Nat Med 2019;25:814–24. 10.1038/s41591-019-0410-x - DOI - PubMed
    1. Vander Heiden MG, DeBerardinis RJ. Understanding the intersections between metabolism and cancer biology. Cell 2017;168:657–69. 10.1016/j.cell.2016.12.039 - DOI - PMC - PubMed

Publication types